Application to a Modern Example of Language Shift
As evidenced in Sect. 7.2, there have been ongoing processes of language shift throughout history up to the present day. In fact, in recent times we have been experiencing a global process of linguistic convergence towards a few stronger languages—such as English, Spanish or Chinese—leading to the endangerment or extinction of many languages (Krauss 1992; Crystal 2000).
Indeed, linguists estimate the about 96 % of the population speaks only about 4 % of the languages in the world (Crystal 2000), and that about 90 % of the current linguistic diversity may become extinct by the end of the century (Krauss 1992).It is actually this concern over the future of minority languages that have prompted the development of several existing language competition models (e.g., Abrams and Strogatz 2003; Kandler et al. 2010; Isern and Fort 2014); studies that in turn provide a source of data to exemplify here the model presented above. We will focus on the evolution of the Welsh language during the twentieth century. Up to the 1970, when linguistic policies started to be applied, the number of Welsh speakers had been decreasing year after year (Kandler et al. 2010), and the linguistic border had been progressively retreating—at an approximate speed of 0.30.6 km/y, according to the estimates obtained from linguistic maps by Fort and Perez-Losada (2012).
It corresponds therefore to a case of language acquisition from a neighbouring region with a moving linguistic border, and thus a good subject to test the models described above. Of course, since Wales is part of the United Kingdom, and with English being the official language, there is a factor related to the elite dominance described above. However, Wales have been part of the UK for a long time and the most relevant language shift process has taken place in the recent time (Aitchison and Carter 2000); indeed, in the early 1900s, half of the population still spoke Welsh, while by 1980 less than 20 % of the population could speak the language (Abrams and Strogatz 2003).
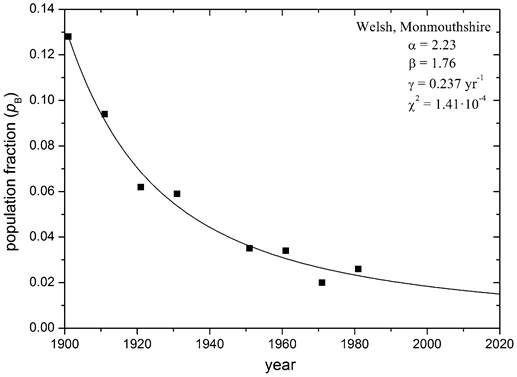
Applying the language shift model described by Eq. 7.2 to the evolution of the Welsh and English languages during the twentieth century in the region of Monmouthshire yields a very good fit between model and data.1 This is evidenced by the results in Fig. 7.1, where the line in the figure represents the best approximation to the historical demographic data (squares) obtained for Eq. (7.2). The parameter values yielding this best fit are a = 2.23, ft = 1.76 and y = 0.237.
We now can apply the parameters found above into our spatial model, i.e. the model represented by Eq. 7.4, where we take into account the geographical evolution in addition to the temporal change, as well as into Eqs. 7.5 and 7.6, which provide an estimated range of speeds for the progress of the linguistic border. To do so we will consider two realistic values of the diffusion coefficient, D = 5.08 km[5] [6]/y and D = 6.72 km2/y. Both are estimated from the expression D = (A2)/4T (Fort and Mendez 1999), where (A2) is an estimation of the mobility of a population over a generation, and T the time span of a generation. In both cases we use a value of the generation time corresponding to modern human populations, T = 25y (Fort and Perez-Losada 2012). Then, the first value for the diffusion coefficient is estimated from mobility data on modern populations in the Parma Valley, Italy, during the twentieth century and thus coetaneous with the data for the Welsh language; in this case (A2) = 508 km2 (Isern et al. 2008; Cavalli-Sforza and Bodmer 1999). The second value is estimated from mobility data in Catalonia, Spain, during the eighteenth and nineteenth centuries, with (A2) =672 km2 (Heras de Puig 2000). To compute the theoretical values for the front speed we have obtained the parameters from data corresponding only to the region of Monmouthshire rather than the data on all of Wales (also available in Abrams and Strogatz 2003). The predicted speeds of the linguistic frontier are shown in Table 7.1, for each of the two values of the diffusion coefficient. The second column corresponds to the results of the numerical simulation, and thus the exact speed of the linguistic front for a system whose dynamics may be described by Eq. 7.4; i.e. a population without substantial population growth and where the prevalent language from an Decline of the fraction of Welsh speakers over time (squares) and best fit (line) obtained Fig. 7.1 with Eq. 7.2. (Adapted from Isern and Fort 2014) Table 7.1 Numerical (c) and analytic (cL, cv) predictions of the English linguistic front replacing the Welsh language km2/y km/y km/y km/y adjacent regions is displacing the indigenous language. Comparing these theoretical values with the speed range estimated from data, 0.3-0.6 km/yr (Fort and Per- ez-Losada 2012), we see that we obtain good agreement between model and observations. Therefore, the model can indeed predict with a fairly good accuracy the actual speed of the linguistic frontier. In addition, the last two columns in Table 7.1 contain the values of the upper and lower analytic bounds calculated using Eqs. 7.5 and 7.6, respectively. We see that, as expected, the exact solution lies within those bounds. But, what is more important, we see that the ranges obtained are also fairly consistent with the observed data values, and thus, these equations can be used as a first approximation of the expected front of linguistic replacement without the need to apply numerical integration. 7.6
D c cL cU 5.08 0.557 0.356 0.934 6.72 '0.641 0.409 1.750