Assuming 20 Unique Raw Materials
Raw Material Richness in Tool Kit When a forager engages in random walk, a more clustered environment leads to lower average raw material richness in the toolkit (Fig. 4.7). The random walk data has a significant strong positive relationship with the pr values (Spearman’s rs = 0.99; p = 0.0002).
Compared to the result of the three different walk modes when assuming 5000 unique raw materials, the random walk while assuming 20 unique raw materials produces, not surprisingly, on average a much lower richness in the tool kit. However, as seen above, when clustering increases, the forager will on average move longer periods without encountering a source. Coupled with the fact that the forager uses a material at every step, the forager will then when encountering a source fill up the tool kit to the maximum capacity, which results in one raw material dominating the make-up of the tool kit in terms of frequency.Distance Materials Move Until Discarded In terms of the distances that raw materials are moved until discarded, when the forager engages in random walk, greater clustering leads to increased travel distance (Fig. 4.8). However, this relationship is not statistically significant. The random walk data has a non-significant and moderate negative relationship with the pr values (Spearman’s rs = -0.6; p = 0.2). Similar to random walk simulations with the assumption of 5000 unique raw materials, the raw material richness increases with increased random
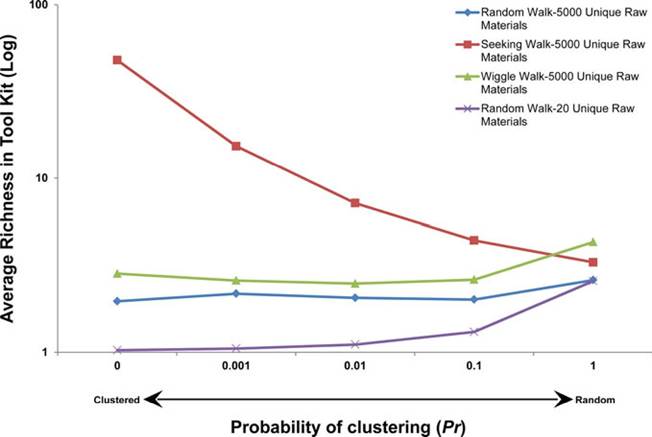
Fig. 4.7 Average richness of toolkit. Y values are shown as log values. Each curve is based on the average of 100 simulation runs
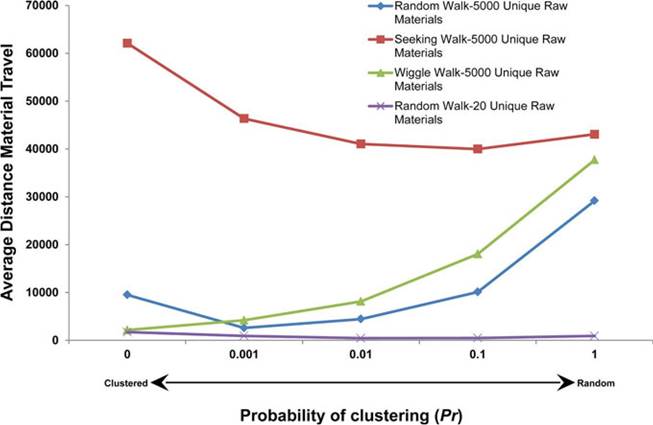
Fig. 4.8 Average distance materials are travelling from the source.
Each curve is based on the average of 100 simulation runsdistribution of sources in turn leading to a decreased probability that any one raw material is consumed. This decreased probability means that there is increased chance that any one raw material will stay in the tool kit for a longer time. However, compared to the 5000 unique raw materials assumption, here a maximum of 20 raw materials could be available out of the 100 possible in the tool kit. This means that compared to a situation where there are 100 unique raw materials available for consumption, this overall low richness increases the probability that any one raw material is consumed, which results in similar types of raw materials being carried for shorter distances before being consumed.
Time Steps Without Material in Tool Kit The result shows that when resources are more clustered than simulated in the original neutral model, we can expect that foragers run out of materials for longer periods of time (Fig. 4.9). The random walk data has a significant and strong negative relationship with the pr values (Spearman’s rs = -0.9; p = 0.02). Compared to the analysis with 5000 unique raw materials, the 20 unique materials analysis numbers are very similar. If engaging in random walk, the forager will on average spend about 104 time steps without materials when the raw materials are randomly placed on the landscape as in the original neutral model (Table 4.3). As clustering increases, the time steps without raw materials in the tool kit increases 10-15 times. Decreasing the number of unique raw materials does not affect the finding that increased clustering leads to increased time without raw materials in the tool kit.
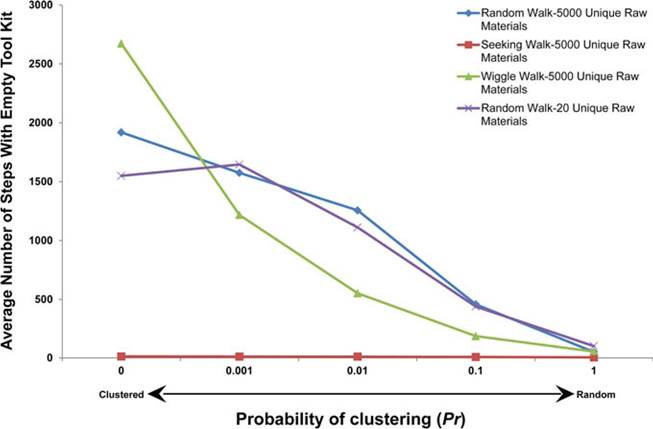
Fig. 4.9 Average number of time steps a tool kit is empty. Each curve is based on the average of 100 simulation runs
Table 4.3 Time steps spent without material in tool kit
| Pr | Random walk |
| 0 | 1550 |
| 0.001 | 1646 |
| 0.01 | 1112 |
| 0.1 | 440 |
| 1 | 104 |
4.4