Historicalevidence
This section examines the historical evidence about the evolution of the relationship between income per capita, population growth, technological change and human capital formation during the course of three distinct regimes that have characterized the process of economic development: The Malthusian Epoch, The Post-Malthusian Regime, and the Sustained Growth Regime.
During the Malthusian Epoch that characterized most of human history, technological progress and population growth were insignificant by modern standards. The level of income per capita had a positive effect on population and the average growth rate of income per capita in the long-run, as depicted in Figure 2, was negligible due to the slow pace of technological progress as well as the counterbalancing effect of population growth on the expansion of resources per capita. During the Post Malthusian Regime, the pace of technological progress markedly increased in association with the process of industrialization, triggering a take-off from the Malthusian trap. The growth rate of income per capita, as depicted in Figures 1 and 2, increased significantly but the positive Malthusian effect of income per capita on population growth was still maintained, generating a sizable increase in population growth that offset some of the potential gains in income per capita. The acceleration in the rate of technological progress in the second phase of industrialization, and its interaction with human capital formation, eventually prompted the demographic transition. The rise in aggregate income was no longer
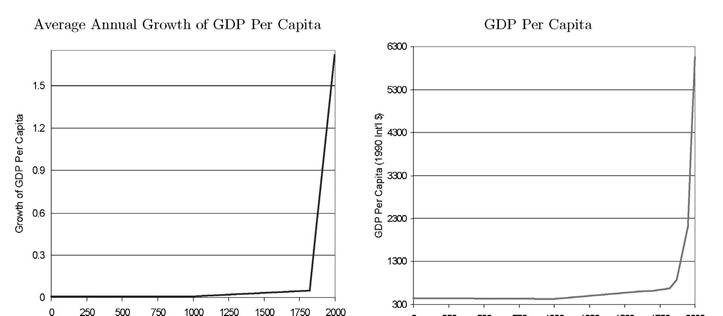
Figure 2. The evolution of the world income per capita over the years 1-2000. Sources: Maddison (2001, 2003).
counterbalanced by population growth, enabling technological progress to bring about sustained increase in income per capita.
2.1. TheMalthusianepoch
During the Malthusian epoch that had characterized most of human history, humans were subjected to persistent struggle for existence. Technological progress was insignificant by modern standards and resources generated by technological progress and land expansion were channeled primarily towards an increase in the size of the population, with a minor long-run effect on income per capita. The positive effect of the standard of living on population growth along with diminishing labor productivity kept income per capita in the proximity of a subsistence level.[79] Periods marked by the absence of changes in the level of technology or in the availability of land, were characterized by a stable population size as well as a constant income per capita, whereas periods characterized by improvements in the technological environment or in the availability of land generated temporary gains in income per capita, leading eventually to a larger but not richer population. Technologically superior countries had eventually denser populations but their standard of living did not reflect the degree of their technological advancement.[80]
2.1.1. Income per capita
During the Malthusian epoch the average growth rate of output per capita was negligible and the standard of living did not differ greatly across countries. As depicted in Figure 2 the average level of income per capita during the first millennium fluctuated around $450 per year, and the average growth rate of output per capita in the world was nearly zero.[81] This state of Malthusian Stagnation persisted until the end of the 18th century. In the years 1000-1820, the average level of income per capita in the world economy was below $670 per year and the average growth rate of the world income per capita was miniscule, creeping at a rate of about 0.05% peryear [Maddison (2001)].
This pattern of stagnation was observed across all regions of the world. As depicted in Figure 1, the average level of income per capita in Western and Eastern Europe, the Western Offshoots, Asia, Africa, and Latin America was in the range of $400-450 per year in the first millennium and the average growth rate in each of these regions was nearly zero.
This state of stagnation persisted until the end of the 18th century across all regions and the level of income per capita in 1820 ranged from $418 per year in Africa, $581 in Asia, $692 in Latin America, and $683 in Eastern Europe, to $1202 in the Western Offshoots (i.e., United States, Canada, Australia and New Zealand), and $1204 in Western Europe. Furthermore, the average growth rate of output per capita over this period ranged from 0% in the impoverished region of Africa to a sluggish rate of 0.14% in the prosperous region of Western Europe.Despite the stability in the evolution of the world income per capita in the Malthusian epoch, from a perspective of a millennium, wages and income per capita fluctuated significantly within regions deviating from their sluggish long-run trend over decades and sometimes over several centuries. In particular, as depicted in Figure 3, real GDP per capita in England fluctuated drastically over most of the past millennium. It declined during the 13th century, and increased sharply during the 14th and 15th centuries in response to the catastrophic population decline in the aftermath of the Black Death. This two-century rise in per capita real income stimulated population growth and brought about a decline in income per capita in the 16th century, back to its level in the first half of the 14th century. Real income per capita increased once again in the 17th century and remained stable during the 18th century, prior to its rise during the take-off in the 19th century.
2.1.2. Income and population growth
Population growth and the level of income Population growth over this era followed the Malthusian pattern as well. As depicted in Figures 4 and 5, the slow pace of resource expansion in the first millennium was reflected in a modest increase in the population of the world from 231 million people in 1 AD to 268 million in 1000 AD; a miniscule
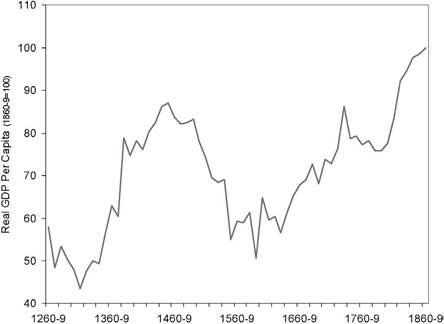
Figure 3.
Fluctuations in real GDP per capita: England, 1260-1870. Source: Clark (2001).
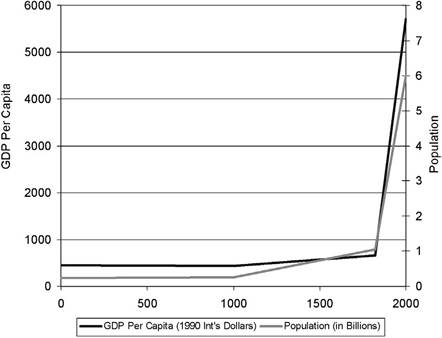
Figure 4. The evolution of world population and income per capita over the years 1-2000. Source: Maddison (2001).
average growth rate of 0.02% per year.[82] The more rapid (but still very slow) expansion of resources in the period 1000-1500, permitted the world population to increase by 63% over this period, from 268 million in 1000 AD to 438 million in 1500; a slow 0.1% average growth rate per year. Resource expansion over the period 1500-1820 had a more significant impact on the world population, which grew 138% from 438 million
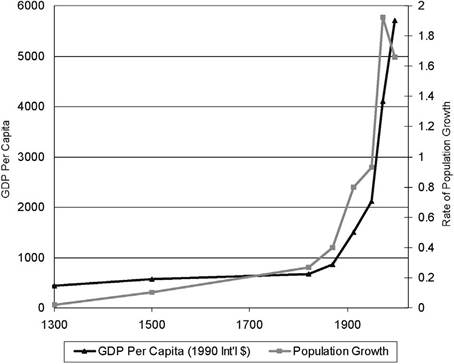
Figure 5. Population growth and income per capita in the world economy. Source: Maddison (2001).
in 1500 to 1041 million in 1820; an average pace of 0.27% per year.[83] This positive effect of income per capita on the size of the population was maintained in the last two centuries as well, as world population reached a remarkable level of nearly 6 billion people.
Moreover, the gradual increase in income per capita during the Malthusian epoch was associated with a monotonic increase in the average rate of growth of world population, as depicted in Figure 5. This pattern was exhibited within and across countries.[84]
Fluctuations in income and population Fluctuations in population and wages over this epoch exhibited the Malthusian pattern as well. Episodes of technological progress, land expansion, favorable climatic conditions, or major epidemics (that resulted in a decline of the adult population), brought about a temporary increase in real wages and income per capita. In particular, as depicted in Figure 6, the catastrophic decline in the population of England during the Black Death (1348-1349), from about 6 million
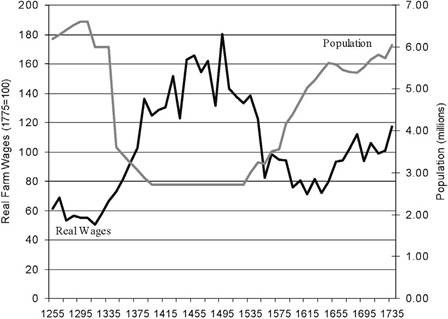
Figure 6.
Populationandrealwages: England, 1250-1750. Sources: Clark (2001, 2002).to about 3.5 million people, increased significantly the land-labor ratio, tripling real wages in the subsequent 150 years. Ultimately, however, most of this increase in real resources per capita was channeled towards increased fertility rates, increasing the size of the population, and bringing the real wage rate in the 1560s back to the proximity of its pre-plague level.[85]
Population density Variations in population density across countries during the Malthusian epoch reflected primarily cross country differences in technologies and land productivity. Due to the positive adjustment of population to an increase in income per capita, differences in technologies or in land productivity across countries resulted in variations in population density rather than in the standard of living.[86] For instance, China’s technological advancement in the period 1500-1820 permitted its share of world population to increase from 23.5% to 36.6%, while its income per capita in the beginning and the end of this time interval remained constant at roughly $600 per year.[87]
This pattern of increased population density persisted until the demographic transition, namely, as long as the positive relationship between income per capita and
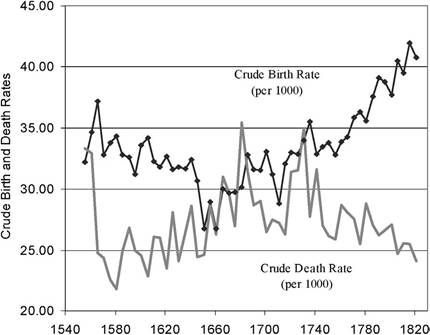
Figure 7. Fertility and mortality: England 1540-1820. Source: Wrigley and Schofield (1981).
population growth was maintained. In the period 1600-1870, United Kingdom’s technological advancement relative to the rest of the world more than doubled its share of Worldpopulationfrom 1.1% to 2.5%. Similarly, in the period 1820-1870, the land abundant, technologically advanced economy of the US experienced a 220% increase in its share of world population from 1% to 3.2%.[88]
Mortality andfertility The Malthusian demographic regime was characterized by fluctuations in fertility rates, reflecting variability in income per capita as well as changes in mortality rates.
The relationship between fertility and mortality during the Malthusian epoch was complex. Periods of rising income per capita permitted a rise in the number of surviving offspring, inducing an increase in fertility rates along with a reduction in mortality rates, due to improved nourishment, and health infrastructure. Periods of rising mortality rates (e.g., the black death) induced an increase in fertility rates so as to maintain the number of surviving offspring that can be supported by existing resources.In particular, demographic patterns in England during the 14th and 15th centuries, as depicted in Figure 6, suggest that an (exogenous) increase in mortality rates was indeed associated with a significant rise in fertility rates. However, the period 15401820 in England, vividly demonstrates a negative relationship between mortality rates and fertility rates. As depicted in Figure 7, an increase in mortality rates over the period 1560-1650 was associated with a decline in fertility rates, whereas the rise in income per capita in the time period 1680-1820 was associated with a decline in mortality rates along with increasing fertility rates.
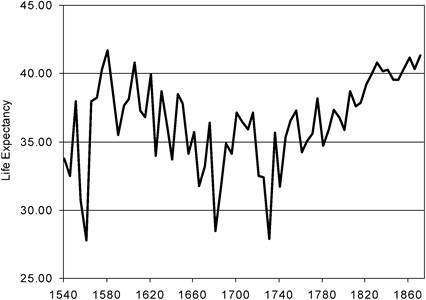
Figure 8. Life expectancy: England, 1540-1870. Source: Wrigley and Schofield (1981).
Life expectancy Life expectancy at birth fluctuated in the Malthusian epoch, ranging from 24 in Egypt in the time period 33-258 AD, to 42 in England at the end of the 16th century. In the initial process of European urbanization, the percentage of urban population increased six-fold from about 3% in 1520 to nearly 18% in 1750 [De Vries (1984) and Bairoch (1988)]. This rapid increase in population density, without significant changes in health infrastructure, generated a rise in mortality rates and a decline in life expectancy. As depicted in Figures 7 and 8, over the period 1580-1740 mortality rates increased by 50% and life expectancy at birth fell from about 40 to nearly 30 years [Wrigley and Schofield (1981)]. A decline in mortality along with a rise in life expectancy began in the 1740s. Life expectancy at birth rose from about 30 to 40 in England and from 25 to 40 in France over the period 1740-1830 [Livi-Bacci (1997)].
2.2. ThePost-MalthusianRegime
During the Post-Malthusian Regime the pace of technological progress markedly increased along the process of industrialization.[89] The growth rate of output per capita increased significantly, as depicted in Figures 1, 2 and 3, but the positive Malthusian effect of income per capita on population growth was still maintained, generating a sizable increase in population growth, as depicted in Figures 4 and 5, and offsetting some of the potential gains in income per capita.
The take-off of developed regions from the Malthusian Regime was associated with the Industrial Revolution and occurred at the beginning of the 19th century, whereas the take-off of less developed regions occurred towards the beginning of the 20th century and was delayed in some countries well into the 20th century. The Post-Malthusian Regime ended with the decline in population growth in Western Europe and the Western Offshoots (i.e. United States, Canada, Australia and New Zealand) towards the end of the 19th century, and in less developed regions in the second half of the 20th century.
2.2.1. Income per capita
During the Post-Malthusian Regime the average growth rate of output per capita increased significantly and the standard of living started to differ considerably across countries. As depicted in Figure 2, the average growth rate of output per capita in the world soared from 0.05% per year in the time period 1500-1820 to 0.53% per year in 1820-1870, and 1.3% peryear in 1870-1913. The timing of the take-off and its magnitude differed across regions. As depicted in Figure 9, the take-off from the Malthusian Epoch and the transition to the Post-Malthusian Regime occurred in Western Europe, the Western Offshoots, and Eastern Europe at the beginning of the 19th century, whereas in Latin America, Asia (excluding China) and Africa it took place at the end of the 19th century.
Among the regions that took off at the beginning of the 19th century, the growth rate of income per capita in Western Europe increased from 0.15% per year in the years 1500-1820 to 0.95% per year in the time period 1820-1870, and the growth rates of income per capita of the Western Offshoots increased over the corresponding time periods from 0.34% per year to 1.42% per year. In contrast, the take-off in Eastern Europe was more modest, and its growth rate increased from 0.1% per year in the period 15001820 to 0.63% per year in the time interval 1820-1870. Among the regions that took off towards the end of the 19th century, the average growth rate of income per capita in Latin Americajumped from a sluggish rate of 0.11% peryear in the years 1820-1870 to a considerable rate of 1.81% per year in the time period 1870-1913, whereas Africa’s growth rates increased more modestly from 0.12% per year in the years 1820-1870 to 0.64% peryear in time interval 1870-1913 and 1.02% per year in the period 1913-1950. Asia’s (excluding Japan, China and India) take-off was modest as well, increasing from 0.13% per year in the years 1820-1870 to 0.64% per year in the 1870-1913 period.[90]
The level of income per capita in the various regions of the world, as depicted in Figure 1, ranged in 1870 from $444 in Africa, $543 in Asia, $698 in Latin America, and $871 in Eastern Europe, to $1974 in Western Europe and $2431 in the Western Offshoots. Thus, the differential timing of the take-off from the Malthusian epoch, increased the gap between the richest region of Western Europe and the Western Offshoots to the impoverished region of Africa from about 3 : 1 in 1820 to approximately 5 : 1 in 1870.
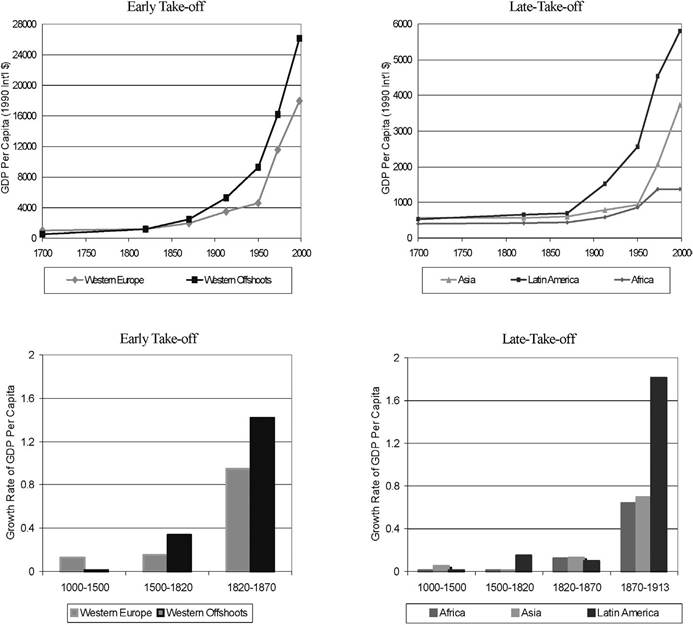
Figure 9. The differential timing of the take-off across regions. Source: Maddison (2001).
The acceleration in technological progress and the accumulation of physical capital and to a lesser extent human capital, generated a gradual rise in real wages in the urban sector and (partly due to labor mobility) in the rural sector as well. As depicted in Figure 10, the take-off from the Malthusian epoch in the aftermath of the Industrial Revolution was associated in England with a modest rise in real wages in the first decades of the 19th century and a very significant rise in real wages after 1870.[91] Avery significant rise in real wages was experienced in France, as well, after 1860.
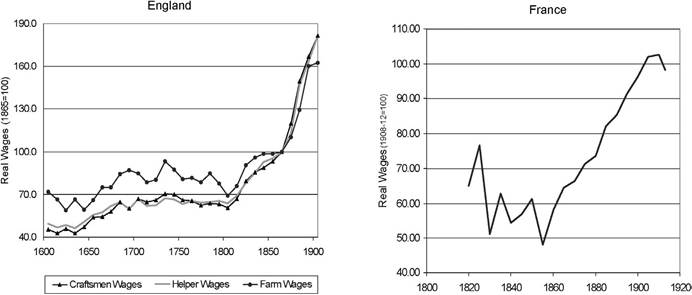
Figure 10. Real wages in England and France during the take-off from the Malthusian Epoch. Sources: Clark (2002) for England, and Levy-Leboyer and Bourguignon (1990) for France.
2.2.2. Income and population growth
The rapid increase in income per capita in the Post-Malthusian Regime was channeled partly towards an increase in the size of the population. During this regime, the Malthusian mechanism linking higher income to higher population growth continued to function, but the effect of higher population on diluting resources per capita, and thus lowering income per capita, was counteracted by the acceleration in technological progress and capital accumulation, allowing income per capita to rise despite the offsetting effects of population growth.
The Western European take-off along with that of the Western Offshoots brought about a sharp increase in population growth in these regions and consequently a modest rise in population growth in the world as a whole. The subsequent take-off of less developed regions and the associated increase in their population growth brought about a significant rise in population growth in the world. The rate of population growth in the world increased from an average rate of 0.27% per year in the period 1500-1820 to 0.4% per year in the years 1820-1870, and to 0.8% per year in the time interval 1870-1913. Furthermore, despite the decline in population growth in Western Europe and the Western Offshoots towards the end of the 19th century and the beginning of the 20th century, the delayed take-off of less developed regions and the significant increase in their income per capita prior to their demographic transitions generated a further increase in the rate of population growth in the world to 0.93% per year in the period 1913-1950, and a sharp rise to a high rate of 1.92% per year in the period 1950-1973. Ultimately, the onset of the demographic transition in less developed economies in the second half of the 20th century, gradually reduced population growth rates to 1.66% per year in the 1973-1998 period [Maddison (2001)].
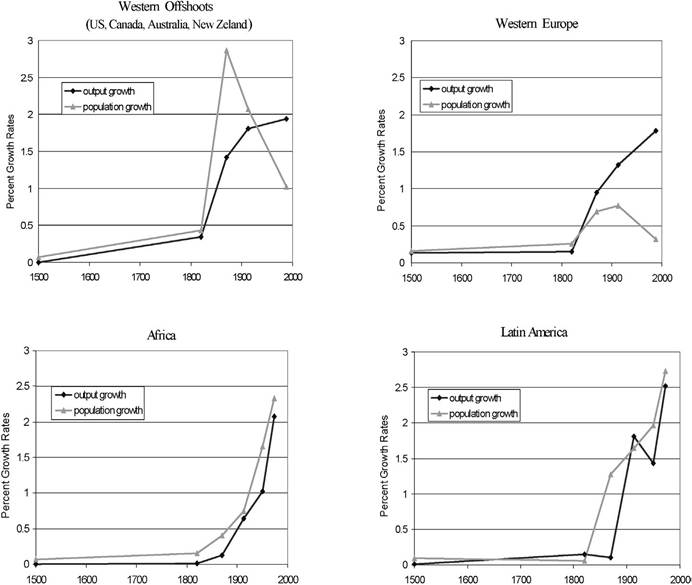
Figure 11. Regional growth of GDP per capita and population: 1500-2000. Source: Maddison (2001).
Growth in income per capita and population growth As depicted in Figure 11, the take-off in the growth rate of income per capita in all regions of the world was associated with a take-off in population growth. In particular, the average growth rates of income per capita in Western Europe over the time period 1820-1870 rose to an annual rate of 0.95% (from 0.15% in the period 1500-1820) along with a significant increase in population growth to an annual rate of about 0.7% (from 0.26% in the period 15001820). Similarly, the average growth rates of income per capita in the Western Offshoots over the years 1820-1870 rose to an annual rate of 1.42% (from 0.34% in the period 1500-1820) along with a significant increase in population growth to an annual rate of about 2.87% (from 0.43% in the period 1500-1820).
A similar pattern was observed in Asia, and as depicted in Figure 11, in Africa and Latin America as well. The average growth rates of income per capita in Latin America over the years 1870-1913 rose to an annual rate of 1.81% (from 0.1% in the period 1820-1870) and subsequently to an annual rate of 1.43% in time interval 1913-1950 and 2.52% in the time period 1950-1973 along with a significant increase in population growth to an annual rate of 1.64% in the period 1870-1913, 1.97% in the years 1913-1950, and 2.73% in the period 1950-1973, prior to the decline in the context of the demographic transition. Similarly, the average growth rates of income per capita in Africa over the 1870-1913 period rose to an annual rate of 0.64% (from 0.12% in the period 1820-1870) and subsequently to an annual rate of 1.02% in the years 1913-1950 and 2.07% in the period 1950-1973, along with a monotonic increase in population growth from a modest average annual rate of 0.4% in the years 1820-1870, to a 0.75% in the years 1870-1913, 1.65% in the years 1913-1950, 2.33% in the time interval 1950-1973, and a rapid average annual rate of 2.73% in the period 1973-1998.
Technological leaders and land-abundant regions during the Post-Malthusian era improved their relative position in the world in terms of their level of income per capita as well as their population size. The increase in population density of technological leaders persisted as long as the positive relationship between income per capita and population growth was maintained. Western Europe’s technological advancement relative to the rest of the world increased its share of world population by 16% from 12.8% in 1820 to 14.8% in 1870, whereas the regional technological leader, the United Kingdom, increased its share of world population by 25% (from 2% to 2.5%) over this fifty-year period. Moreover, land abundance and technological advancement in the Western Offshoots (US, Australia, New Zealand and Canada) increased their share of world population by 227% over a fifty-year period, from 1.1%in 1820 to 3.6%in 1870.
The rate of population growth relative to the growth rate of aggregate income declined gradually over the period. For instance, the growth rate of total output in Western Europe was 0.3% per year between 1500 and 1700, and 0.6% per year between 1700 and 1820. In both periods, two thirds of the increase in total output was matched by increased population growth, and the growth of income per capita was only 0.1% per year in the earlier period and 0.2% in the later one. In the United Kingdom, where growth was the fastest, the same rough division between total output growth and population growth can be observed: total output grew at an annual rate of 1.1% in the 120 years after 1700, while population grew at an annual rate of 0.7%. Population and income per capita continued to grow after 1820, but increasingly the growth of total output was expressed as growth of income per capita. Population growth was 40% as large as total output growth over the time period 1820-1870, dropping further after the demographic transition to about 20% of output growth over the 1929-1990 period.
Fertility and mortality The relaxation in the households’ budget constraint in the Post- Malthusian Regime permitted an increase in fertility rates along with an increase in literacy rates and years of schooling. Despite the decline in mortality rates, fertility rates (as well as population growth) increased in most of Western Europe until the second half of the 19th century [Coale and Treadway (1986)].[92] In particular, as depicted in Figure 12, in spite of a century of decline in mortality rates, the crude birth rates in
21
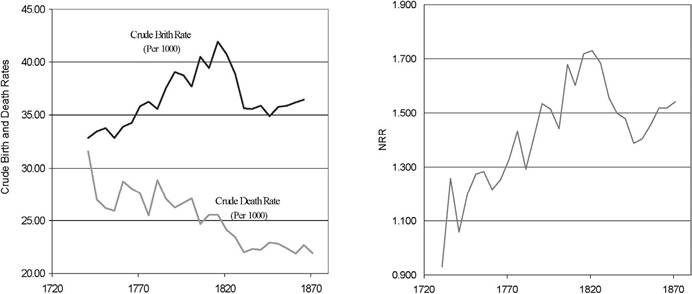
Figure 12. Fertility, mortality and net reproduction rate: England, 1730-1871. Source: Wrigley and Schofield (1981).
England increased over the 18th century and the beginning of the 19th century. Thus, the Net Reproduction Rate (i.e., the number of daughters per woman who reach the reproduction age) increased from about the replacement level of 1 surviving daughter per woman in 1740 to about 1.5 surviving daughters per woman in the eve of the demographic transition in 1870.
It appears that the significant rise in income per capita in the Post-Malthusian Regime increased the desirable number of surviving offspring and thus, despite the decline in mortality rates, fertility increased significantly so as to enable households to reach this higher desirable level of surviving offspring.
Fertility rates and marriage age Fertility was controlled during this period, despite the absence of modern contraceptive methods, partly via adjustment in marriage rates.[93] As depicted in Figure 13, increased fertility was achieved by earlier female’s age of marriage, and a decline in fertility by a delay in the marriage age.[94]
2.2.3. Industrialization and urbanization
The take-off of developed and less developed regions from the Malthusian epoch was associated with the acceleration in the process of industrialization as well as with a significant rise in urbanization.
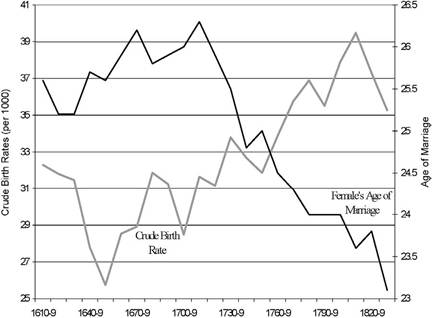
Figure 13. Fertility rates and female's age of marriage. Source: Wrigley and Schofield (1981).
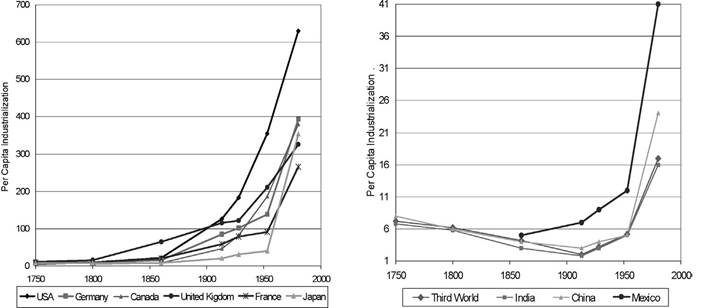
Figure 14. Per capita levels of industrialization: (UK in 1900 = 100). Source: Bairoch (1982).24
Industrialization The take-off in the developed regions was accompanied by a rapid process of industrialization. As depicted in Figure 14, per-capita level of industrialization (measuring per capita volume of industrial production) increased significantly in the United Kingdom since 1750, rising 50% over the 1750-1800 period, quadrupling in the years 1800-1860, and nearly doubling in the time period 1860-1913. Similarly per-capita level of industrialization accelerated in the United States, doubling in the
24 Notes: Countries are defined according to their 1913 boundaries. Germany from 1953 is defined as East and West Germany. India after 1928 includes Pakistan.
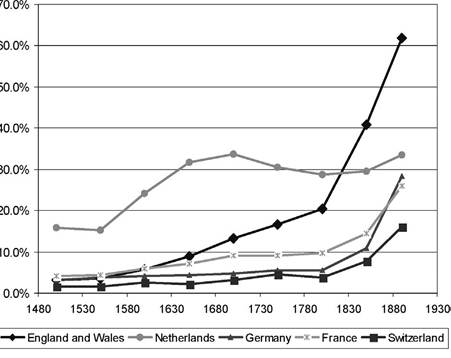
Figure 15. Percentage of the population in cities with population larger than 10,000. Europe: 1490-1910.
Sources: Bairoch (1988) and De Vries (1984).
1750-1800 as well as 1800-1860 periods, and increasing six-fold in the years 18601913. A similar pattern was experienced in Germany, France, Sweden, Switzerland, Belgium, and Canada. Industrialization nearly doubled in the 1800-1860 period, further accelerating in the time interval 1860-1913.
The take-off of less developed economies in the 20th century was associated with increased industrialization as well. However, as depicted in Figure 14, during the 19th century these economies experienced a decline in per capita industrialization (i.e., per capita volume of industrial production), reflecting the adverse effect of the sizable increase in population on the level of industrial production per capita (even in the absence of an absolute decline in industrial production) as well as the forces of globalization and colonialism, that induced less developed economies to specialize in the production of raw materials.[95]
Urbanization The take-off from Malthusian stagnation and the acceleration in the process of industrialization increased significantly the process of urbanization. As reflected in Figure 15, the percentage of the population that lived in European cities with a population larger than 10,000 people nearly tripled over the years 1750-1870, from 17% to 54%. Similarly, the percentage of the population in England that lived in cities with population larger than 5,000 quadrupled over the 1750-1910 period, from 18% to 75% [Bairoch (1988)].
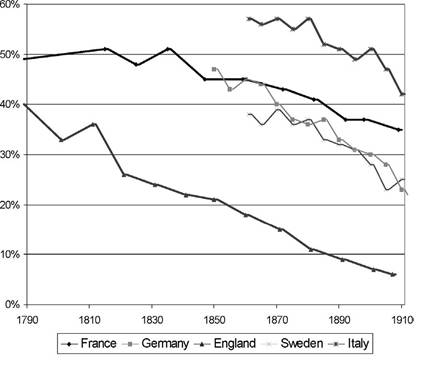
Figure 16. The decline in the percentage of agricultural production in total output: Europe: 1790-1910. Source: Mitchell (1981).
This rapid processes of industrialization and urbanization was accompanied by a rapid decline in the share of agricultural production in total output, as depicted in Figure 16. For instance, this share declined in England from 40% in 1790 to 7% in 1910.
2.2.4. Early stages of human capital formation
The acceleration in technological progress during the Post-Malthusian Regime and the associated increase in income per capita stimulated the accumulation of human capital in the form of literacy rates, schooling, and health. The increase in the investment in human capital was induced by the gradual relaxation in households’ budget constraints (as reflected by the rise in real wages and income per capita), as well as by qualitative changes in the economic environment that increased the demand for human capital and induced households to invest in the education of their offspring.
In the first phase of the Industrial Revolution, human capital had a limited role in the production process. Education was motivated by a variety of reasons, such as religion, enlightenment, social control, moral conformity, sociopolitical stability, social and national cohesion, and military efficiency. The extensiveness of public education was therefore not necessarily correlated with industrial development and it differed across countries due to political, cultural, social, historical and institutional factors. In the second phase of the Industrial Revolution, however, the demand for education increased, reflecting the increasing skill requirements in the process of industrialization.[96]
During the Post-Malthusian Regime, the average number of years of schooling in Englandand Wales rose from 2.3 for the Cohortbornbetween 1801 and 1805, to 5.2 for the cohort born in the years 1852-1856 [Matthews et al. (1982)]. Furthermore, human capital as reflected by the level of health of the labor force increased over this period. In particular, between 1740 and 1840 life expectancy at birth rose from 33 to 40 in England (Figure 8), and from 25 to 40 in France.
The process of industrialization was eventually characterized by a gradual increase in the relative importance of human capital in less developed economies as well. As documented by Barro and Lee (2000) educational attainment increased significantly across all less developed regions in the Post-Malthusian Regime (that ended with the decline in population growth in the 1970s in Latin America and Asia, and was still in motion in Africa at the end of the 20th century). In particular, the average years of schooling increased from 3.5 in 1960 to 4.4 in 1975 in Latin America, from 1.6 in 1960 to 3.4 in 2000 in Sub-Saharan Africa, and from 1.4 in 1960 to 1.9 in 1975 in SouthAsia.
2.3. The Sustained Growth Regime
The acceleration in technological progress and industrialization in the Post-Malthusian Regime and its interaction with the accumulation of human capital brought about a demographic transition, paving the way to a transition to an era of sustained economic growth. In the post demographic-transition period, the rise in aggregate income due to technological progress and factor accumulation has no longer been counterbalanced by population growth, permitting sustained growth in income per capita in regions that have experienced sustained technological progress and factor accumulation.
The transition of the developed regions of Western Europe and the Western Offshoots to the state of sustained economic growth occurred towards the end of the 19th century, whereas the transition of some less developed countries in Asia and Latin America occurred towards the end of the 20th century. Africa, in contrast, is still struggling to make this transition.
2.3.1. Growth of income per capita
During the Sustained Growth Regime the average growth rate of output per capita increased significantly along with the decline in population growth. The acceleration in technological progress and the associated rise in the demand for human capital brought about a demographic transition in Western Europe, Western Offshoots, and in many of the less advanced economies, permitting sustained increase in income per capita.
Income per capita in the last century has advanced at a stable rate of about 2% per year in Western Europe and the Western Offshoots, as depicted in Figure 17. In contrast, some less developed regions experienced sustained growth rates of output per capita only in the last decades. As depicted in Figure 18, the growth rate of output per capita
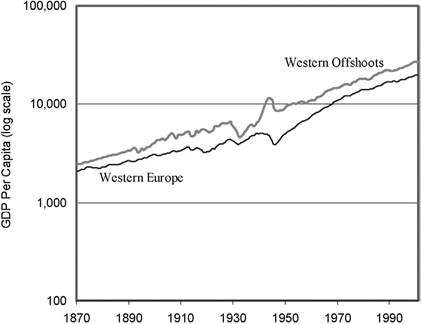
Figure 17. Sustained economic growth: Western Europe and the Western Offshoots, 1870-2001. Source: Maddison (2003).
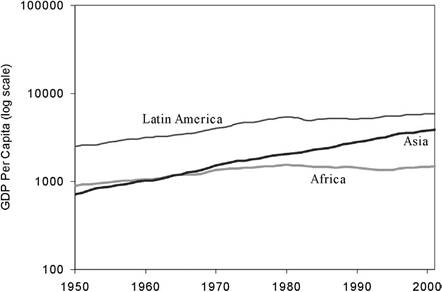
Figure 18. Income per capita in Africa, Asia and Latin America, 1950-2001. Source: Maddison (2003).
in Asia has been stable in the last 50 years, the growth rate in Latin America has been declining over this period, and the growth of Africa vanished in the last few decades.[97]
The transition to a state of sustained economic growth in developed as well as less developed regions was accompanied by a rapid process of industrialization. As depicted in Figure 14, the per capita level of industrialization (measuring per capita volume of industrial production) doubled in the time period 1860-1913 and tripled in the course
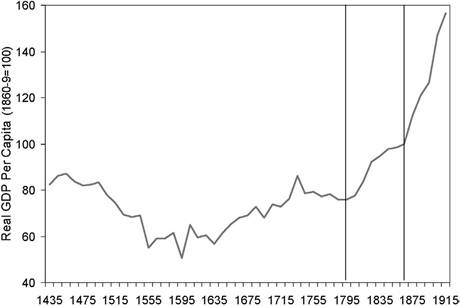
Figure 19. The sharp rise in real GDP per capita in the transition to sustained economic growth: England 1435-1915. Sources: Clark (2001) and Feinstein (1972).
of the 20th century. Similarly, the per capita level of industrialization in the United States, increased six-fold over the years 1860-1913, and tripled along the 20th century. A similar pattern was experienced in Germany, France, Sweden, Switzerland, Belgium, and Canada where industrialization increased significantly in the time interval 18601913 as well as over the rest of the 20th century. Moreover, less developed economies that made the transition to a state of sustained economic growth in recent decades have experienced a significant increase in industrialization.
The transition to a state of sustained economic growth was characterized by a gradual increase in the importance of the accumulation of human capital relative to physical capital as well as with a sharp decline in fertility rates. In the first phase of the Industrial Revolution (1760-1830), capital accumulation as a fraction of GDP increased significantly whereas literacy rates remained largely unchanged. Skills and literacy requirements were minimal, the state devoted virtually no resources to raise the level of literacy of the masses, and workers developed skills primarily through on-the-job training [Green (1990) and Mokyr (1990, 1993)]. Consequently, literacy rates did not increase during the period 1750-1830 [Sanderson (1995)].
In the second phase of the Industrial Revolution, however, the pace of capital accumulation subsided, the education of the labor force markedly increased and skills became necessary for production. The investment ratio which increased from 6% in 1760 to 11.7% in 1831, remained at around 11% on average in the years 1856-1913 [Crafts (1985) and Matthews et al. (1982)]. In contrast, the average years of schooling of male in the labor force, that did not change significantly until the 1830s, tripled by the beginning of the 20th century [Matthews et al. (1982, p. 573)]. The significant rise in the level of income per capita in England as of 1865, as depicted in Figure 19, was associated with an increase in the standard of living [Voth (2004)], and an increase in school enrollment of 10-year olds from 40% in 1870 to 100% in 1900. Moreover, Total Fertility Rates in England sharply declined over this period from about 5 in 1875, to nearly 2 in 1925.
The transition to a state of sustained economic growth in the US, as well, was characterized by a gradual increase in the importance of the accumulation of human capital relative to physical capital. Overthe time period 1890-1999, the contribution of human capital accumulation to the growth process in the US nearly doubled whereas the contribution of physical capital declined significantly. Goldin and Katz (2001) show that the rate of growth of educational productivity was 0.29% per year over the 1890-1915 period, accounting for about 11% of the annual growth rate of output per capita over this period.[98] In the period 1915-1999, the rate of growth of educational productivity was 0.53% per year accounting for about 20% of the annual growth rate of output per capita over this period. Abramovitz and David (2000) report that the fraction of the growth rate of output per capita that is directly attributed to physical capital accumulation declined from an average of 56% in the years 1800-1890 to 31% in the period 1890-1927 and 21% in the time interval 1929-1966.
2.3.2. The demographic transition
The demographic transition swept the world in the course of the last century. The unprecedented increase in population growth during the Post-Malthusian Regime was ultimately reversed and the demographic transition brought about a significant reduction in fertility rates and population growth in various regions of the world, enabling economies to convert a larger share of the fruits of factor accumulation and technological progress into growth of income per capita. The demographic transition enhanced the growth process via three channels: (a) the reduction of the dilution of the stock of capital and land; (b) the enhancement of investment in human capital; (c) the alteration of the age distribution of the population, temporarily increasing the size of the labor force relative to the population as a whole.
The decline in population growth The timing of the demographic transition differed significantly across regions. As depicted in Figure 20, the reduction in population growth occurred in Western Europe, the Western Offshoots, and Eastern Europe towards the end of the 19th century and in the beginning of the 20th century, whereas Latin America and Asia experienced a decline in the rate of population growth only in the last decades of the 20th century. Africa’s population growth, in contrast, has been rising steadily, although this pattern is likely to reverse in the near future due to the decline in fertility rates in this region since the 1980s.
The Western Offshoots experienced the earliest decline in population growth, from an average annual rate of 2.87% in the period 1820-1870 to an annual average rate of
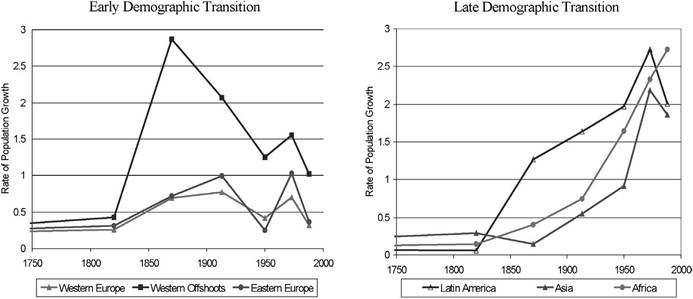
Figure 20. The differential timing of the demographic transition across regions. Source: Maddison (2001).
2.07% in the time interval 1870-1913 and 1.25% in the years 19 13-1950.[99] InWestern Europe population growth declined from a significantly lower average level of 0.77% per year in the period 1870-1913 to an average rate of 0.42% per year in the period 1913-1950. A similar reduction occurred in Eastern Europe as well.[100]
In contrast, in Latin America and Asia the reduction in population growth started to take place in the 1970s, whereas the average population growth in Africa has been rising, despite a modest decline in fertility rates.[101] Latin America experienced a decline in population growth from an average annual rate of 2.73% in the years 1950-1973 to an annual average rate of 2.01% in the period 1973-1998. Similarly, Asia (excluding Japan) experienced a decline in population growth from an average annual rate of 2.21% in the time period 1950-1973 to an average annual rate of 1.86% in the 1973-1998 period. The decline in fertility in these less developed regions, however, has been more significant, indicating a sharp forthcoming decline in population growth during the next decades.
Africa’s increased resources in the Post-Malthusian Regime, however, have been channeled primarily towards population growth. Africa’s population growth rate has increased monotonically from a modest average annual rate of 0.4% over the years 1820-1870, to a 0.75% in the time interval 1870-1913, 1.65% in the period 19131950, 2.33% in 1950-1973, and a rapid average annual rate of 2.73% in the 1973-1998 period. Consequently, the share of the African population in the world increased by 41%
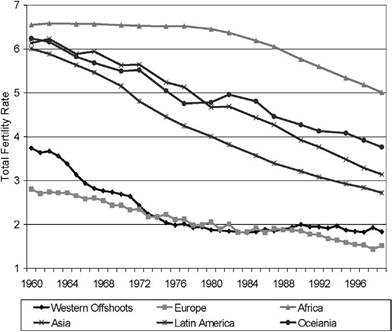
Figure 21. The evolution of Total Fertility Rate across regions, 1960-1999. Source: World Development Indicators (2001).
in the 60-year period 1913-1973 (from 7% in 1913 to 9.9% in 1973), and an additional 30% in the last 25 years, from 9.9% in 1973 to 12.9% in 1998.
Fertility decline The decline in population growth followed the decline in fertility rates. As depicted in Figure 21, Total Fertility Rate over the period 1960-1999 plummeted from 6 to 2.7 in Latin America and declined sharply from 6.14 to 3.14 in Asia.[102] Furthermore, TotalFertilityRate in WesternEurope and the WesternOffshoots declined over this period below the replacement level: from2.8 in 1960 to 1.5 in 1999 in Western Europe and from 3.84 in 1960 to 1.83 in 1999 in the Western Offshoots [World Development Indicators (2001)]. Even in Africa Total Fertility Rate declined moderately from 6.55 in 1960 to 5.0 in 1999.
The demographic transition in Western Europe occurred towards the turn of the 19th century. A sharp reduction in fertility took place simultaneously in several countries in the 1870s, and resulted in a decline of about 1/3 in fertility rates in various states within a 50-year period.[103]
As depicted in Figure 22, Crude Birth Rates in England declined by 44%, from 36 (per 1000) in 1875, to 20 (per 1000) in 1920. Similarly, live births per 1000 women
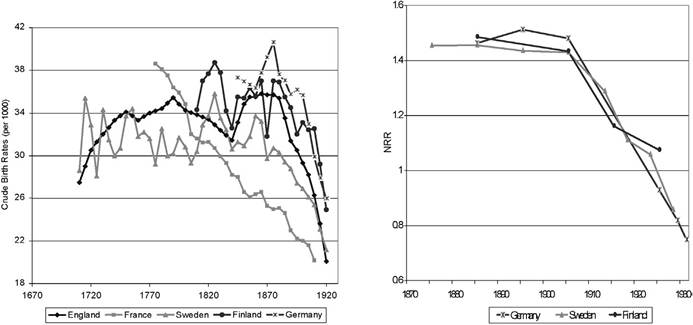
Figure 22. The demographic transition in Western Europe: Crude Birth Rates and Net Reproduction Rates. Sources: Andorka (1978) and Kuzynski (1969).
aged 15-44 fell from 153.6 in 1871-1880 to 109.0 in 1901-1910 [Wrigley (1969)]. In Germany, Crude Birth Rates declined 37%, from 41 (per 1000) in 1875 to 26 (per 1000) in 1920. Sweden’s Crude Birth Rates declined 32%, from 31 (per 1000) in 1875 to 21 (per 1000) in 1920, and in Finland they declined 32%, from 37 (per 1000) in
1875 to 25 (per 1000) in 1920. Finally, although the timing of demographic transition in France represents an anomaly, starting in the second half of the 18th century, France experienced an additional significant reduction in fertility in the time period 1865-1910, and its Crude Birth Rates declined by 26%, from 27 (per 1000) in 1965 to 20 (per 1000) in 1910.
The decline in the crude birth rates in the course of the demographic transition was accompanied by a significant decline in the Net Reproduction Rate (i.e., the number of daughters per woman who reach the reproduction age), as depicted in Figure 22. Namely, the decline in fertility during the demographic transition outpaced the decline in mortality rates, and brought about a decline in the number of children who survived to their reproduction age.
Similar patterns are observed in the evolution of Total Fertility Rates in Western Europe, as depicted in Figure 23. TotalFertilityRates (TFR) peaked in the 1870s and then declined sharply and simultaneously across WesternEuropean States. In England, TFR declined by 51%, from 4.94 children in 1875, to 2.4 in 1920. In Germany, TFR declined 57%, from 5.29 in 1885 to 2.26 in 1920. Sweden’s TFR declined 61%, from 4.51 in
1876 to 1.77 in 1931, in Finland they declined 52%, from 4.96 in 1876 to 2.4 in 1931 and in France, where a major decline occurred in the years 1750-1850, an additional decline took place in the same time period from 3.45 in 1880 to 1.65 in 1920.
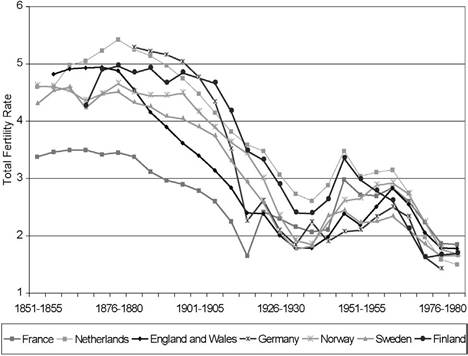
Figure 23. The demographic transition in Western Europe: Total Fertility Rates. Source: Chesnais (1992).
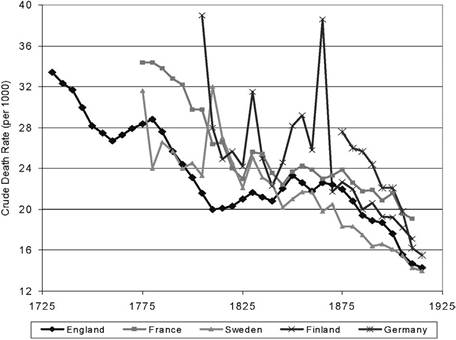
Figure 24. The mortality decline in Western Europe, 1730-1920. Source: Andorka (1978).
Mortality decline The mortality decline preceded the decline in fertility rates in most countries in the world, with the notable exceptions of France and the United States. The decline in mortality rates preceded the decline in fertility rates in Western European countries in the 1730-1920 period, as depicted in Figures 22 and 24. The decline in mortality rates began in England 140 years prior to the decline in fertility, and in Sweden and Finland nearly 100 years prior to the decline in fertility.
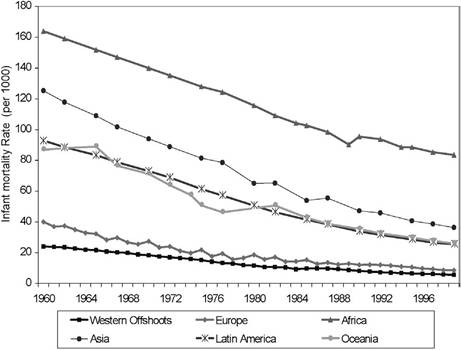
Figure 25. The decline in infant mortality rates across regions, 1960-1999. Source: World Development Indicators (2001).
A similar sequence of events emerges from the pattern of mortality and fertility decline in less developed regions. As depicted in Figures 21 and 25, a sharp decline in infant mortality rates as of 1960 preceded the decline in fertility rates in Africa that took place since the 1980s. Moreover, existing evidence indicates a simultaneous reduction in mortality and fertility in the 1960-2000 period in all other regions.
Life expectancy The decline in mortality rates in developed countries since the 18th century, as depicted in Figure 24, corresponded to a gradual increase in life expectancy, generating a further inducement for investment in human capital. As depicted in Figure 26, life expectancy at birth in England increased at a stable pace from 32 years in the 1720s to about 41 years in the 1870s. This pace of the rise in life expectancy increased towards the end of the 19th century and life expectancy reached the levels of 50 years in 1906, 60 years in 1930 and 77 years in 1996.
Similarly, the significant decline in mortality rates across less developed regions in the past century, corresponded to an increase in life expectancy. As depicted in Figure 27, life expectancy increased significantly in developed regions in the 19th century, whereas the rise in life expectancy in less developed regions occurred throughout the 20th century, stimulating further human capital formation.
In particular, life expectancy nearly tripled in the course of the 20th century in Asia, rising from a level of 24 years in 1900 to 66 years in 1999, reflecting the rise in income per capita as well as the diffusion of medical technology. Similarly, life expectancy in Africa more than doubled from 24 years in 1900 to 52 years in 1999. In contrast, the more rapid advancement in income per capita in Latin America generated an earlier rise in longevity. Life expectancy increased modestly during the 19th century and more
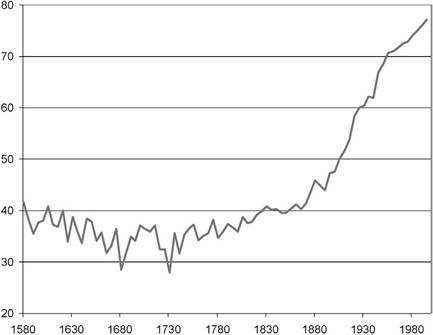
Figure 26. The evolution of life expectancy: England 1580-1996. Sources: Wrigley and Schofield (1981) for 1726-1871 and Human Mortality Database (2003) for 1876-1996.
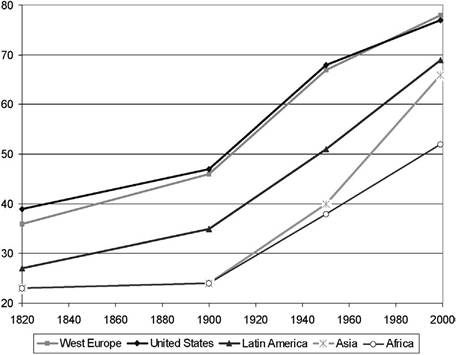
Figure 27. The evolution of life expectancy across regions, 1820-1999. Source: Maddison (2001).
significantly in the course of the 20th century, from 35 years in 1900 to 69 years in 1999.
2.3.3. Industrial development and human capital formation
The process of industrialization was characterized by a gradual increase in the relative importance of human capital in the production process. The acceleration in the rate of technological progress increased gradually the demand for human capital, inducing individuals to invest in education, and stimulating further technological advancement. Moreover, in developed as well as less developed regions, the onset of the process of human capital accumulation preceded the onset of the demographic transition, suggesting that the rise in the demand for human capital in the process of industrialization and the subsequent accumulation of human capital played a significant role in the demographic transition and the transition to a state of sustained economic growth.
Developed economies In the first phase of the Industrial Revolution, the extensiveness of the provision of public education was not correlated with industrial development and it differed across countries due to political, cultural, social, historical and institutional factors. Human capital had a limited role in the production process and education served religious, social, and national goals. In contrast, in the second phase of the Industrial Revolution the demand for skilled labor in the growing industrial sector markedly increased. Human capital formation was designed primarily to satisfy the increasing skill requirements in the process of industrialization, and industrialists became involved in shaping the educational system.
Notably, the reversal of the Malthusian relation between income and population growth during the demographic transition, corresponded to an increase in the level of resources invested in each child. For example, the literacy rate among men, which was stable at around 65% in the first phase of the Industrial Revolution, increased significantly during the second phase, reaching nearly 100% at the end of the 19th century [Clark (2003)]. In addition, the proportion of children aged 5 to 14 in primary schools increased from 11% in 1855 to 74% in 1900. A similar pattern is observed in other European societies [Flora et al. (1983)]. In particular, as depicted in Figure 28, the proportion of children aged 5 to 14 in primary schools in France increased significantly in the second phase of industrialization, rising from 30% in 1832 to 86% in 1901.
Evidence about the evolution of the return to human capital over this period are scarce and controversial. They do not indicate that the skill premium increased markedly in Europe over the course of the 19th century [Clark (2003)]. One can argue that the lack of clear evidence about the increase in the return to human capital over this period is an indication for the absence of a significant increase in the demand for human capital. This partial equilibrium argument, however, is flawed. The return to human capital is affected by the demand and the supply of human capital. Technological progress in the second phase of the Industrial Revolution brought about an increase in the demand for human capital, and indeed, in the absence of a supply response, one would have expected an increase in the return to human capital. However, the significant increase in schooling that took place in the 19th century, and in particular the introduction of public education that lowered the cost of education, generated a significant increase in the supply of educated workers. Some of this supply response was a direct reaction of the increase in the demand for human capital, and thus may only operate to partially offset the increase in the return to human capital. However, the removal of the adverse effect of credit constraints on the acquisition of human capital (as reflected by the introduction
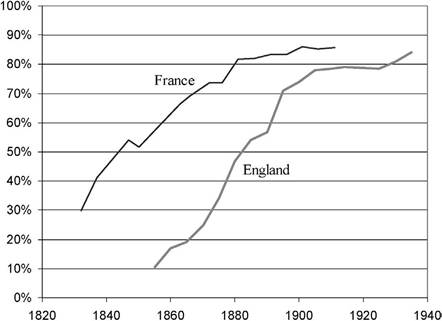
Figure 28. The fraction of children age 5-14 in public primary schools, 1820-1940. Source: Flora et al. (1983).
of public education) generated an additional force that increased the supply of educated labor and operated towards a reduction in the return to human capital.[104]
A. The industrial base for education reforms in the 19th century Education reforms in developed countries in the 18th and 19th centuries provide a profound insight about the significance of industrial development in the formation of human capital (and thus in the onset of the demographic transition) in the second half of the 19th century. In particular, differences in the timing of the establishment of a national system of public education between England and Continental Europe are instrumental in isolating the role of industrial forces in human capital formation from other forces such as social control, moral conformity, enlightenment, sociopolitical stability, social and national cohesion, and military efficiency.
England In the first phase of the Industrial Revolution (1760-1830), capital accumulation increased significantly without a corresponding increase in the supply of skilled labor. The investment ratio increased from 6% in 1760 to 11.7% in 1831 [Crafts (1985, p. 73)]. In contrast, literacy rates remained largely unchanged and the state devoted virtually no resources to raising the level of literacy of the masses. During the first stages of the Industrial Revolution, literacy was largely a cultural skill or a hierarchical symbol and had limited demand in the production process.[105] For instance, in 1841 only 4.9% of male workers and only 2.2% of female workers were in occupations in which literacy was strictly required [Mitch (1992, pp. 14-15)]. During this period, an illiterate labor force could operate the existing technology, and economic growth was not impeded by educational retardation.[106] Workers developed skills primarily through on-the-job training, and child labor was highly valuable.
The development of a national public system of education in England lagged behind other Western European countries by nearly half a century and the literacy rate hardly increased in the period 1750-1830 [Sanderson (1995, pp. 2-10)].[107] As argued by Green (1990, pp. 293-294), “Britain’s early industrialization had occurred without direct state intervention and developed successfully, at least in its early stages, within a laissez-faire framework. Firstly, state intervention was thought unnecessary for developing technical skills, where the initial requirements were slight and adequately met by traditional means. Secondly, the very success of Britain’s early industrial expansion encouraged complacency about the importance of scientific skills and theoretical knowledge which became a liability in a later period when empirical knowledge, inventiveness and thumb methods were no longer adequate.” Furthermore, as argued by Landes (1969, p. 340) “although certain workers - supervisory and office personnel in particular - must be able to read and do the elementary arithmetical operations in order to perform their duties, large share of the work of industry can be performed by illiterates as indeed it was especially in the early days of the industrial revolution”.
England initiated a sequence of reforms in its educational system since the 1830s and literacy rates gradually increased. The process was initially motivated by non-industrial reasons such as religion, social control, moral conformity, enlightenment, and military efficiency, as was the case in other European countries (e.g., Germany, France, Holland, Switzerland) that had supported public education much earlier. However, in light of the modest demand for skills and literacy by the capitalists, the level of governmental support was rather small.[108]
In the second phase of the Industrial Revolution, the demand for skilled labor in the growing industrial sector markedly increased and the proportion of children aged 5 to 14 in primary schools increased from 11% in 1855 to 25% in 1870 [Flora et al. (1983)]. Job advertisements, for instance, suggest that literacy became an increasingly desired characteristic for employment as of the 1850s [Mitch (1993, p. 292)]. In light of the industrial competition from other countries, capitalists started to recognize the importance of technical education for the provision of skilled workers. As noted by Sanderson (1995, pp. 10-13), “reading... enabled the efficient functioning of an urban industrial society laced with letter writing, drawing up wills, apprenticeship indentures, passing bills of exchange, and notice and advertisement reading”. Moreover, manufacturers argued that: “universal education is required in order to select, from the mass of the workers, those who respond well to schooling and would make a good foreman on the shop floor” [Simon (1987, p. 104)].
As it became apparent that skills were necessary for the creation of an industrial society, replacing previous ideas that the acquisition of literacy would make the working classes receptive to radical and subversive ideas, capitalists lobbied for the provision of public education for the masses. The pure laissez-faire policy failed in developing a proper educational system and capitalists demanded government intervention in the provision of education. As James Kitson, a Leeds iron-master and an advocate of technical education explained to the Select Committee on Scientific Instruction (1867-1868): “... the question is so extensive that individual manufacturers are not able to grapple with it, and if they went to immense trouble to establish schools they would be doing it in order that others may reap the benefit” [Green (1990, p. 295)].[109]
An additional turning point in the attitude of capitalists towards public education was the Paris Exhibition of 1867, where the limitations of English scientific and technical education became clearly evident. Unlike the 1851 exhibition in which England won most of the prizes, the English performance in Paris was rather poor; of the 90 classes of manufacturers, Britain dominated only in 10. Lyon Playfair, who was one of the jurors, reported that: “a singular accordance of opinion prevailed that our country has shown little inventiveness and made little progress in the peaceful arts of industry since 1862”. This lack of progress “upon which there was most unanimity conviction is that France, Prussia, Austria, Belgium and Switzerland possess good systems of industrial education and that England possesses none” [Green (1990, p. 296)].
In 1868, the government established the Parliamentary Select Committee on Scientific Education. This was the origin of nearly 20 years of various parliamentary investigations into the relationship between sciences, industry, and education, that were designed to address the capitalists’ outcry about the necessity of universal public education. A sequence of reports by the committee in 1868, the Royal Commission on Scientific Instruction and the Advancement of Science during the period 1872-75, and by the Royal Commission on Technical Education in 1882, underlined the inadequate training for supervisors, managers and proprietors, as well as workers. They argued that most managers and proprietors did not understand the manufacturing process and thus, failed to promote efficiency, investigate innovative techniques, or value the skills of their workers [Green (1990, pp. 297-298)]. In particular, W.E. Forster, the Vice President of the committee of the Council of Education told The House of Commons: “Upon the speedy provision of elementary education depends our industrial prosperity... if we leave our work-folk any longer unskilled... they will become overmatched in the competition of the world” [Hurt (1971, pp. 223-224)]. The reports made various recommendations which highlighted the need to redefine elementary schools, to revise the curriculum throughout the entire school system, particularly with respect to industry and manufacture, and to improve teachers’ training.
In addition, in 1868, secondary schools were investigated by the Schools Inquiry Commission. It found the level of instruction in the vast majority of schools very unsatisfactory, reflecting the employment of untrained teachers and the use of antiquated teaching methods. Their main proposal was to organize a state inspection of secondary schools and to provide efficient education geared towards the specific needs of its consumers. Inparticular, the Royal CommissiononTechnical Educationof 1882 confirmed that England was being overtakenby the industrial superiority of Prussia, France and the United States and recommended the introduction of technical and scientific education into secondary schools.
It appears that the English government gradually yielded to the pressure by capitalists as well as labor unions, and increased its contributions to elementary as well as higher education. In the 1870 Education Act, the government assumed responsibility for ensuring universal elementary education, although it did not provide either free or compulsory education. In 1880, prior to the significant extension of the franchise of 1884 that made the working class the majority in most industrial countries, education was made compulsory throughout England. The 1889 Technical Instruction Act allowed the new local councils to set up technical instruction committees, and the 1890 Local Taxation Act provided public funds that could be spent on technical education [Green (1990, p. 299)].
School enrollment of 10-year olds increased from 40% in 1870 to 100% in 1900, the literacy rate among men, which was stable at around 65% in the first phase of the Industrial Revolution, increased significantly during the second phase, reaching nearly 100% at the end of the 19th century [Clark (2002)], and the proportion of children aged 5 to 14 in primary schools increased in the second half of the 19th century, from 11% in 1855 to 74% in 1900 [Flora et al. (1983)]. Finally, the 1902 Balfour Act marked the consolidation of a national education system. It created state secondary schools [Ringer (1979) and Green (1990, p. 6)] and science and engineering as well as their application to technology gained prominence [Mokyr (1990, 2002)].
Continental Europe The early development of public education occurred in the western countries of continental Europe (e.g., Prussia, France, Sweden, and the Netherlands) well before the Industrial Revolution. The provision of public education at this early stage was motivated by several goals such as social and national cohesion, military efficiency, enlightenment, moral conformity, sociopolitical stability as well as religious reasons. However, as was the case in England, massive educational reforms occurred in the second half of the 19th century due to the rising demand for skills in the process of industrialization. As noted by Green (1990, pp. 293-294) “In continental Europe industrialization occurred under the tutelage of the state and began its accelerated development later when techniques were already becoming more scientific; technical and scientific education had been vigorously promoted from the center as an essential adjunct of economic growth and one that was recognized to be indispensable for countries which wished to close Britain’s industrial lead.”
In France the initial development of the education system occurred well before the Industrial Revolution, but the process was intensified and transformed to satisfy industrial needs in the second phase of the Industrial Revolution. The early development of elementary and secondary education in the 17th and 18th centuries was dominated by the Church and religious orders. Some state intervention in technical and vocational training was designed to reinforce development in commerce, manufacturing and military efficiency. After the French Revolution, the state established universal primary schools. Nevertheless, enrollment rates remained rather low. The state concentrated on the development of secondary and higher education with the objective of producing an effective elite to operate the military and governmental apparatus. Secondary education remained highly selective, offering general and technical instruction largely to the middle class [Green (1990, pp. 135-137 and 141-142)]. Legislative proposals during the National Convention quoted by Cubberley (1920, pp. 514-517) are revealing about the underlying motives for education in this period: Children of all classes were
to receive education, physical, moral and intellectual, best adapted to develop in them republican manners, patriotism, and the love of labor... They are to be taken into the fields and workshops where they may see agricultural and mechanical operations going on.. Ă
The process of industrialization in France, the associated increase in the demand for skilled labor, and the breakdown of the traditional apprenticeship system, significantly affected the attitude towards education. State grants for primary schools gradually increased in the 1830s and legislation made an attempt to provide primary education in all regions, extend the higher education, and provide teacher training and school inspections. The number of communities without schools fell by 50% from 1837 to 1850 and as the influence of industrialists on the structure of education intensified, education became more stratified according to occupational patterns [Anderson (1975, pp. 15, 31)]. According to Green (1990, p. 157): “[This] legislation... reflected the economic development of the period and thus the increasing need for skilled labor.” The eagerness of capitalists for rapid education reforms was reflected by the organization of industrial societies that financed schools specializing in chemistry, design, mechanical weaving, spinning, and commerce [Anderson (1975, pp. 86, 204)].
As was the case in England, industrial competition led industrialists to lobby for the provision of public education. The Great Exhibition of 1851 and the London Exhibition of 1862 created the impression that the technological gap between France and other European nations was narrowing and that French manufacturers ought to invest in the education of their labor force to maintain their technological superiority. Subsequently, reports on the state of the industrial education by commissions established in the years 1862 to 1865 reflected the plea of industrialists for the provision of industrial education on a large scale and for the implementation of scientific knowledge in the industry. “The goal of modern education... can no longer be to form men of letters, idle admirers of the past, but men of science, builders of the present, initiators of the future.”[110]
Education reforms in France were extensive in the second phase of the Industrial Revolution, and by 1881 a universal, free, compulsory and secular primary school system had been established and technical and scientific education further emphasized. Illiteracy rates among conscripts tested at the age of 20 declined gradually from 38% in 1851-55 to 17% in 1876-80 [Anderson (1975, p. 158)], and the proportion of children aged 5 to 14 in primary schools increased from 51.5% in 1850 to 86% in 1901 [Flora et al. (1983)]. Hence, the process of industrialization, and the increase in the demand for skilled labor in the production process, led industrialists to support the provision of universal education, contributing to the extensiveness of education as well as to its focus on industrial needs.
In Prussia, as well, the initial steps towards compulsory education took place at the beginning of the 18th century well before the Industrial Revolution. Education was viewed primarily as a method to unify the state. In the second part of the 18th century, education was made compulsory for all children aged 5 to 13. Nevertheless, these regulations were not strictly enforced partly due to the lack of funding (in light of the difficulty of taxing landlords for this purpose), and partly due to their adverse effect on child labor income. At the beginning of the 19th century, motivated by the need for national cohesion, military efficiency, and trained bureaucrats, the education system was further reformed. Provincial and district school boards were established, education was compulsory (and secular) for a three-year period, and the Gymnasium was reconstituting as a state institution that provided nine years of education for the elite [Cubberly (1920) and Green (1990)].
The process of industrialization in Prussia and the associated increase in the demand for skilled labor led to significant pressure for educational reforms and thereby to the implementation of universal elementary schooling. Taxes were imposed to finance the school system and teacher’s training was established. Secondary schools started to serve industrial needs as well, the Realschulen, which emphasized the teaching of mathematics and science, was gradually adopted, and vocational and trade schools were founded. Total enrollment in secondary school increased six fold from 1870 to 1911 [Flora et al. (1983)]. “School courses... had the function of converting the occupational requirements of public administration, commerce and industry into educational qualifications...,, [Muller (1987, pp. 23-24)]. Furthermore, the Industrial Revolution significantly affected the nature of education in German universities. German industrialists who perceived advanced technology as the competitive edge that could boost German industry, lobbied for reforms in the operation of universities, and offered to pay to reshape their activities so as to favor their interest in technological training and industrial applications of basic research [McClelland (1980, pp. 300-301)].
The structure of education in the Netherlands also reflected the interest of capitalists in the skill formation of the masses. In particular, as early as the 1830s, industrial schools were established and funded by private organizations, representing industrialists and entrepreneurs. Ultimately, in the latter part of the 19th century, the state, urged by industrialists and entrepreneurs, started to support these schools [Wolthuis (1999, pp. 92-93, 119, 139-140, 168, 171-172)].
United States The process of industrialization in the US also increased the importance of human capital in the production process. Evidence provided by Abramovitz and David (2000) and GoldinandKatz (2001) suggests that over the period 1890-1999, the contribution of human capital accumulation to the growth process of the United States nearly doubled.[111] As argued by Goldin (2001), the rise of the industrial, business and commerce sectors in the late 19th and early 20th centuries increased the demand for managers, clerical workers, and educated sales personnel who were trained in accounting, typing, shorthand, algebra, and commerce. Furthermore, in the late 1910s, technologically advanced industries demanded blue-collar craft workers who were trained in geometry, algebra, chemistry, mechanical drawing, etc. The structure of education was transformed in response to industrial development and the increasing importance of human capital in the production process, and American high schools adapted to the needs of the modern workplace of the early 20th century. Total enrollment in public secondary schools increased 70-fold from 1870 to 1950 [Kurian (1994)].[112]
B. Human capital formation and inequality In the first phase of the Industrial Revolution, prior to the implementation of significant education reforms, physical capital accumulation was the prime engine of economic growth. In the absence of significant human capital formation, the concentration of capital among the capitalists widened wealth inequality. Once education reforms were implemented, however, the significant increase in the return to labor relative to capital, as well as the significant increase in the
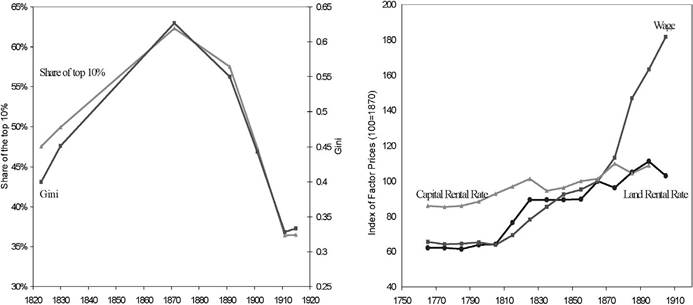
Figure 29. Wealth inequality and factor prices: England 1820-1920. Sources: Williamson (1985) for inequality and Clark (2002, 2003) for factor prices.
real return to labor and the associated accumulation of assets by the workers, brought about a decline in inequality.
Evidence suggests that in the first phase of the Industrial Revolution, prior to the implementation of education reforms, capital accumulation brought about a gradual increase in wages along with an increase in the wage-rental ratio. Education reforms in the second phase of the Industrial Revolution were associated with a sharp increase in real wages along with a sharp increase in the wage-rental ratio.[113] Finally, wealth inequality widened in the first phase of the Industrial Revolution and reversed its course in the second phase, once significant education reforms were implemented.
As documented in Figure 29, based on a controversial study, over the time period 1823-1915, wealth inequality in the UK peaked around 1870 and declined thereafter, in close association with the patterns of enrollment rates and factor prices, depicted in Figures 28 and 29.[114] It appears that the decline in inequality was associated with the significant changes that occurred around 1870 in the relative returns to the main factors of production possessed by capitalists and workers. These changes in factor prices reflect the increase in enrollment rates and its delayed effect on the skill level per worker.
Similar patterns of the effect of education on factor prices and, therefore, on inequality are observed in France as well. As argued by Morrisson and Snyder (2000), wealth inequality in France increased during the first half of the 19th century, and started to decline in the last decades of the 19th century in close association with the rise in education rates depicted in Figure 28, the rise in real wages depicted in Figure 10, and a declining trend of the return to capital over the 19th century. The decline in inequality in France appears to be associated with the significant changes in the relative returns to the main factors of production possessed by capitalists and workers in the second part of the 19th century. As depicted in Figure 10, based on the data presented in Levy-Leboyer and Bourguignon (1990), real wages, as well as the wage-rental ratio, increased significantly as of 1860, reflecting the rise in the demand for skilled labor and the effect of the increase in enrollment rates on the skill level per worker.
The German experience is consistent with this pattern as well. Inequality in Germany peaked towards the end of the 19th century [Morrisson and Snyder (2000)] in association with a significant increase in the real wages and in the wage-rental ratio from the 1880s [Spree (1977) and Berghahn (1994)], which is in turn related to the provision of industrial education in the second half of the 19th century.
The link between the expansion of education and the reduction in inequality is present in the US as well. Wealth inequality in the US, which increased gradually from colonial times until the second half of the 19th century, reversed its course at the turn of the century and maintained its declining pattern during the first half of the 20th century [Lindert and Williamson (1976)]. As argued by Goldin (2001), the emergence of the “new economy” in the early 20th century increased the demand for educated workers. Thecreationofpubliclyfundedmassmodernsecondary schools from 1910to 1940 provided general and practical education, contributed to workers productivity, and opened the gates for college education. This expansion facilitated social and geographic mobility and generated a large decrease in inequality in economic outcomes.
C. Independence of education reforms from political reforms in the 19th century The 19th century was marked by significant political reforms along with the described education reforms. One could therefore challenge the significance of the industrial motive for education reform, suggesting that political reforms during the 19th century shifted the balance of power towards the working class and enabled workers to implement education reforms against the interest of the industrial elite. However, political reforms that took place in the 19th century had no apparent effect on education reforms over this period, strengthening the hypothesis that indeed industrial development, and the increasing demand for human capital, were the trigger for human capital formation and the demographic transition. Education reforms took place in autocratic states that did not relinquish political power throughout the 19th century, and major reforms occurred in societies in the midst of the process of democratization well before the stage at which the working class constituted the majority among the voters.
In particular, the most significant education reforms in the UK were completed before the voting majority shifted to the working class. The patterns of education and political reforms in the UK during the 19th century are depicted in Figure 30. The Reform Act of 1832 nearly doubled the total electorate, but nevertheless only 13% of the votingage population were enfranchised. Artisans, the working class, and some sections of the lower middle class remained outside of the political system. The franchise was extended further in the Reform Acts of 1867 and 1884 and the total electorate nearly doubled in
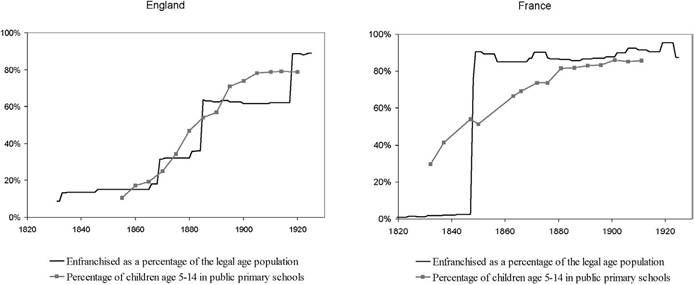
Figure 30. The evolution of voting rights and school enrollment. Source: Flora et al. (1983).
each of these episodes. However, working-class voters did not become the majority in all urban counties until 1884 [Craig (1989)].
The onset of England’s education reforms, and in particular, the fundamental Education Act of 1870 and its major extension in 1880 occurred prior to the political reforms of 1884 that made the working class the majority in most counties. As depicted in Figure 30, a trend of significant increase in primary education was established well before the extension of the franchise in the context of the 1867 and 1884 Reform Acts. In particular, the proportion of children aged 5 to 14 in primary schools increased five-fold (and surpassed 50%) over the three decades prior to the qualitative extension of the franchise in 1884 in which the working class was granted a majority in all urban counties. Furthermore, the political reforms do not appear to have any effect on the pattern of education reform. In fact, the average growth rate of education attendance from decade to decade over the period 1855 to 1920 reaches a peak at around the Reform Act of 1884 and starts declining thereafter. It is interesting to note, however, that the abolishment of education fees in nearly all elementary schools occurs only in 1891, after the Reform Act of 1884, suggesting that the political power of the working class may have affected the distribution of education costs across the population, but the decision to educate the masses was taken independently of the political power of the working class.
In France, as well, the expanding pattern of education preceded the major political reform that gave the voting majority to the working class. The patterns of education and political reforms in France during the 19th century are depicted in Figure 30. Prior to 1848, restrictions limited the electorate to less than 2.5% of the voting-age population. The 1848 revolution led to the introduction of nearly universal voting rights for males. Nevertheless, the proportion of children aged 5 to 14 in primary schools doubled (and exceeded 50%) over the two decades prior to the qualitative extension of the franchise in 1848 in which the working class was granted a majority among voters. Furthermore, the political reforms of 1848 do not appear to have any effect on the pattern of education expansion.
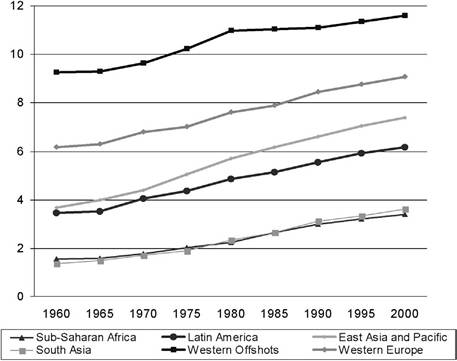
Figure 31. The evolution of average years of education: 1960-2000. Source: Barro and Lee (2000).
A similar pattern occurs in other European countries. Political reforms in the Netherlands did not affect the trend of education expansion and the proportion of children aged 5 to 14 in primary schools exceeded 60% well before the major political reforms of 1887 and 1897. Similarly, the trends of political and education reforms in Sweden, Italy, Norway, Prussia and Russia do not lend credence to the alternative hypothesis.
Less developed economies The process of industrialization was characterized by a gradual increase in the relative importance of human capital in less developed economies as well. As depicted in Figure 31, educational attainment increased significantly across all less developed regions. Moreover, in line with the pattern that emerged among developed economies in the 19th century, the increase in educational attainment preceded or occurred simultaneously with the decline in total fertility rates. In particular, the average years of schooling in Africa increased by 44% (from 1.56 to 2.44) prior to the onset of decline in total fertility rates in 1980, as depicted in Figure 23.
2.3.4. International trade and industrialization
The process of industrialization in developed economies was enhanced by the expansion of international trade. During the 19th century, North-South trade, as well as NorthNorth trade, expanded significantly due to a rapid industrialization in Northwest Europe as well as the reduction of trade barriers and transportation costs and the benefits of the gold standard. The ratio of world trade to output was about 2% in 1800, but then it rose to 10% in 1870, to 17% in 1900 and 21% in 1913 [Estevadeordal, Frantz and Taylor (2002)]. While much of this trade occurred between industrial economies a significant proportion was between industrial and non-industrial economies. As shown in
Table 1
Regional shares of world trade in manufactures. Source: Yates (1959).
| 1876-1880 | 1896-1900 | 1913 | ||||
| Exports | Imports | Exports | Imports | Exports | Imports | |
| UK and Ireland | 37.8% | 9.1% | 31.5% | 10.4% | 25.3% | 8.2% |
| Northwest Europe | 47.1% | 18.1% | 45.8% | 20.3% | 47.9% | 24.4% |
| Other Europe | 9.2% | 13.3% | 10.3% | 12.2% | 8.3% | 15.4% |
| U.S. and Canada | 4.4% | 7.7% | 7.4% | 9.6% | 10.6% | 12.1% |
| Rest of the World | 1.5% | 51.8% | 5.0% | 47.5% | 7.9% | 39.9% |
Table 1, before 1900 nearly 50% of manufactured exports were to non-European and non-North American economies. By the end of 19th century a clear pattern of specialization emerged. The UK and Northwest Europe were net importers of primary products and net exporters of manufactured goods, whereas the exports of Asia, Oceania, Latin America and Africa were overwhelmingly composed of primary products [Findlay and O’Rourke (2003)].
Atlantic trade as well as trade with Asia, in an era of colonialism, had a major effect on European growth starting in the late 16th century [Pomeranz (2000)]. In addition, later expansion of international trade contributed further to the process of industrialization in the UK and Europe [O’Rourke and Williamson (1999)]. For the UK, the proportion of foreign trade to national income grew from about 10% in the 1780s to about 26% over the years 1837-45, and 51.5% in the time period 1909-13 [Kuznets (1967)]. Other European economies experienced a similar pattern as well. The proportion of foreign trade to national income on the eve of World War I was 53.7% in France, 38.3% in Germany, 33.8% in Italy, and 40.4% in Sweden [Kuznets (1967, Table 4)]. Furthermore, export was critical for the viability of some industries, especially the cotton industry, where 70% of the UK output was exported in the 1870s. The quantitative study of Stokey (2001) suggests that trade was instrumental for the increased share of manufacturing in total output in the UK, as well as for the significant rise in real wages, and the empirical examination of O’Rourke and Williamson (2005) demonstrates that trade was a significant force behind the rise in productivity in the UK. Thus while it appears that technological advances could have spawned the Industrial Revolution without an expansion of international trade, the growth in exports increased the pace of industrialization and the growth rate of output per capita.[115]
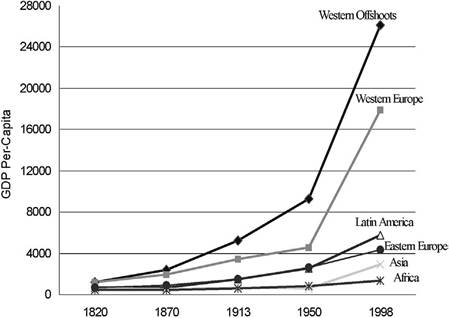
Figure 32. The great divergence. Source: Maddison (2001).
2.4. The great divergence
The differential timing of the take-off from stagnation to growth across countries, and the corresponding variations in the timing of the demographic transition, led to a great divergence in income per capita as well as population growth.
The last two centuries have witnessed dramatic changes in the distribution of income and population across the globe. Some regions have excelled in the growth of income per capita, while other regions have been dominant in population growth. Inequality in the world economy was negligible till the 19th century. The ratio of GDP per capita between the richest region and the poorest region in the world was only 1.1 : 1 in 1000, 2 : 1 in 1500 and 3 : 1 in 1820. As depicted in Figure 32, there has been a ‘Great Divergence’ in income per capita among countries and regions in the past two centuries. In particular, the ratio of GDP per capita between the richest group (Western Offshoots) and the poorest region (Africa) has widened considerably from a modest 3 : 1 ratio in 1820, to 5 : 1 ratio in 1870, 9 : 1 ratio in 1913, 15 : 1 in 1950, and 18 : 1 ratio in 2001.
An equally momentous transformation occurred in the distribution of world population across regions, as depicted in Figure 33. The earlier take-off of Western European countries increased the amount of resources that could be devoted for the increase in family size, permitting a 16% increase in the share of their population in the world economy within a 50 year period (from 12.8% in 1820 to 14.8% in 1870). However, the early onset in the Western European demographic transition and the long delay in the demographic transition of less developed regions, well into the 2nd half of the 20th century, led to a 55% decline in the share of Western European population in the world, from 14.8% in 1870 to 6.6% in 1998. In contrast, the prolongation of the Post-Malthusian period among less developed regions, in association with the delay in their demographic transition well into the second half of 20th century, channeled their increased resources towards a significant increase in their population. Africa’s share
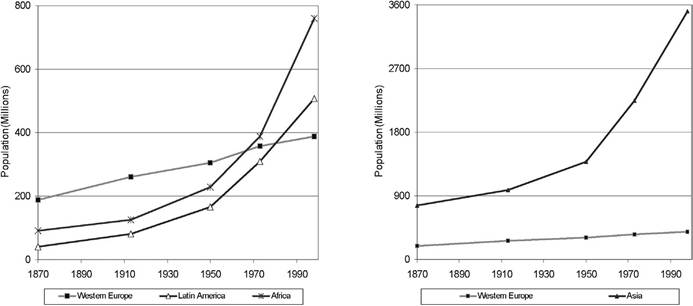
Figure 33. Divergence in regional populations. Source: Maddison (2001).
of world population increased 84%, from 7% in 1913 to 12.9% in 1998, Asia’s share of world population increased 11% from 51.7% in 1913 to 57.4% in 1998, and Latin American countries increased their share in world population from 2% in 1820 to 8.6% in 1998.
Thus, while the ratio of income per capita in Western Europe to that in Asia has tripled in the last two centuries, the ratio of Asian to European population has doubled.[116]
The divergence that has been witnessed in the last two centuries has been maintained across countries in the last decades as well [e.g., Jones (1997) and Pritchett (1997)]. Interestingly, however, Sala-i-Martin (2002) shows that divergence has not been observed in recent decades across people in the world (i.e., when national boundaries are removed).
3.
More on the topic Historicalevidence:
- Law and the state in ‘Near Eastern' legal culture
- Limitations of conventional historiography
- Conclusion
- VII WAS AL-SHAFICI THE MASTER ARCHITECT OF ISLAMIC JURISPRUDENCE?