Sustainable social contracts
2.1. Dynamics and steady states
The joint evolution of inequality and policy is described by the recursive dynamical system

[1] A similar form of nonmonotonicity (U-shape, or even declining throughout for λ high enough) is obtained with a Pareto distribution by Lee and Roemer (1998).
where T(∆t) is given by Proposition 3 and D(∆t, τt) by (11). Under a time-invariant policy, in particular, long-run inequality decreases with redistribution

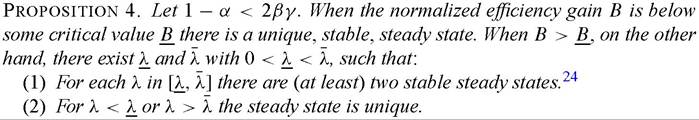
A steady-state equilibrium is an intersection of this downward-sloping locus, ∆ = D(τ), with the U-shaped curve τ = T(∆), as illustrated in Figure 2. The following key proposition identifies the conditions under which multiple intersections occur.
These results can shed light on a number of important issues and puzzles raised in the introduction.
First, they explain how countries with similar economic and political fundamentals can nonetheless sustain very different redistributive institutions, such as a European- style welfare state and a US-style laissez-faire social contract. Notably, these two societies cannot be Pareto ranked. Recall also that τt can be equally interpreted as describing tax-and-transfer policy, labor market regulation, or (with some minor changes) education finance policy. Moreover, it is clear that the model’s key mechanism makes these multiple dimensions of policy complementary, so that they will tend to covary positively across countries, as indeed they do empirically.
A more egalitarian education system, for instance, tends to reduce income inequality, which in turn increases political support for fiscal redistribution or labor-earnings compression - and vice versa. Summarizing a large collective research project on Sweden, Freeman (1995) emphasizes the presence of such complementarities, describing “a highly interrelated welfare state and economy in which many parts fit together (be they subsidies, taxes, wage compression etc.)”.Second, the two conditions required for multiplicity embody very general intuitions that are easily understood in the context of Figure 2. To start with, the ex-ante welfare benefits of redistribution must be high enough, relative to the costs.[391] [392] Otherwise the T curve will be upward-sloping except over a very narrow initial range, and consequently have a unique intersection with the D curve; economically speaking, we would be close to the standard, complete-markets case. in addition, the political power of the wealthy must lie in some intermediate range, otherwise the T curve will lie too high or too low relative to the D curve, and again there will be a unique intersection, with high inequality and low redistribution, or vice-versa.
Third, while in the short-run the relationship is nonmonotonic, there emerges in the long-run a negative correlation between inequality and redistribution, as indeed one observes between the United States and Europe, or among advanced countries in general [Pineda and Rodriguez (2000)].
Fourth, history matters in an important and plausible way: temporary shocks to the distribution of wealth (immigration, educational discrimination, demand shifts) as well as to the political system (slavery, voting rights restrictions) can permanently move society from one equilibrium to the other, or more generally have long-lasting effects on inequality, growth, and institutions. In particular, the model provides a formalization of Engerman and Sokoloff’s (1997) thesis about the historical origins of South and North America’s very different development paths, which they trace back to the former set of New World colonies having had much higher initial inequality (∆0) and a much more concentrated power structure (λ0) than the latter.[393]
Finally, the model also shows that different sources of inequality have different effects on redistributive institutions - which, in particular, sheds doubt on the possibility of empirically estimating a catch-all relationship between inequality and redistribution, or inequality and growth. Indeed, one can show (provided 1 ∕η is not too large) that the threshold for multiplicity B is a decreasing function of the variance ratio v2∕w2, with limv∕w→0(B ) = +∞ and limv∕w→+∞(B ) = 0.
Quite intuitively, income uncertainty interacts with the incompleteness in insurance and credit markets in generating ex-ante efficiency gains from redistribution, as reflected by the term Bv2 in (17). By contrast, a greater variance w2 of the endowments that agents receive prior to choosing policy increases the distributional conflict between identifiable losers and gainers from the policy. Thus, whereas an increase in the variability of sectoral shocks (similar to v2) will lead to an expansion of the welfare state, a surge in immigration that results in a greater heterogeneity of the population (similar to a rise in w2) can easily lead to cutbacks, or even a large-scale dismantling. We shall observe similar effects when studying the political implications of skill-biased technical change.2.2. Which societies grow faster?
As mentioned earlier, the steady states corresponding to different social contracts are not Pareto-rankable: rich enough agents always prefer a more laissez-faire society, while those who are poor enough always want more of a welfare state. One may still ask, however, how these two social models compare in terms of aggregate growth. This question is important first for its policy content, and second to know whether one should expect any empirical relationship between inequality and growth, when account is taken of the fact that both are endogenous. The answer hinges on the basic trade-off, discussed earlier, between the distortions induced by redistribution and its beneficial effect on credit-constraints (magnified, in the long run, by the fact that it also reduces income inequality γ∆∞). This is made clear by the following results, which apply equally in the short and in the long run.[394]
Proposition 5. Compared to a more laissez-faire alternative τ', a more redistributive social contract τ > τ' is associated with lower inequality, and
(1) has higher growth when tax distortions are small (1∕η ≈ 0) relative to those induced by credit constraints on the accumulation of human capital (βγ < 1);
(2) has lower growth when tax distortions are high (1∕η > 0) and the creditconstraint effect is weak (βγ ≈ 1).
The first scenario, of “growth-enhancing redistributions'”, seems most relevant for developing countries, where capital markets are less well functioning, and for redistribution through public investments in human capital and health. one may contrast here the paths followed by East Asia and Latin America in those respects. The result may also help understand why regression estimates of the effects of social and educational transfers on growth are often significantly positive, or at least rarely significantly negative.
The second, “Eurosclerosis”” scenario can account for why Europeans consistently choose more social insurance than Americans - at the cost of higher unemployment and slower growth - even though they are not necessarily more risk-averse. The intuition is that, in more homogeneous societies, there is less erosion of the consensus over social insurance mechanisms which, ex-ante, would be valued enough to compensate for lesser growth prospects.[395]
Putting the two cases together, finally, Proposition 5 can also be related to the empirical findings of Barro (2000) that inequality tends to be negatively associated with subsequent growth in poor countries, but positively associated with it in richer ones. To the extent that poor countries are also those where credit markets are least developed, Proposition 5 predicts that inequality-reducing policies will give rise to just such a dichotomy.
2.