Introduction
The distribution of human capital and income lies at the center of a nexus of forces that shape a country’s economic, institutional and technological structure. This chapter develops a unified model to analyze these interactions and their implications for growth, emphasizing in particular the mechanisms that allow different socioeconomic structures to perpetuate themselves, and those pushing toward convergence.[378] The analysis centers around five main questions.
1. Why do countries at similar levels of development choose widely different social contracts? Redistribution - through taxes and transfers, unemployment and health insurance, education finance and labor market regulation - displays remarkable variations even among countries with similar economic and political fundamentals. I thus ask what makes both European-type welfare states and US-type, more laissez-faire social contracts sustainable in the long run, together with their respective levels of inequality.[379] I then examine the efficiency and growth properties of these two regimes (which cannot be Pareto ranked) and ask what shocks might cause each one to unravel. The model also sheds light on the contrasting historical development paths of North and South America, and on the more recent experience of East Asia versus Latin America.
2. How does skill-biased technical and organizational change impact the viability of redistributive institutions? Over the last twenty-five years, most industrialized countries experienced a considerable rise in wage inequality.[380] This trend is generally attributed to three main factors: skill-biased technical change, international trade (which lies outside the scope of this chapter), and institutional change, such as the erosion of the minimum wage and the decline of unions. But minimum wages, labor market legislation and union power are endogenous outcomes, to the same extent as social insurance and education policy; and indeed, they evolved quite differently in Continental Europe or Canada and in the United States.[381] Analyzing redistributive institutions as a whole, I show how skill-biased technical change can cause the welfare state to unravel, and examine more generally how technological evolutions affect the set of social contracts that can be sustained in the long run.
The previous questions aim to explain differences in redistributive policies (together with their growth implications) and the role of technology in their evolution. The next two take the reverse perspective.
3. What determines the types of technologies and organizational forms used by firms? Production processes - and in particular their degree of skill bias - are themselves endogenous, adapting over time to the skills of the labor force.[382] I develop here a new and very tractable model of technology choice, based on the idea that firms tailor the flexibility of their production processes (substitutability between different labor inputs) to the distribution of human capital in the workforce. The main prediction is that the more heterogeneous are workers’ skill levels, the more flexible and wage-disequalizing the equilibrium technology will be. In a homogeneous country like Japan, by contrast, production will involve much tighter complementarity between workers’ tasks. Integrating this model with the previous analysis of human capital dynamics, I also show that firms’ choices involve externalities that tend to result in excessive flexibility and a suboptimal growth rate, or even in self-sustaining technology-inequality traps.
4. What types of societies and institutions are most conducive to the emergence of skill-biased technologies and organizational forms? Through their influence on the distribution of human capital, public policies in the fiscal, labor market and especially educational arenas are important determinants of what innovations can be profitably developed and adopted; the same is true for immigration. One notes, for instance, that skill-biased technical change and reorganization occurred first, and to a greater extent, in the United States compared to Europe - and within the latter, more so in England than on the Continent. Combining the technology and policy components of the model, I show how a world-wide shift in the technological frontier leads to different evolutions of production processes and skill premia across countries with different social contracts.
Two extensive but essentially disconnected literatures have examined the economic determinants and consequences of redistributive policies on the one hand, those of biased technical change on the other.[383] Yet in reality both are endogenous and jointly determined. The ability to conduct a unified analysis of human capital dynamics, technology and institutions is a novel and key feature of the framework developed in this chapter. It makes it possible to address important questions such as the second, fourth and especially fifth ones on the list:
5. What “societal models” -joint configurations of technology, inequality, and policy - are feasible in the long run? In particular, how does the diffusion of technology affect nations' ability to maintain their own redistributive institutions and social structures? Analyzing the case of two countries linked by the (endogenous) diffusion of their domestically developed technologies, I show how inequality tends to be “exported” to the less heterogeneous one. This mechanism, in turn, generates spillovers between the social contracts of different nations, transmitting even purely political shocks and potentially triggering “chain reactions” that can cause major shifts towards a common, and generally inegalitarian, outcome.
The chapter is organized in two main parts, corresponding respectively to the left- and right-hand sides of Figure 1.7 The first of these two feedback loops centers on political-economy interactions. I thus present in Sections 1 and 2 a model of inequality, growth and redistributive policy in a context of imperfect credit and insurance markets [based on Benabou (2000)]. I first analyze how macro and distributional dynamics are affected by redistributive policies, then how the latter are themselves determined from the preferences and political power of different social classes. Finally, I identify the conditions under which a single or multiple politico-economic steady states arise.
The second and most novel part of the chapter incorporates the role of technology and its interactions with redistributive institutions.
I first consider in Section 3 the impact of exogenous skill-biased technical change on inequality and the political equilibrium. I then study how technology responds to the composition of the labor force, through firms’ choices of their degree of flexibility. In Section 4 both sides of Figure 1 are brought together to analyze the long-run determination of institutions, technologies and the distribution of human capital. In Section 5, finally, I show how technology diffusion leads to the “exporting” of inequality and international spillovers between social contracts. Section 6 concludes. All proofs are gathered in the Appendix.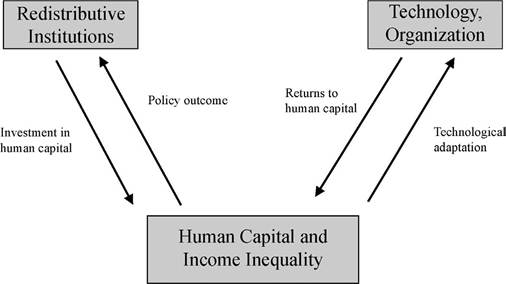
Figure 1. The links between inequality, technology and redistributive institutions.
7 Each arrow on the diagram actually corresponds to a specific equation or proposition in the model. From left to right, these are Equation (11), Proposition 3, Equation (1) or later Equation (28), and Proposition 8.
1. Inequality, redistribution and growth
The model presented in this section [drawing on Benabou (2000)] can be summarized by two key relationships between inequality and redistribution; both arise from imperfections in credit and insurance markets, and are illustrated on Figure 2.
The first locus summarizes the political mechanism: in each period, the equilibrium rate of redistribution chosen by voters is a U-shaped function τ = T (∆) of inequality in human capital, measured here as the variance of a log-normal distribution. The downward-sloping part of this curve, which is the crucial one, reflects a very general intuition: while asset market imperfections create a scope for efficient redistributive institutions (to provide social insurance and relax credit constraints), these institutions command much less support in an unequal society than in a relatively homogeneous one. Thus, starting from ∆ = 0, where there is unanimous support for the ex-ante efficient degree of redistribution, growing inequality increases the fraction of agents rich enough to lose from, and therefore oppose, all but relatively low levels of τ.
The upward-sloping part of the curve, in contrast, is shaped by the standard skewness effect, which eventually dominates: rising numbers of poor will eventually impose more redistribution, well beyond the point where it ceases to be efficient.[384]The second curve on Figure 2 represents the accumulation mechanism: since redistribution relaxes the credit constraints bearing on the poor’s human capital investments,
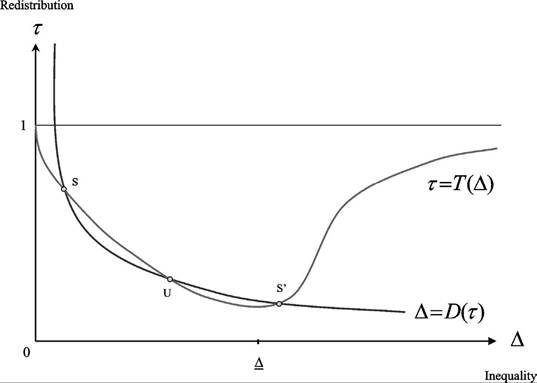
Figure 2. The two key relationships between inequality and redistribution.
long-run inequality is a declining function ∆ = T (τ) of the rate of redistribution. When the two curves have several intersections, as illustrated on the figure, these correspond to multiple politico-economic steady states that are sustainable under the same fundamentals. One, with low inequality and high redistribution, corresponds to a European-type welfare state; the other, with the reverse configuration, to a US-type, more laissez-faire society.
In this and the next section I will derive the two loci from an explicit dynamic model and identify the configurations of economic and political parameters under which alternative social models can coexist. In later sections I shall investigate how the two curves, and therefore the equilibrium set, are affected by exogenous technical change, then ultimately extend the analysis to the case where technology itself adapts endogenously to the distribution of skills in the population.
1.1. Production, preferences and policy
The economy is populated by overlapping-generations families, i ∈ [0, 1]. In generation t, adult i combines his human capital k} with effort Tt to produce output, subject to a productivity shock zlt,

At this point the technology is exogenous and does not explicitly involve interactions among workers.
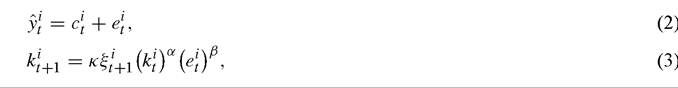
Later on I will introduce a richer production structure, where agents with different skill levels perform complementary tasks and the degree of substitutability between them is optimally chosen by firms. The return to human capital γ and the mean of the productivity shocks z∖ will then be endogenous functions of the current distribution of human capital. From the point of view of an individual worker-voter, however, this richer structure will retain an earnings function very similar to (1), so all the results obtained with this unconstrained reduced form will remain directly applicable.Public policy or labor market institutions redistribute income through taxes and transfers, or a wage-equalization scheme, that transform each agent’s gross earnings (or marginal revenue product) y∖ into a disposable income ;yt!, as specified below. These resources finance both the adult’s consumption c∖ and his investment or educational bequest et:
i
I
where ξt+1 represents the child’s unpredictable ability, or simply luck, and α + βγ ≤ 1. There is thus no loan market for financing individual investments (e.g., children cannot be held responsible for the debts of their parents), and no insurance or securities market where the idiosyncratic risks zlt and ξtt+1 could be diversified away.9 Both shocks are i.i.d. and log-normal with mean one, and initial endowments are also log-normally distributed across families: thus lnzt ~ N(-υ2 /2, v2), lnξtt ~ N(-w2/2, w2) and lnkt0 ~ N(m0, ∆0).
Agents’ preferences over their own consumption, effort, and child’s human capital are defined recursively over their lifetime. Once he has learned his productivity zt, agent t chooses his effort and consumption to maximize,

The disutility of effort is measured by η > 1, which corresponds to an intertemporal elasticity of labor supply of 1∕(η - 1). The discount factor ρ defines the relative weights of the adult’s own felicity and of his bequest motive.10
At the beginning of period t, when evaluating and voting over redistributive policies, the agent does not yet know his lifetime productivity zt. The resulting uncertainty over his ex-post utility level Vtt is reflected in his ex-ante preferences, with a risk-aversion coefficient of a:

This recursive specification allows a to parametrize the insurance value of redistributive policies, just as the labor supply elasticity 1∕(η -1) parametrizes the effort distortions.11 The redistributive policies over which agents vote are represented by simple, progressive schemes that map a market income y[ (marginal revenue product) into a disposable income y[, according to

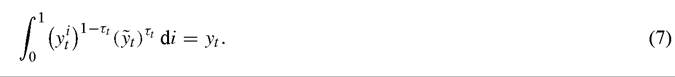
The break-even level yt is determined by the balanced-budget constraint, which requires that net transfers sum to zero. Thus, denoting per capita income by yt, it must be that
9 The absence of any intertemporal trade is clearly an oversimplified (but quite common) representation of asset market incompleteness, making the model analytically tractable. Zhang (2005) extends a simplified version of the present model (with a zero-one policy variable and no political-economy mechanism) to allow for physical capital and financial bequests. He obtains similar results for the effects of inequality, plus new ones on convergence speeds to the steady-state.
10 His (relative) risk-aversion with respect to the child’s endowment ⅛t^1 at that stage is normalized to zero, but this plays no role in any of the results. A dynastic specification of preferences [Benabou (2002)] also leads to similar aggregate and distributional dynamics, but is less simple to work with.
11 When a = 1 these recursive preferences are not time-separable [see, e.g., Kreps and Porteus (1979)], as risk-aversion differs from the inverse of the intertemporal elasticity of substitution in consumption, which by (4) remains fixed at one. This last assumption, common to many papers in the literature, helps make the model analytically solvable.
The elasticity τt measures the degree of progressivity, or equalization, of redistributive institutions.[385] Three types of redistributive mechanisms can be considered here, being close to formally equivalent in this model. The first one, on which the exposition will generally focus, is that of fiscal policy, which equalizes disposable incomes through taxes and transfers. A second is wage or earnings compression through labor market institutions and policies favorable to workers with relatively low skills: minimum wage laws, union-friendly or right-to-strike regulations, firing costs, public sector pay and employment, etc.[386] The third one is education finance, where τt now applies only to human capital expenditures elt, as opposed to all of income ylt. This may be achieved through a policy of school funding equalization across local communities, the presence of a centrally financed public-education system, or more generally by subsidizing differentially the education of rich and poor students.[387] Under either of the three above interpretations of τt, incentive compatibility requires that τt ≤ 1; on the other hand a regressive policy τt < 0 cannot be ruled out a priori, and indeed one does observe such policies, typically in countries characterized by high inequality and a powerful ruling class.
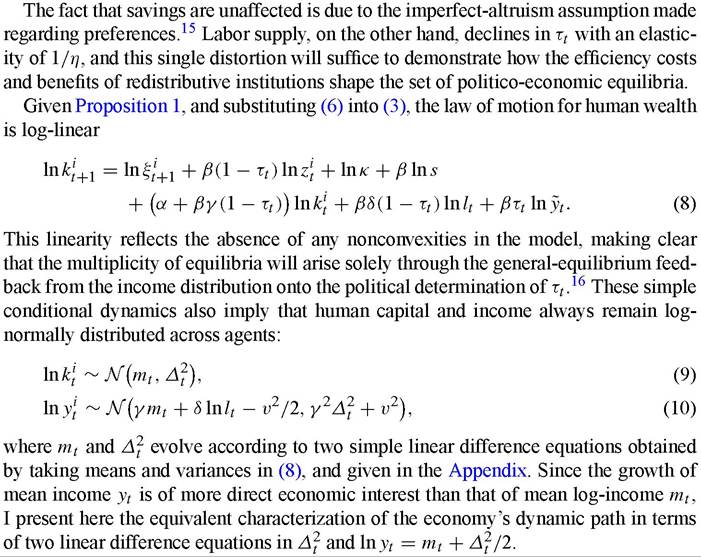
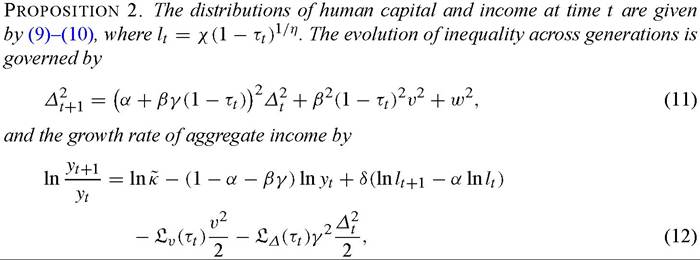
1.2. Distributional dynamics and aggregate growth
Taking policy as parametrically given for the moment, I first consider the resulting economic decisions of individual agents, then the economy-wide dynamics of human capital and income. 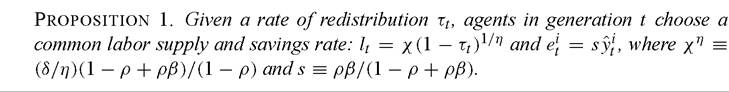
15 In Benabou (2002) I develop and calibrate a version of the present model with dynastic preferences, where τt does affect the savings rate. On the other hand, agents are then able (and will indeed want) to use additional policy instruments, such as consumption taxes and investment subsidies, to alleviate this distortion.
16 Or/and a feedback from the distribution onto the technology γ, once it is endogenized later on. By contrast, nearly all models in the literature that feature multiple equilibria rely on investment thresholds [e.g., Galor and Zeira (1993), Banerjee and Newman (1993)], indivisibilities in effort [Piketty (1997)], or nonhomotheticity in preferences [e.g., Moav (2002)]. For a discussion of indivisibilities, see also Mookherjee and Ray (2003).
where lnK ? γ(lnę + β ln— γ(1 — γ)w2∕2 is a constant and
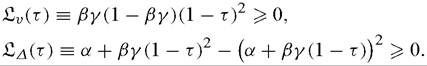
This last variant yields an endogenous-growth version of the model, where all the predictions obtained with a constant ę in (12) now directly transpose from short-run growth and long-run per capita income to long-term growth rates.
17 See Benabou (1996b) for an overview of the literature on the relationship between inequality and growth, which is not the main focus of the present paper. In particular, inequality can also have positive effects on growth when there are nonconvexities in either the investment technology [e.g., Galor and Zeira (1993)] or in preferences [e.g., Galor and Moav (1999)].For recent contributions to the empirical debate, see Forbes (2000) and Banerjee and Duflo (2000).
Are the potential growth-enhancing effects of redistributive policies in the presence of credit constraints significant, or trivial compared to the standard deadweight losses? While the answer must ultimately come from empirical studies of specific policy programs or experiments, recent quantitative models suggest very important long-run effects, ranging from several percentage points of steady-state GDP to several percentage points of long-run growth, depending on the presence of accumulated factors, such as physical capital or knowledge spillovers, that complement individual human capital. Calibrating to US data a model with neither effort distortions nor complementarities, Fernandez and Rogerson (1998) find that complete school finance equalization raises long-run GDP by 3.2%. In a model with both educational and financial bequests, Sheshadri and Yuki (2004) find that a mix of fiscal and educational redistribution that approximates current US policies raises long-run income by 13.5%, relative to laissez-faire. This more substantial impact primarily reflects the induced adjustment of physical capital, but it remains a level effect due to decreasing returns to the two types of capital together. In a dynastic-utility version of the present model with endogenous growth [Benabou (2002)], I find that the growth-maximizing value for fiscal redistribution is τfisc = 21%, which corresponds to a share of redistributive transfers in GDP of 6%; in spite of reduced labor supply this raises the long-run growth rate by 0.5 percentage points. Underthe alternative policy of progressive education finance, the growth-maximizing equalization rate for school expenditures is τeduc = 62%, which raises long-run growth by 2.4 percentage points. In both cases, the efficient policy involves the top 30% of families subsidizing the bottom 70%, whether through the fiscal or the education system.
1.3. Voter preferences, political power and equilibrium policy
I now turn to the determination of policy, which reflects both individual citizens’ preferences and the allocation of power in the political system. In each generation, before the productivity shocks zlt are realized, agents vote on the rate of redistribution τt to which they will be subject; again, this could be through the fiscal system, labor market regulation, or education finance. Applying Propositions 1 and 2 to Equations (4)-(5), an individual i’s intertemporal welfare If can be computed from (5) as a function of the proposed policy τt, his endowment k], and the overall distribution of human capital (mt, ∆t), which is the system’s state variable.[388] Defining the composite efficiency parameter

whose interpretation is given below, the resulting first-order condition for agent i’s ideal
tax rate takes the form
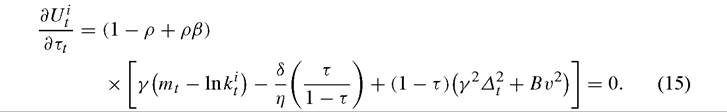
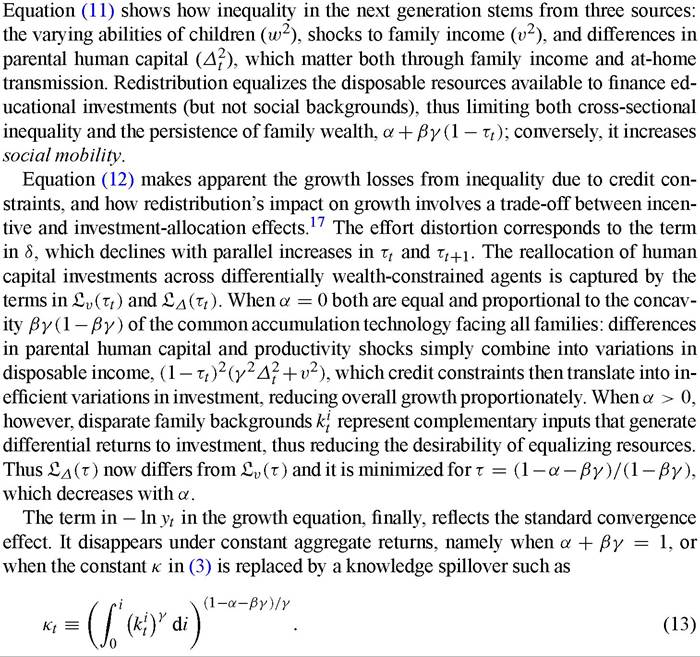
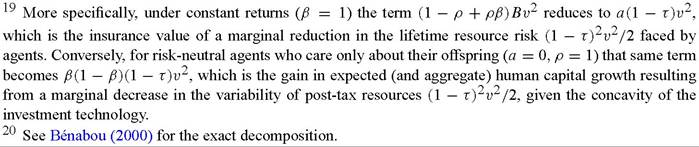
The first term inside the brackets, which disappears when summing across agents, reflects the basic redistributive conflict: since τt reallocates resources (spent on both consumption and children’s education) from rich to poor households, the latter want it to be high, and the former, low. The next two terms represent the aggregate welfare cost and aggregate welfare benefit of a marginal increase in Tt. First, there is the deadweight loss due to the distortion in effort: it is proportional to the labor supply elasticity 1∕η, and vanishes at t = 0. Second, the term (1 — Tt)(γ 2∆2 + Bv2), which is maximized for τt = 1, embodies the (marginal) efficiency gains that arise from better insurance and the redistribution of resources towards more severely credit-constrained investments. Indeed it is clear from (14) that the composite parameter B multiplying the variance of adults’ income shocks v2 is monotonically related to both risk-aversion a and to the extent of decreasing returns in human-capital investment, 1 — β.19 As to initial income inequality, the term γ2∆2- reflects two motives for redistribution.20 First, relaxing preexisting credit constraints tends to increase overall growth [see the last term in (12)], and therefore also average welfare. Second, with concave (logarithmic) utility functions, average welfare increases whenever individual consumptions (of clt and ktt+1) are distributed more equally. Equivalently here, this captures the effect of skewness: given mt, a higher ∆2 implies a higher per capita income ln yt = mt +∆2/2, making redistribution more attractive for the median voter, and more generally at any given level of klt.
From this analysis it easily follows that agent i’s preferred tax rate, obtained as the unique solution < 1 to the quadratic Equation (15), decreases with his endowment k,t and increases with the ex-ante benefits from redistribution Bv2. Similarly, | | decreases with 1∕η, as a more elastic labor supply magnifies the distortions that result from redistributive policies - whether progressive, τ > 0, or regressive, τ < 0.
I now turn from the preferences of different classes of voters to their political power or influence over the process that determines the actual τt. Even in advanced democracies, poor and less educated individuals have a lower propensity to register, turn out to vote and give political contributions, than better-off ones. For voting itself the tendency is relatively moderate, whereas for contributing to campaigns it is drastic. Even for political activities that are time- rather than money-intensive, such as writing to
Congress, attending meetings, trying to convince others, etc., the propensity to participate rises sharply with income and education. These facts are documented for instance in Rosenstone and Hansen (1993), while Bartels (2002) provides a striking study of how they translate into disproportionate political influence. Studying the roll calls of US senators in three Congresses he finds that their votes are more responsive, by a factor ranging from 3 to 15, to the views of their constituents located the 75th income percentile than to those of the 25th; and again more responsive, by a factor of 2-3, to the views of the 99th percentile than to those of the 75th. In less developed countries there is also extensive vote-buying, clientelism, intimidation and the like, which are likely to result in even more bias.
To summarize this political influence of human and financial wealth in a simple manner I shall assume that the pivotal voter is located at the 100 ? p*thpercentile of the distribution, where the critical level p* can be any number in [0, 1]. A perfect democracy corresponds to p* = 1 /2, while an imperfect one where participation or influence rises with social status corresponds to p* > 1/2.[389] [390] Given that klt is here log-normally distributed, an equivalent but more convenient measure of the political system’s departure from the democratic ideal is
(16) where Φ(∙) denotes the c.d.f. of a standard normal. I shall refer to λ as the degree of wealth bias in the political system, and focus on the empirically relevant case where λ > 0.22 Given the location of the pivotal voter, the policy outcome is simply obtained by setting lnklt — mt = λ∆t in the first-order condition ∂U∣ /∂τ = 0. This yields the quadratic equation

When labor supply is inelastic (1∕η = 0), it is immediately apparent that this equilibrium tax rate is U-shaped in ∆t, and minimized where γ2∆2 = Bv2. This is true more generally.
Proposition 3. The rate of redistribution Tt = T {∆t) chosen in generation t is such that
(1) τt increases with the ex-ante efficiency gain from redistribution Bυ2 and decreases with the political influence of wealth, λ;
(2) | τt | decreases with the elasticity of labor supply 1∕η;
(3) τt is U-shaped with respect to inequality ∆t. It starts at the ex-ante optimal rate T (0) > 0, declines to a minimum at some ∆ > 0, then rises back towards T(∞) = 1. The larger Bυ^2, the wider the range [0, ∆ ) where ∂τt∕∂∆t < 0.
The first two results show that equilibrium policy depends on the costs and benefits of redistribution and on the allocation of political influence in a sensible manner. The third one confirms the key insight that efficient redistributions may decrease with inequality; more specifically, it yields the U-shaped function τ = T(∆) shown on Figure 2. The underlying intuition is simple, and very general: (a) when distributional conflict γ∆ is small enough relative to the ex-ante efficiency gains Bυ2, there is widespread support for the redistributive policy, so its equilibrium level is high; (b) as inequality rises, so does the proportion of agents rich enough to be net losers from the policy, who will block all but relatively low levels of τt; (c) at still higher levels of inequality, the standard skewness effect eventually dominates: there are so many poor that they impose high redistribution, even when it is very inefficient.23
It is now well recognized that the standard median-voter model’s prediction of a positive effect of inequality on redistribution fails to explain the empirical patterns actually observed, both across countries [see, e.g., Perotti (1996), Benabou (1996a, 2000), Alesina, Glaeser and Sacerdote (2001)] and within them [see Rodriguez (1999) for panel-data tests on US states]. Among developed countries, in particular, the relationship is in fact negative [Pineda and Rodriguez (2000)]. The present framework explains how and when greater inequality will indeed reduce redistribution, or even result in regressive policies - both in the short run (Proposition 3) and in the long-run, where both are endogenous (Proposition 4). Furthermore, the distinctive nonmonotonic relationship predicted by the model turns out to have empirical support: in tests using cross-country data, Figini (1999) finds in a significant U-shaped effect of income inequality on the shares of tax revenues and government expenditures in GDP; De Mello and Tiongson (2003) find a similar pattern for government transfers.
2.
More on the topic Introduction:
- Introduction
- Introduction
- Introduction
- Introduction
- INTRODUCTION
- Introduction
- CONTENTS
- AVIAN CHOLERA
- Contents
- Hare C., Neo D. (eds.). Trade Finance: Technology, Innovation and Documentary Credit. Oxford University Press,2021. — 417 p., 2021