Welfare and policy implications
In traditional growth theory, technological progress is largely associated with productivity advancements, reflected in improvements in average wages, from which it would follow that there are welfare gains.
While the first generation of growth models is based on the representative-agent assumption, the model economies we studied in these chapter are built on a heterogeneous-agents model. By raising the wage differential between more and less skilled workers (between-group inequality) and by amplifying the amount of labor market uncertainty faced by ex-ante equal households in the economy (residual inequality), in these economies technological change can lead to welfare costs, at least for certain groups of workers, and it has first-order implications for policy. In what follows we give an account of some early work on the subject.9.1. Lifetime earnings inequality
The majority of the empirical investigations on rising inequality in the United States focus on the cross-sectional distribution of wages and earnings. Friedman (1982) argues that data on cross-sectional inequality at a point in time are difficult to interpret, as they provide no information on the degree of economic mobility: the same distribution can be generated either by a “dynamic society” or by a “status society”.
A better measure of inequality, which incorporates some of Friedman’s concerns, is provided by the distribution of lifetime earnings. A stark example of the pitfalls implicit in making welfare and policy statements simply based on distributions at a point in time is provided by Flinn (2002). Flinn compares Italy and the United States and documents that, although the dispersion in cross-sectional yearly earnings inequality in the United States is several times larger than in Italy, the distribution of lifetime earnings in the United States is more compressed due to larger individual variability of labor income and shorter duration of non-employment experiences.
In other words, in Friedman’s language, Italy somewhat surprisingly looks more like a “status society” than does the United States.[242]Two papers, so far, have studied the change in the distribution of lifetime earnings in the United States in the past three decades through the lenses of a structural model.[243] Heckman, Lochner and Taber (1998) solve a deterministic competitive OLG model with endogenous human capital accumulation to study the implications of the widening educational premium for lifetime-earnings inequality across cohorts.[244] Their model implies that the low-educated cohorts entering in the mid-1980s are those suffering the largest drop in lifetime earnings from skill-biased technical change: roughly 11 percent. At the same time, they calculate a rise in lifetime earnings of 6 percent for the college graduates in the same cohort.
Similarly, Bowlus and Robin (2004) use a search model with risk-neutrality, estimated on matched CPS data from 1977 to 1997, to study how changes in wage and employment dynamics over the past thirty years have affected the evolution of lifetime labor income inequality in the U.S. labor market. They find that the median worker suffered only a small decline in present value lifetime earnings, but that there is large heterogeneity across educational groups with lifetime earnings declining by over 25 percent for high-school graduates and increasing by almost 20 percent for college graduates.
These numbers are over twice as large as those in Heckman, Lochner and Taber (1998). One reason is that Heckman et al. model the acquisition of education and the costs associated with schooling explicitly. A large fraction of the changes in lifetime earnings is attributable to the surge in the returns to education: since education in reality is the outcome of a costly investment choice, the difference in earnings alone likely overstates the true welfare differential between the two groups in the analysis of Bowlus and Robin.
9.2. Consumption inequality
There is a definite gain in moving from studying hourly wages to lifetime labor income, if one wants to make inference on welfare. However, one important limit of the studies above is that they effectively assume complete insurance against those transitory income fluctuations that cancel out in the long run and thus do not affect lifetime income. With imperfect insurance against labor market risk, consumption is not determined only by purely permanent shocks that translate one-for-one into permanent income, but the degree of earnings variability and its persistence become important, too. In this sense, consumption is an even better measure of welfare than lifetime earnings.
The evidence based on Consumption and Expenditure Survey (CEX) data suggests that consumption inequality rose slightly during the first half of the 1980s [Cutler and Katz (1992) and Johnson and Shipp (1997)] and has remained roughly stable thereafter [Krueger and Perri (2002)]. Interestingly, Blundell and Preston (1998) document that in Britain, where the increase in wage inequality followed a pattern similar to the United States, the rise in consumption inequality was also strong until the early 1980s, but weaker afterwards. This path of consumption inequality is, at first sight, puzzling, especially since wage inequality keeps increasing in the 1990s, albeit at a slower pace. Three explanations for this puzzle have been provided so far.
Krueger and Perri (2002) developed the first formal model to solve this apparent puzzle. They consider an Arrow-Debreu economy with limited enforcement of contracts [Kocherlakota (1996)]. In this economy, the degree of insurance market completeness is endogenous and responds to changes in income risk: as income shocks become larger and more persistent, the value of autarky declines, so agents are willing to enter more often into risk-sharing agreements. The central message of Krueger and Perri is that the rise of labor market inequality led to a development in financial markets - in particular the sharp expansion of consumer credit in the 1990s - and to a larger extent of risk sharing, limiting the rise in consumption inequality in this period.
Heathcote, Storesletten and Violante (2003) offer an alternative interpretation for this pattern of rising and then flattening consumption inequality. Through a statistical decomposition of the rise in wage dispersion into permanent and transitory components, they conclude that the relative importance of the two components changes substantially over the sample period. From the late 1970s to around 1990 the permanent component increases sharply, but in the 1990s it ceases to grow, whereas there is a substantial increase in the variance of transitory shocks. A standard overlapping-generations model with “exogenously” incomplete-markets [Huggett (1996)] predicts a trajectory for consumption inequality similar to the data: as the shocks become more transitory, they are easier to insure and tend to have a smaller impact on consumption. The finding that the first phase of the rise in inequality (1980s) had a more permanent nature than the second (1990s) is common to a number of empirical studies [Gottschalk and Moffitt (1994) for the United States, and Dickens (2000) and Blundell and Preston (1998) for the United Kingdom]. To our knowledge, there is no attempt to link this pattern of persistence with the nature of technical progress.
The third explanation is provided by Attanasio, Battistin and Ichimura (2003) who argue that once measurement error in the CEX data is properly taken into account, consumption inequality keeps rising also in the 1990s and, hence, that there is no puzzle.
9.3. Welfare implications
Studying consumption inequality is a further improvement toward the understanding of the welfare costs of rising inequality, but a complete welfare analysis cannot abstract from leisure.
One approach that has been taken in the literature makes minimal assumptions regarding the structure of the underlying economic model. Krueger and Perri (2003), in an exercise similar in spirit to that in Attanasio and Davis (1996), estimate a stochastic process directly on consumption and leisure data from the CEX and use standard intertemporal preferences to compute the welfare costs of rising inequality.
The computation of welfare losses “under the veil of ignorance”, i.e., before the worker finds out whether she will be high- or low-skilled, yields numbers between 1 percent and 2 percent, with a difference in the welfare losses between the 90th percentile (net winners) and the 10th percentile (net losers) of just over 10 percent. To put this number in perspective, the estimate of Bowlus and Robin (2004) is 50 percent.This approach is based entirely on revealed preferences, and has the advantage that no restrictive assumptions have to be made on the degree and the nature of market completeness. However, without a structural model [like those of Bowlus and Robin (2004) and Heckman, Lochner and Taber (1998)], strong faith must be placed in the reliability of the consumption and hours data from the CEX. In particular, if there are large transitory measurement errors, then one would overestimate the extent of economic mobility and underestimate the welfare losses coming from the change in the wage structure. Moreover, all that can be assessed through this methodology is the welfare cost of changes in consumption and leisure inequality, without knowing exactly what fraction of these changes are attributable to rising wage inequality rather than, for example, tax reforms or changes in financial and insurance markets that occurred over the same period.
A second approach, developed by Heathcote, Storesletten and Violante (2003), builds on three steps: (1) an estimation of the dynamics of permanent and transitory components of individual wages over the period of interest, (2) a calibration of an OLG model with endogenous leisure and consumption choices and incomplete markets, (3) simulation of the model to compute the welfare costs of the changes in wage dynamics. This approach, thus, is fully structural and, as such, it does not rely heavily on survey data on consumption and hours worked. Rather, welfare calculations are based on the changes in the model-generated consumption and leisure paths due exclusively to observed and well-measured changes in the wage process over the period.
At the same time, it incorporates a realistic range of insurance avenues (a saving technology, labor supply, and social security) without going as far as assuming complete markets.According to the calculations of Heathcote, Storesletten and Violante (2003), welfare losses “under the veil of ignorance”, although varied by cohort, average 2.5 percent across all cohorts, with a peak of 5 percent for the cohorts entered in the mid-1980s. The low-skill workers suffer a loss of 16 percent, and the high-skill workers enjoy a welfare gain of 13 percent. These numbers fall in between the estimates of Bowlus and Robin (2004) and those of Heckman, Lochner and Taber (1998).
Two main conclusions emerge. First, the welfare consequences of the observed rise in labor market risk are quite different across groups of workers: whereas the high- skill, high-educated workers are the winners, the low-skill, low-educated workers are the losers. Second, the ex-ante welfare loss from the rise in labor market risk in the United States is of the order of 2 percent of lifetime consumption, which is a rather large number.
9.3.1. Insurance and opportunities in the welfare analysis of wage inequality
The quantitative studies on the welfare consequences of the recent rise in inequality point to a sizeable welfare loss. But does the absence of full insurance always imply a welfare decrease when risk increases? The answer is no. We have already mentioned the case studied by Krueger and Perri (2002) where, with endogenous market incompleteness, a rise in uncertainty can lead to more risk sharing in society and increase welfare. The same result can arise for different reasons in models where the extent of risk-sharing is limited exogenously (Bewley-Aiyagari economies). Consider, as do Heathcote, Storesletten and Violante (2004), an economy populated by a measure one of infinitely-lived agents with preferences
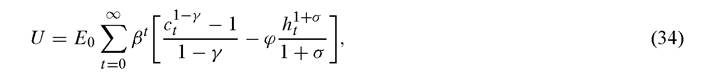
where 1 /γ is the elasticity of intertemporal substitution and 1 /σ is the Frisch elasticity of labor supply. Each agent i starts with zero wealth and faces log-normal productivity
shocks to the efficiency units of labor ωit. Shocks can be decomposed into two orthogonal components

where ai is the permanent-uninsurable component and εit is the transitory-insurable component. Note that the means have been normalized so that a rise in the variance of either component does not affect the average level of efficiency units.
After computing the allocations and substituting them into preferences (34), one can calculate the welfare gain of an increase in the two components of wage uncertainty - expressed as the equivalent consumption variation. The main finding is that one can obtain an (approximate) closed-form expression for the welfare gain W,

This expression only depends on two elasticity parameters (γ, σ) and on the change in the two variances (∆va, ∆vε). The key feature to note, in the above equation, is that the welfare gain is not always negative. For example, as γ → 0 (risk-neutrality), the welfare gain is positive and proportional to the rise in overall inequality (∆vε + ∆va) through the Frisch elasticity.[245]
To understand this result, one has to keep in mind that there are two distinct effects of a rise in labor market uncertainty. On the one hand, “decreased insurance” induces a welfare loss. For example, as risk-aversion rises with γ or as the permanent-uninsurable component va expands, the second term becomes larger and the overall welfare gain tends to become negative. On the other hand, “improved production opportunities” induce a welfare gain. In presence of elastic labor supply (σ low), households supply more hours when they face a good productivity shock and enjoy leisure at times of low-productivity. When the variance of productivity shocks rises, this intertemporal behavior can improve households’ welfare. The net effect depends on the parameterization of preferences and on the empirical assessment of what fraction of the rise in inequality is insurable.
9.3.2. Discussion
Economists have just started to tackle these issues, and many questions still lie ahead. One key area to explore is the role of the family in determining the welfare implications of the rise in wage inequality. Two offsetting forces are at work. First, there is positive assortative matching between spouses along the skill/education dimension. Second, shocks are imperfectly correlated between spouses [Hyslop (2001)]. While the first feature amplifies the surge in inequality and worsens welfare inequalities across families, the second establishes a role for intra-family insurance in dampening the rise in labor market risk. Only a careful quantitative analysis can determine which force is dominant.
Finally, the current welfare studies abstract from some first-order “social” consequences of the rise in inequality and the fall in the wages of the unskilled, such as the decline in labor market participation for low-educated males [Murphy and Topel (1997)], the rise in the crime rate [Kelly (2000)], and the decline in the marriage rate [Gould and Paserman (2003)].[246]
9.4. Briefdirectionsforpolicy
Welfare losses originating from the rise in U.S. inequality in the past three decades are almost one hundred times larger than the standard estimates of the costs of business cycles [Lucas (2003)]. In this sense, policies that act by reallocating risk across agents (like social insurance policies) are a macroeconomic priority compared to policies that reduce the impact of aggregate risk (like monetary or fiscal stabilization policies). But among the myriads of possible government interventions, what are the right redistributive policies?
In Sections 3.2 and 7 we discussed two complementary views of the link between technology and inequality. The first of these views is that technological progress in the past three decades has been complementary to certain permanent individual characteristics, such as ability or education (technology-skill complementarity). The second view is that labor market history is scattered with shocks and stochastic events related to the luck of individuals, firms or industries that determine the degree of fanning out of the skill and earnings distributions among ex-ante equal workers. The rapid diffusion of a new technology amplifies the importance of these stochastic factors, increasing overall earnings instability (technology-luck complementarity).
The emphasis we placed on these two approaches is not just for classification purposes, since they have profoundly different policy implications. Insofar as we are interested in designing policies that reduce inequalities among households, models of technology-ability complementarity suggest that the intervention should be targeted early in the life of an individual, possibly during childhood when the key components of learning ability are being formed. Models of technology-luck complementarity seem to call for interventions that allow the disadvantaged (or unlucky) workers to rebuild their skill level after a shock, such as displacement due to skill obsolescence, has hit.
Examples of both types of policies are abundant in the U.S. economy.[247] In general, the most recent evaluations of programs entailing expenditures and treatment at early childhood report remarkable success. In contrast, the available evidence indicates that welfare-to-work and training programs directed toward adult workers are rather inefficient, as they generate only modest increases in permanent earnings levels [LaLonde, Heckmen and Smith (1999)].
According to Heckman (2000), the reason for the divergence in outcomes across these two classes of policies is twofold. First, investments in human capital at old ages are less efficient, since the elderly worker has less time to recoup the investment; second, “learning begets learning”, so human capital, skills, and abilities acquired at a young ages facilitate future learning.
In this sense, policymakers should have a life-cycle perspective: lifting the unskilled, displaced adults into skilled status is much easier and more efficient if the same workers have been developing their learning ability throughout childhood and youth, possibly with the help of government intervention. For the more mature low-skilled workers with limited learning ability who are subject to unavoidable wage losses due to biased technological change, targeted wage subsidies can be more effective than retraining programs.
10.
More on the topic Welfare and policy implications:
- 3.6 Policy implications
- CONCLUDING REMARKS AND POLICY IMPLICATIONS
- Conclusion and Policy Implications
- The Crisis As a Pivot: The Limits to Fiscal and Monetary Policy and the Need to Devise New Policy Tools
- Possibilities of a Democratic Social-Welfare Ordering: The Need for a ‘Theory of Justice’
- “A brutal indifference to justice and human welfare”
- The Core of Economic Policy and Its Two Pillars: The ‘Logic’ and the ‘Theory’ of Economic Policy
- 2.01 Modern agriculture is subjected to a variety of legal control measures, some originating in European agriculture policy and some from public policy for environmental protection in the countryside.
- Vital Failures and the First Pillar: The Impossibility of a Democratic Social Welfare
- Sacred trusteeship and human rights? Civilisations, development and welfare
- Lameness is not only a major economic problem, but it is also a major welfare issue - for both the cow and the herdsman!
- 11 Tenancy Agreements: Implications of the Basic Payment Scheme
- Chapter 14 From the Constitutional State to the Welfare State
- Moral Implications for States
- Implications for Conservation and Trade
- Archaeological Implications and Predictions
- Practical Implications of the Decision in Grains
- CONCLUSION AND IMPLICATIONS