What we know that (possibly) ain’t so
Development policy has always been subject to fads and fashions. During the 1950s and 1960s, “big push”, planning, and import-substitution were the rallying cries of economic reformers in poor nations.
These ideas lost ground during the 1970s to more market- oriented views that emphasized the role of the price system and outward-orientation.[563] By the late 1980s a remarkable convergence of views had developed around a set of policy principles that John Williamson (1990) infelicitously termed the “Washington Consensus”. These principles remain at the heart of today’s conventional understanding of a desirable policy framework for economic growth, even though they have been greatly embellished and expanded in the years since.The left panel in Table 2 shows Williamson’s original list, which focused on fiscal discipline, “competitive” currencies, trade and financial liberalization, privatization and
Table 2
Rules of good behavior for promoting economic growth
Original Washington Consensus: “Augmented” Washington Consensus:
... the previous 10 items, plus:
| 1. | Fiscal discipline | 11. | Corporate governance |
| 2. | Reorientation of public expenditures | 12. | Anti-corruption |
| 3. | Tax reform | 13. | Flexible labor markets |
| 4. | Interest rate liberalization | 14. | Adherence to WTO disciplines |
| 5. | Unified and competitive exchange rates | 15. | Adherence to international financial codes and standards |
| 6. | Trade liberalization | 16. | “Prudent” capital-account opening |
| 7. | Openness to DFI | 17. | Non-intermediate exchange rate regimes |
| 8. | Privatization | 18. | Independent central banks/inflation targeting |
| 9. | Deregulation | 19. | Social safety nets |
| 10. | Secure property rights | 20. | Targeted poverty reduction |
2000.
How does such a list fare when held against the light of contemporary growth experience? Imagine that we gave Table 2 to an intelligent Martian and asked him to match the growth record displayed in Figure 1 and Table 1 with the expectations that the list generates. How successful would he be in identifying which of the regions adopted the standard policy agenda and which did not?Consider first the high performing East Asian countries. Since this region is the only one that has done consistently well since the early 1960s, the Martianwould reasonably guess that there is a high degree of correspondence between its policies and the list in Table 2. But he would be at best half-right. South Korea’s and Taiwan’s growth policies, to take two important illustrations, exhibit significant departures from the Washington Consensus. Neither country undertook significant deregulation or liberalization of their trade and financial systems well into the 1980s. Far from privatizing, they both relied heavily on public enterprises. South Korea did not even welcome direct foreign investment. And both countries deployed an extensive set of industrial policies that took the form of directed credit, trade protection, export subsidization, tax incentives, and other non-uniform interventions. Using the minimal scorecard of the original Washington Consensus (left panel of Table 2), the Martian would award South Korea a grade of 5 (out of 10) and Taiwan perhaps a 6 [Rodrik (1996b)].
The gap between the East Asian “model” and the more demanding institutional requirements shown on the right panel of Table 2 is, if anything, even larger. I provide a schematic comparison between the standard “ideal” and the East Asian reality in Table 3 for a number of different institutional domains such as corporate governance, financial markets, business-government relationships, and public ownership. Looking at this, the Martian might well conclude that South Korea, Taiwan, and (before them) Japan stood little chance to develop.
Indeed, such were the East Asian anomalies that when the Asian financial crisis of 1997-1998 struck, many observers attributed the crisis to the moral hazard, “cronyism”, and other problems created by East Asian-style institutions [see MacLean (1999), Frankel (2000)].The Martian would also be led astray by China’s boom since the late 1970s and by India’s less phenomenal, but still significant growth pickup since the early 1980s. While both of these countries have transformed their attitudes towards markets and private enterprise during this period, their policy frameworks bear very little resemblance to what is described in Table 2. India deregulated its policy regime slowly and undertook very little privatization. Its trade regime remained heavily restricted late into the 1990s. China did not even adopt a private property rights regime and it merely appended a market system to the scaffolding of a planned economy (as discussed further below). It is hardly an exaggeration to say that had the Chinese economy stagnated in the last couple of decades, the Martian would be in a better position to rationalize it using the policy guidance provided in Table 2 than he is to explain China’s actual performance.[564]
Table 3
East Asian anomalies
| Institutional domain | Standard ideal | “East Asian” pattern |
| Property rights | Private, enforced by the rule of law | Private, but government authority occasionally overrides the law (esp. in Korea). |
| Corporate governance | Shareholder (“outsider”) control, protection of shareholder rights | Insider control |
| Business-government relations | Arms’ length, rule based | Close interactions |
| Industrial organization | Decentralized, competitive markets, with tough anti-trust enforcement | Horizontal and vertical integration in production (chaebol); government-mandated “cartels” |
| Financial system | Deregulated, securities based, with free entry. Prudential supervision through regulatory oversight. | Bank based, restricted entry, heavily controlled by government, directed lending, weak formal regulation |
| Labor markets | Decentralized, de-institutionalized, “flexible” labor markets | Lifetime employment in core enterprises (Japan) |
| International capital flows | “Prudently” free | Restricted (until the 1990s) |
| Public ownership | None in productive sectors | Plenty in upstream industries |
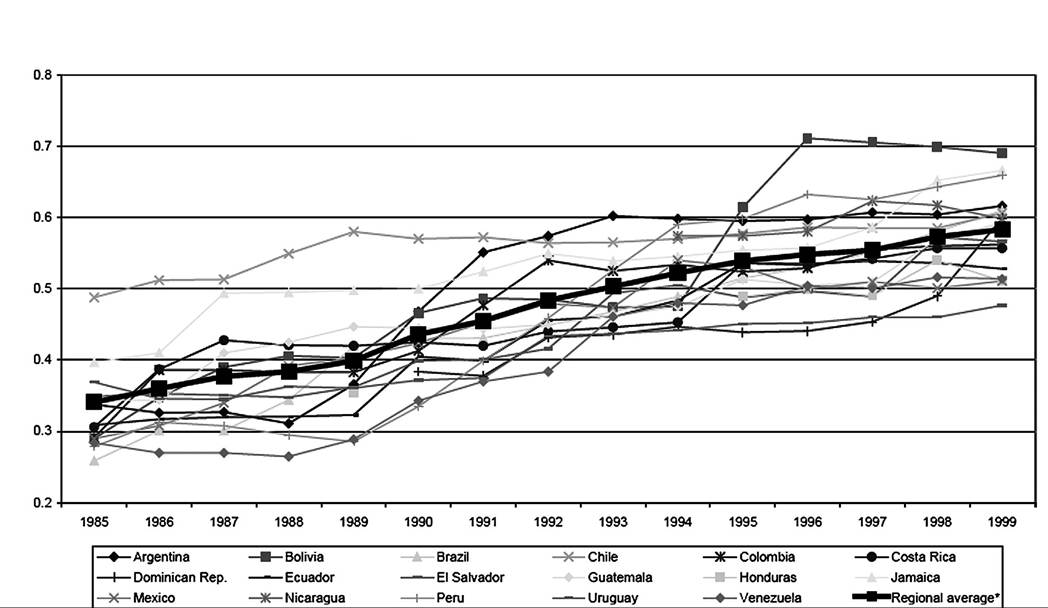
The Martian would be puzzled that the region that made the most determined attempt at remaking itself in the image of Table 2, namely Latin America, has reaped so little growth benefit out of it. Countries such as Mexico, Argentina, Brazil, Colombia, Bolivia, and Peru did more liberalization, deregulation and privatization in the course of a few years than East Asian countries have done in four decades. Figure 2 shows an index of structural reform for these and other Latin American countries, taken from Lora (2001a). The index measures on a scale from 0 to 1 the extent of trade and financial liberalization, tax reform, privatization, and labor-market reform undertaken. The regional average for the index rises steadily from 0.34 in 1985 to 0.58 in 1999. Yet the striking fact from Figure 1 is that Latin America’s growth rate has remained significantly below its pre-1980 level. The Martian would be at a loss to explain why growth is now lower given that the quality of Latin America’s policies, as judged by the list in Table 2,
greater reliance on private entrepreneurship, but as Van Arkadie and Mallon (2003) argue, it is hard to square the extensive role of the state and the nature of the property rights regime with the tenets of the Washington Consensus.
Ch.
14: GrowthStrategies 977Figure 2. Structural reform index for Latin American countries. Source: Lora (2001a).
has improved so much.[565] A similar puzzle, perhaps of a smaller magnitude, arises with respect to Africa, where economic decline persists despite an overall (if less marked) “improvement” in the policy environment.[566]
The Martian would recognize that the growth record is consistent with some of the higher-order economic principles that inspire the standard policy consensus. A semblance of property rights, sound money, fiscal solvency, market-oriented incentives - these are elements that are common to all successful growth strategies.[567] Where they have been lacking, economic performance has been lackluster at best. But the Martian would also have to conclude that the mapping from our more detailed policy preferences (such as those in Table 2) to economic success is quite imperfect. He would wonder if we cannot do better.
3.