Chapter 64 A Diagnosis of the Determinants of Dividend Payout Policy in India: A Factor Analytical Approach
Raj Kumar
Banaras Hindu University, India
Pawan Kumar Jha
Banaras Hindu University, India
ABSTRACT
Dividend decision involves the portion of a firm’s net earnings that are paid out to the shareholders, and the remaining is ploughed back in the company for its growth purpose.
Despite comprehensive theoretical and empirical explanations, dividend policy and its determinants are a puzzle to be fixed in corporate finance. This chapter is an attempt to assess the dynamics and determinants of dividend-payout policy using a factor analytical tool and a multiple regression analysis as a supportive tool. The authors take into account the sample of ten automobile companies based on Market Capitalization listed on the Bombay Stock Exchange (BSE) for a period of 10 years from 2002-2003 to 2012-2013. The results of the factor analysis show that six factors, current ratio, cash flow, retained earnings per share, earnings per share, equity dividend, and corporate dividend tax, are identified as the most critical factors determining dividend payout in Indian automobile companies. However, regression results depict only three factors (i.e. cash flow, equity dividend, and corporate dividend tax) have been found statistically significant in determining dividend payout policy.1. INTRODUCTION
Dividend policy decision is an integral part of a company’s financial decision making as it is explicitly related to the other two major decisions- investment and financing decision. Management should develop such a dividend policy, which divides the net earnings into dividends and retained earnings in an optimum way to achieve the objective of maximizing the wealth of shareholders. It
DOI: 10.4018/978-1-4666-6268-1.ch064
.
refers to the practice that corporate management follows in taking dividend payout-decisions (Lease et al., 2000).
The development of such policy will be greatly influenced by investment opportunities available to the firm and the value of dividends as against capital gains to the shareholders. Since the dividend policy determines whether distribute the earnings to shareholders or self-finance through retained earnings, so it is an important issue that receives more attention these days from financial analysts, academics and practitioners. The corporate dividend policy contributes not only at the micro level but also to the analysis of several macroeconomic issues, as cash dividends constitute a part of national income and any variation in corporate dividend payouts may affect the corporate propensity to save and reinvest. Therefore, it is of great importance not only for the corporation itself but also for the economy as whole.
The study of dividend policy has captured the attention of finance scholars since the middle of the last century. The roots of the literature of determinants of dividend policy and dynamics relates to Lintner’s classic study (1956), Darling (1957), Brittain (1966), and Fama and Babiak (1968). They have attempted to solve several issues pertaining to dividends and formulate theories and models to explain corporate dividend behavior. However, empirical evidences many times provide inconclusive results as to what determines the optimal dividend policy. Almost three decades ago Black (1976) epitomizes the lack of consensus by stating “The harder we look at the dividend picture, the more it seems like a puzzle, with pieces that just don’t fit together.” Corporate dividend policy is not an easy, straight forward and simple aspect of finance as many people conceive it (Hackett, 1981). It has long been regarded as an unresolved economic puzzle, which require rational resolution if the prevailing economic paradigm of corporate finance is to continue (Miller, 1986). Despite many studies conducted by financial economists, the issue of dividend policy determinants still remains debatable.
2. REVIEW OF LITERATURE
Lintner (1956) conducted a classic study on how U.S. managers make dividend decisions, which is focused in the behavioral aspect of dividend policy and concluded that managers only increase dividends when they believe that the level of the firm’s earning has permanently increased.
Miller and Modigliani (1961) argued that in a perfect market dividend policy has no effect on either the price of a firm’s stock or its cost of capital, shareholders wealth is not affected by the dividend decision and therefore, they would be indifferent between dividends and capital gains.
Friend and Puckett (1964) concluded that in growth industries retained earnings are more important than the dividends in determining share price. While, in case of non- growth industries, dividends seem to be more important than retained earnings.
Brittain (1966) indicated that the capacity of a firm to pay dividends has been better explained in terms of cash flows as a variable, i.e., profits after taxes plus depreciation as against the Lintner’s profits net of taxes, as it reflected true earnings.
Farrar and Selwyn (1967) viewed that investors would normally prefer low dividends as the dividends are subject to higher tax rate than that of capital gains resulting out of earnings capitalization.
Fama and Babiak (1968) concluded that net income seems to provide a better measure of dividend than either cash flows or net income and depreciation included as separate variables in the model.
Van Horne and McDonald (1971) found that the payment of dividends through excessive equity financing reduced share prices. While new equity financing and value of share was not found significant in electronics and electric components industry.
Bhole (1980) found that Lintner’s model of stable and active dividend policy did not perform well on Indian data over the study period.
Chawla and Srinivasan (1987) stressed that the impact of dividend was more pronounced than that of the retained earnings but the market started shifting more weight for retained earnings.
Bhat and Pandey (1994) supported the Lintner’s findings and revealed that Indian managers maintained an uninterrupted record of dividend payments and also try to avoid sudden changes in their dividend policies.
Mishra and Narender (1996) examined the dividend behavior pattern of State Owned Enterprise (SOEs) in India by applying Lintner’s model. The study concluded that the number of dividend paying SOEs in India is comparatively small compared to the total number of profit sharing SOEs. In majority of the SOEs, the DPS has remained stagnant irrespective of the continuous increase in the EPS.
Pradhan (2003) found that dividend payment was more important as compared to retained earnings in Nepal. The market price of share would decline if company retained more its earnings.
Eriotis (2005) suggested that distributed earnings and size of firms has been significant impact on dividend payment in Greek market.
Husam et al.(2007) suggested that the proportion of stocks held by insiders and state ownership significantly affected the amount of dividends paid. Size, age, and profitability of the firm seemed to be determinant factors of corporate dividend policy in Jordan.
Kapoor (2008) concluded that existing literature did not explain the dividend payment pattern of IT sector. Only liquidity and beta (year to year variability in earnings) was found to be a noteworthy determinant.
Chen, Huang and Cheng (2009) found that Cash Dividend has significantly positive effect on the Stock Prices. When Cash Dividend increases, Stock Prices also increase and When the Cash Dividend decreases, Share Prices decreases.
Okpara and Godwin Chigozie (2010) showed that three factors-earnings, current ratio and last year’s dividends impact significantly on the dividend payout and dividend yield in Nigeria.
Asif, Rasool, and Kamal (2011) showed the negative relationship between dividend payout and financial leverage while dividend yield showed the positive relationship between dividend yield and dividend per share.
Summinder and Prabhjot (2012) concluded that Lintner’s model and Dobrovolsky’s model has been best fit in the present scenario in case of Indian Manufacturing MSMEs as per crosssectional regression results.
3. STATEMENT OF THE PROBLEM
The study of dividend policy has captured the attention of finance scholars since the middle of the last century. Existing literature on dividend policy and its determinants provides an insight into the dynamics of corporate dividend policies and their implications. However, empirical evidence many a times provides inconclusive results as to what determine the optimal dividend policy. Starting from Lintner (1956) and Miller and Modigliani (1961) irrelevance proposition to date, innumerable theories and empirical findings have been presented but still dividend policy is one of the most important unresolved issues in modern corporate finance.
The capacity of a firm to pay dividends has been better explained in terms of cash flows (Brittain, 1966). Major changes in earnings were the most important determinants of an enterprise’s dividend decisions (Lintner, 1956). DeAngelo et al. (1992) argued that an annual loss is essentially a necessary, but not sufficient condition for dividend reductions in enterprises with established earnings and dividend records. Empirical evidence suggests that profitability, investment opportunities, and size are the important factors determining dividends (Fama and French, 2001). The distributed earnings and size of firms has been significant impact on dividend payment (Eriotis, 2005). Size, age, and profitability of the firm seem to be determinant factors of corporate dividend policy (Husam et al., 2007). Though there are these findings on determinants of dividend policy mainly in developed countries, they are not yet clearly known in India. Therefore, this study attempts to explore the determinants of dividend payout in Indian scenario.
4. OBJECTIVE
The major objective of this study is to identify and analyze the various determinants of dividend payout and dividend yield of Indian companies.
5. DATA AND METHODOLOGY
5.1. Research Design
For the purpose of this study, “Descriptive Research Design” has been employed to deal with the issues prevailing in the research area.
5.2. Data and Study Period
This study is an empirical in nature and makes use of secondary data. The study period for this study is of ten years i.e., from 2003-2004 to 2012-2013.
5.3. Sampling Technique
In order to select the samples more representative of the population “convenience sampling technique” will be used. For a company to be included in the sample should meet the following criteria:
• Companies were listed at Bombay Stock Exchange (BSE) during study period.
• The necessary financial data for calculating the measures of dependent and independent variables pertaining to the years 2003-2004 to 2012-2013 are available.
• The companies did not skip dividend for any two successive years between 2003-2012.
• Further, only those companies whose price data is available are retained in the sample size.
5.4. Selection of Companies
This study takes into account only top 10 automobiles companies listed at BSE based on market capitalization. The Market Capitalization as on 29 April 2013 was used as sorting criteria.
5.5. Methods of Analysis
Factor Analysis
In analyzing the determinant of dividend payout in Indian automobile companies, we employed factor analytical tool and also used regression analysis as a supportive tool. Factor analysis is often used in data reduction to identify a small number of factors that explain most of the variance observed in a much larger number of manifest variables.
The factors used as explanatory variables for the determination of dividend payout ratio are outlined below:
X1=Natural logarithm of total assets of company ‘i’ during period ‘t’ (in Rs crore),
X2=Amount of depreciation(in Rs. crore) of company ‘i’ during period ‘t’,
X3=Net profit after taxes of company ‘i’ during period ‘t’ (in Rs crore),
X4= Cash flows of company ‘i’ during period ‘t’(in Rs. crore),
X5= Current year equity dividend,
X6=Lagged equity dividend of company ‘i’ during period ‘t-1’ (Rs. crore),
X7 = Corporate dividend tax of company ‘i’ during period ‘t-1’ (Rs. crore),
X8 = Earnings per share of company ‘i’ during period ‘t-1’ (Rs. crore),
X9=Book value per share of company ‘i’ during period ‘t-1’ (Rs. crore),
X10=Dividend per share of company ‘i’ during period ‘t-1’ (Rs. crore),
X11=Retained earnings per share of company ‘i’ during period ‘t-1’ (Rs. crore),
X12=Return on net worth, X13= Return on assets,
X14=Total debt to owners fund, X15= Fixed charges coverage ratio,
X16= Current ratio, X17=Quick ratio, and X18= Price earnings ratio.
The statistical techniques of Principal Component Factor analysis and regression analysis have been used to explain the relationship between these variables. Since the variables identified as per the available literature were not on same scale. Therefore, they were standardized and converted into the same scale.
6. EMPIRICAL RESULTS AND DISCUSSIONS
Factor Analysis
The estimates of the extent each factor impacts on dividend payout as analyzed based on maximum communalities likelihood extraction analysis are presented in Table 1. The communalities table shows how much of the variance in the variables has been accounted for by the extracted factors. The results of the communalities in Table 2 show that all the variables are well and completely fit with the factor solution and none could be possibly dropped from the analysis. In view of this, we employed the principal component analysis of the extraction method presented in Table 3.
The results showed that six (6) components were extracted less than 1.069 eigenvalue. The clustering of decision factors affecting dividend payout within the six components generated normalized
Table 1. List of automobile sample companies
| Automobile Sector | Market Capitalization Rs Crore | |
| 1. | Tata Motors | 95, 017.60 |
| 2. | Mahindra and Mahindra Ltd | 55, 331.95 |
| 3. | Bajaj Auto Ltd. | 55, 130.20 |
| 4. | Maruti Suzuki | 50, 898.98 |
| 5. | Hero Motorcorp | 33, 195.05 |
| 6. | Eicher Motors Ltd. | 7, 911.29 |
| 7. | Ashok Leyland Ltd. | 5, 999.83 |
| 8. | TVS Motor | 1, 848.09 |
| 9. | Force Motors | 503.33 |
| 10. | Maharastra Schooters | 430.29 |
Table 2. Communalities
| Initial | Extraction | |
| Natural logarithm of Total Asset | 1.000 | .777 |
| Depreciation Charges | 1.000 | .820 |
| Net Profit After Tax | 1.000 | .898 |
| Cash Flows | 1.000 | .960 |
| Equity Dividend | 1.000 | .925 |
| Lag Equity Dividend | 1.000 | .718 |
| Corporate Dividend Tax | 1.000 | .915 |
| Earnings Per Share | 1.000 | .933 |
| Book Value Per Share | 1.000 | .750 |
| Dividend Per Share | 1.000 | .840 |
| Retained Earnings Per Share | 1.000 | .939 |
| Return on Net Worth | 1.000 | .786 |
| Return on Assets | 1.000 | .864 |
| Total Debt to Owners Funds | 1.000 | .708 |
| Fixed Charges Coverage Ratio | 1.000 | .880 |
| Current Ratio | 1.000 | .971 |
| Quick Ratio | 1.000 | .971 |
| Price Earnings Ratio | 1.000 | .870 |
Extraction Method: Principal Component Analysis.
Table 3. Total variance explained
| Component | Initial Eigenvalues | Extraction Sums of Squared Loadings | ||||
| Total | % of Variance | Cumulative % | Total | % of Variance | Cumulative % | |
| 1 | 6.396 | 35.536 | 35.536 | 6.396 | 35.536 | 35.536 |
| 2 | 3.230 | 17.945 | 53.480 | 3.230 | 17.945 | 53.480 |
| 3 | 2.313 | 12.848 | 66.329 | 2.313 | bgcolor=white>12.84866.329 | |
| 4 | 1.336 | 7.423 | 73.752 | 1.336 | 7.423 | 73.752 |
| 5 | 1.181 | 6.560 | 80.312 | 1.181 | 6.560 | 80.312 |
| 6 | 1.069 | 5.938 | 86.250 | 1.069 | 5.938 | 86.250 |
| 7 | .932 | 5.178 | 91.428 | |||
| 8 | .430 | 2.386 | 93.814 | |||
| 9 | .364 | 2.023 | 95.837 | |||
| 10 | .308 | 1.711 | 97.548 | |||
| 11 | .173 | .960 | 98.509 | |||
| 12 | .114 | .633 | 99.142 | |||
| 13 | .069 | .385 | 99.527 | |||
| 14 | .052 | .289 | 99.815 | |||
| 15 | .032 | .177 | 99.993 | |||
| 16 | .001 | .007 | 100.000 | |||
| 17 | -1.52E-016 | -8.43E-016 | 100.000 | |||
| 18 | -3.56E-016 | -1.98E-015 | 100.000 | |||
Extraction Method: Principal Component Analysis.
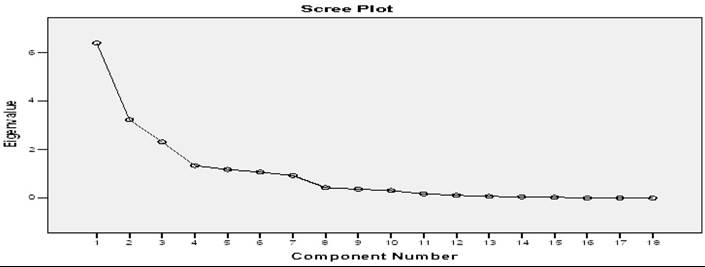
cumulative sums of squared loading of 86.25 percent. This showed that the six decision variables depict about 86.25 percent of the characteristics of the eighteen (18) isolated factors. In other words, 86.25 percent of the total variation in the level of dividend determination in explained by cumulative effect of the six components extracted. The six components were indicative in the Scree plot. To identify the variables that form the six components, the component matrix was presented in Table 4. The table showing the loading of the factors into the six principal components indicated that the variables (factors), current ratio, cash flow, retained earnings per share, earnings per share, equity dividend and corporate dividend tax were identified as the most critical factors determining dividend payout in automobile companies.
Correlation Matrix
The correlation matrix (Table 5) provides a summary of extracted variables used in the study and matrix of multiple correlations of regression variables. This table displays Pearson correlation coefficients of variables. It depicts that the dividend payout ratio (DPRt) is positively related to equity dividend and corporate dividend tax and negatively related to CRt, CFt, REPSt and EPSt.
Regression Analysis
The alternative econometric method using the multiple regression equations on the six factors identified, are presented below:
Table 4. Component matrix (a)
| Component | ||||||
| 1 | 2 | 3 | 4 | 5 | 6 | |
| Natural logarithm of Total Asset | .652 | .533 | ||||
| Depreciation Charges | .643 | |||||
| Net Profit After Tax | .890 | |||||
| Cash Flows | .790 | .509 | ||||
| Equity Dividend | .873 | |||||
| Lag Equity Dividend | .777 | |||||
| Corporate Dividend Tax | .863 | |||||
| Earnings Per Share | .514 | .764 | ||||
| Book Value Per Share | .666 | |||||
| Dividend Per Share | .752 | |||||
| Retained Earnings Per Share | .840 | |||||
| Return on Net Worth | .681 | |||||
| Return on Assets | .711 | |||||
| Total Debt to Owners Funds | -.613 | |||||
| Fixed Charges Coverage Ratio | .683 | |||||
| Current Ratio | .617 | .536 | ||||
| Quick Ratio | .561 | .541 | ||||
| Price Earnings Ratio | .559 | -.730 | ||||
Extraction Method: Principal Component Analysis. a 6 components extracted.
Table 5. Correlation matrix
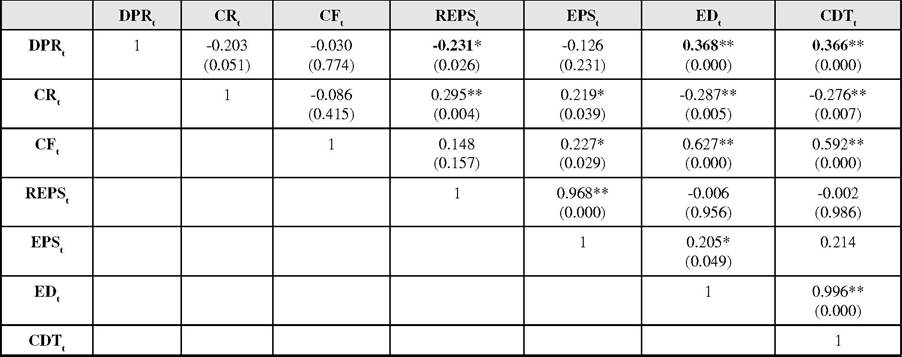
The figures in parentheses are p-value. The asterisk (*) shows that the correlation is significant at the 0.05 level. While the asterisk (**) shows that the correlation is significant at the 0.01 level.
Figure 1. Screen plot of total variance explained
DPRt = β0 + β1CRt + β2CFt + β3REPSt + β3EPSt + β4EDt+ β3CDTt + Ut. (1)
where, DPRt = Dividend payout ratio in period‘t’; CRt = Current ratio in period’t’ CFt = Cash flow in period‘t’; REPSt = Retained earnings per share in period‘t’; EPSt = Earnings per share in period‘t’; EDt = Total equity dividend in period‘t’; CDTt = Corporate dividend tax in period‘t’, and Ut = Error term.
The results from the regression analysis for the sample observations are presented in Table 6, which shows that CRt EPSt and EDt positively affected DPRt since their coefficients were positive. While the coefficients of CFt, REPSt and CDTt were negative which showed that they negatively affect DPRt. The adjusted R squared value is 26.5 percent. It indicated that all explanatory variables explain on average 26.5 percent of the variation in DPRt. The p-value of CFt EDt, and CDTt were 0.001, 0.013 and 0.036. It showed that only CFt, EDt and CDTt were significant at 5 percent level of significance. Further, the regression equation was found significant as calculated F = 6.51 > F = 2.17 at 5 percent level of significance for 6, 86 degree of freedom. The value of the Durbin- Watson test statistic ranges from 0 to 4. As a general rule of thumb, the residuals are uncorrelated if the Durbin-Watson statistic is approximately 2. In this study, we found the value of Durbin-Watson statistic is 1.52, which indicated no serial correlation. Thus, only three factors (CFt, EDt, and CDTt) out of six factors (extracted from factor analysis) had been found statistically significant using multiple regression analysis.
7. SUMMARY AND CONCLUSION
The behavior of dividend policy is the most debatable issue in the corporate finance literature and still keeps its prominent place in developed and emerging markets. This study is an attempt to explore the factors determining dividend-payout
Table 6. Regression results of dividend payout ratio (dpr) and the identified variables
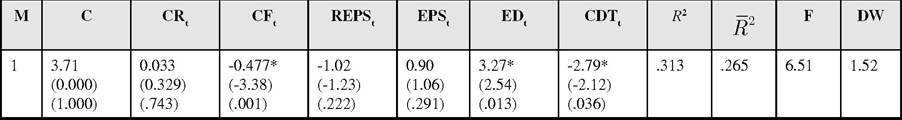
Note: The figures in parentheses in first row are t-value and second row are p-value. The asterisk (*) sign indicates that the coefficient is significant at 5 percent level of significance.
policy using factor analysis and regression analysis statistical tools. The results of factor analysis showed that six factors, current ratio, cash flow, retained earnings per share, earnings per share, equity dividend and corporate dividend tax were identified as the most critical factors determining dividend payout in Indian automobile companies. However, regression results depicted that only three factors i.e. cash flow, equity dividend and corporate dividend tax have been found stati stic ally significant. The regression results show that current ratio, earnings per share, and equity dividend positively affect dividend payout ratio. While cash flow, retained earnings per share, and corporate dividend tax negatively affect dividend payout. The explanatory variables explain on average 26.5 percent of the variation in DPRt. Only cash flow, equity dividend, and corporate dividend tax had been found statistically significant using multiple regression analysis.
REFERENCES
Bhat, R., & Pandey, I. (1994). Dividend decision: A study of manager’s perceptions. Decision, 21, 67-83.
Bhole, L. (1980, August). Retained earnings, dividends, and share prices of Indian joint stock companies. Economic and Political Weekly.
Black, F., & Scholes. (1976). The dividend puzzle. Journal of Portfolio Management, 2, 5-8.
Brittain, J. (1966). The tax structure and corporate dividend policy. The American Economic Review, 54(3).
Chawla, D., & Srinivasan, G. (1987). Impact of dividend and retention on share price-an economic study. Decision, 137-140.
Chen, D., Huang, H., & Cheng, T. (2009). The announcement effects of cash dividend changes on share prices: An empirical analysis. Chinese Economy, 42(1), 62-85.
Darling, P. (1957). The influence of expectations and liquidity on dividend policy. The Journal of Political Economy.
DeAngelo, H. L., & Skinner, D. (1992). Dividend and losses. The Journal of Finance, 47, 18371863. doi:10.1111/j.1540-6261.1992.tb04685.x
Eriotis, N. (2005). The effect of distribution earnings and size of the firm to its dividend policy. International and Economics, 4 (167).
Fama, E., & Babilak, H. (1968). Dividend policy: An empirical analysis. Journal of the American Statistical Association, 63, 1132-1161. doi:10.1 080/01621459.1968.10480917
Farrar, D., & Selwyen, L. (1967). Taxes, corporate financial policy, and returns to investors. National Tax Journal, 444-454.
Friend, I., & Puckett, M. (1964). Dividends and stock prices. The American Economic Review, 54(5), 656-682.
Hackett, J. (1981). Dividend policy. New York: Ronald Press Publication.
Husam, A., & Malkawai. (2007). Determinants of corporate dividend policy in Jordon: An application of the Tobit model. Journal of Economic and Administrative Sciences, 23(2), 44-70. doi:10.1108/10264116200700007
Kanwal, A., & Kapoor, S. (2009). Determinants of dividend payout rations-A study of Indian IT sector. Institute of Management Studies, Ghaziabad.
Lease, R. C., John, K., Kalay, A., Loewenstein, U., & Sarig, O. H. (2000). Dividend policy: Its impact on firm value. Boston: Harvard Business School Press.
Lintner, J. V. (1956). Distribution of incomes of corporations among dividends, retained earnings, and taxes. The American Economic Review, 46(2), 97-113.
Miller, M. (1986, October). Behavior rationality in finance: The case of dividends. The Journal of Business, 5451-5468.
Miller, M., & Modigliani, F. (1961). Dividend policy, growth, and the valuation of shares. The Journal of Business, 34(4), 411-433. doi:10.1086/294442
Mishra, S. C., & Narender, V. (1996). Dividend policy of SOE’s in India-An analysis. Finance India, 10(3), 633-645.
Okpara, G. C. (2010). A diagnosis of the determinant of dividend pay-out policy in Nigeria: A factor analytical approach. American Journal of Scientific Research, 57-67.
Pradhan, R. (2003). Effects of dividends on common stock prices: The Nepalese evidence. Research in Nepalese Finance, 2, 12-13.
Summinder, K., & Prabhjot, K. (2012). Empirical validity of dividend policy models in the Indian manufacturing MSMESs. International Journal of Multidisciplinary Management Studies, 2(1).
Van Horne, J. C., & McDonald, J. G. (1971). Dividend policy and new equity financing. The Journal of Finance, 26, 507-519. doi:10.1111/j.1540-6261.1971.tb00911.x
KEY TERMS AND DEFINITIONS
Dividend Puzzle: A concept in finance in which companies that pay dividends are rewarded by investors with higher valuations, even though, according to many economists, it should not matter to investors whether a firm pays dividends or not. The reasoning goes that dividends, from the investor’s point of view, should have no effect on the process of valuing equity because the investor already owns the firm and, thus, he/she should be indifferent to either getting the dividends or having them re-invested in the firm.
Payout Policy: Dividend policy decision is an integral part of a company’s financial decision making, as it is explicitly related to the other two major decisions-investment and financing decision. Management should develop such a dividend policy, which divides the net earnings into dividends and retained earnings in an optimum way to achieve the objective of maximizing the wealth of shareholders.
Shareholders’ Wealth: Maximisation of shareholders’ purchasing power. It is any attempt made by a shareholder to accumulate as much wealth as possible, by whatever means possible. Wealth maximisation is a long term objective, although in some instances a short term effort may be carried out to provide shareholders with wealth.
This work was previously published in Handbook of Research on Strategic Business Infrastructure Development and Contemporary Issues in Finance, edited by Nilanjan Ray and Kaushik Chakraborty, pages 46-55, copyright 2014 by Business Science Reference (an imprint of IGI Global).