Chapter 41 Investment Attractiveness of Visegrad Group Countries: Comparative Analysis
Tomasz Dorozynski
University of Lodz, Poland
Anetta Kuna-Marszatek
University of Lodz, Poland
ABSTRACT
The aims of this chapter are to evaluate the main determinants of the inflow of FDI into selected countries of CEE and to examine the volume, dynamics, and structure of FDI inflow into these countries.
Due to certain similarities, the authors focus the analysis on four countries: Poland, the Czech Republic, Hungary, and Slovakia. The reasons are geographic proximity, political, economic, and cultural similarities, as well as shared experiences of economic transformation. This chapter focuses on matters pertaining to foreign direct investment, mostly on the reasons motivating FDI inflow in light of selected studies and theories. The authors also provide characteristics of the dynamics and structure of FDI inflow into the V4 countries. The final part of the chapter compares investment attractiveness, the system of incentives, and identifies barriers facing investors in the analyzed countries.INTRODUCTION
One of the main features of the modern economy is the internationalization of economic operations, which is connected with globalization and regionalization, This consists mainly of establishing and developing transnational links among companies. These links may take various forms, starting from simple ones (e.g. exports) up to the much more advanced channels of international capital flows.
DOI: 10.4018/978-1-4666-6268-1.ch041
One of the ways to expand into a foreign market is foreign direct investment (Stawicka, 2007, p. 7).
As mentioned, foreign direct investment (FDI) is linked to regionalization and globalization, particularly when it comes to the selection of investment localization. Regionalization may be considered at two levels. Firstly, there is international economic integration, i.e. the establishing of regional integration groupings (regionalization of the world economy).
Secondly, there is also the currently observed phenomenon of increased importance of regions and their emergence as separate structures (regionalization of national economies). Globalization, in the context of economic development, may lead, on the one hand, to differentiated effects and marginalization of some areas and, on the other hand, to the increased importance of a territory and location as a source of competitive advantage. Thus, we are dealing with two apparently contradictory phenomena, whereby globalization increases the importance of a territory at the regional and local level. In the literature this is referred to as glocalization (Robertson, 1994; Svensson, 2001; Swyngedouw, 2004; Pietrzyk, 2004)..
International capital flows, also in the form of FDI, are among the main factors conducive to globalization. At the same time, investors are seeking locations that would meet their specific expectations and boost business development. The countries of Central and Eastern Europe (CEE), when implementing systemic transformation at the beginning of the 1990s and opening up their markets for foreign investors, also had to face these new trends in the global economy. Since 1991 these countries are also members of the Visegrad Group (V4), established with the initial objective to support the aspirations of Poland, Czechoslovakia (later the Czech Republic and Slovakia) and Hungary on their path to EU accession. After 2004, in accordance with its Declaration, the V4 has aimed at optimum cooperation with all countries, in particular with its neighbouring countries, and its ultimate goal is the development of democracy in all parts of Europe. Moreover, its members support the building of European security based on cooperation and coordination within existing European and Transatlantic institutions and structures. These countries are also connected by their cooperation within the structures of the European Union (EU), NATO, OECD, and WTO.
The countries of Central and Eastern Europe by offering relatively good location and human resources at relatively low operational cost, and by investing in infrastructure, they became attractive investment locations.
For over 20 years Central and Eastern Europe in particular the Visegrad Group countries, has become an ever more attractive destination for long-term capital investment. According to the assessment of Ernst & Young, Central and Eastern Europe is the third the most interesting investment region globally (Ernst & Young’s, 2012). The reasons behind this are not only systemic transformation and the opening up of their economies to foreign investors, but also general security, related to membership in international organizations and being a part of the European single market. The countries’ EU accession in 2004 particularly boosted investors’ interest in the region, providing the guarantee of stability and relatively high economic and legal predictability.As a corollary of the V4 countries’ EU membership, entrepreneurs achieved access to numerous State aid programs. They may expect better economic operational conditions with the support of the EU structural funds, the Cohesion Fund, as well as other external sources of funding, such as, e.g. the Norwegian Financial Mechanism, EEA Financial Mechanism, and bilateral cooperation programs with Switzerland. Thus, the Visegrad Group countries offer investors benefits connected with economic and political security and the access to a large and affluent market at relatively low business operational costs, plus all sorts of allowances and preferences (Ministry of Economy, 2012).
Contrary to common opinion, however, the assessment of FDI inflow to countries and regions is not without ambiguity. For this reason, in this Chapter we try to illustrate the overall effect of FDI inflow to the countries of Central and Eastern Europe, using the example of Visegrad Group members, i.e. Poland, the Czech Republic, Hungary, and Slovakia. Besides the overview of selected theoretical aspects and empirical studies, the Chapter focuses on the dynamics and structure of FDI inflow to a region and on the assessment of the investment attractiveness of the analyzed area.
BACKGROUND: FDI IN THEORY AND EMPIRICAL STUDIES
Definition and Types of FDI
Capital migration in the form of FDI is one of the most important consequences of globalization and, at the same time, it is a catalyst for the internationalization of manufacturing, services, and trade, and a leading source of technology and know-how. Besides, among the various sources of foreign capital, FDI is regarded as the most beneficial and the safest type of international capital flows and a way of financing restructuring and development in the host countries. FDI inflow results not only in the transfer of financial resources but it also brings concrete investment goods. Under a favourable combination of systemic and structural factors, it is the most efficient way of receiving foreign capital and a vital factor for accelerating growth. Its role is most clearly visible in those countries which underwent systemic transformations, including the countries of Central and Eastern Europe, which for over two decades have been trying to generate a good business climate for foreign investors. Thus, investors may help a country (region) improve its image in international business circles, which, in turn, impacts its ability to compete for more investors and to generate growth. This is why FDI is so valuable for areas competing within Regional Trade Agreements (RTAs). So the first question naturally is: What is FDI?
According to the OECD definition, foreign direct investment “reflects the objective of establishing a lasting interest by a resident enterprise in one economy (direct investor) in an enterprise (direct investment enterprise) that is resident in an economy other than that of the direct investor” (OECD, 2008, p. 48). The process may take the form of (Swierkocki, 2004, p. 93):
1. Acquisition of shares giving the right to manage a business,
2. Acquisition of all of the business,
3. Starting a business from scratch, including the purchase of real estate (known as a greenfield investment).
When starting a business from scratch a common business entity employed is a joint venture. This may involve the establishment of a new company in cooperation with a domestic operator. This solution is beneficial to both sides. The foreign partner profits from the domestic operator’s better knowledge of the target market and its institutional and legal environment. The domestic operator, in turn, may count on subsidies and the transfer of knowledge, technology and management methodology from the foreign partner.
Acquisitions include brownfield investments. They mostly consist of modernization of existing companies. The changes usually relate to production organization, assortment, machinery, and staff. Moreover, e.g. in Poland, foreign investors may open their branches based on the principle of reciprocity. In such instances, an entrepreneur may pursue economic activity only within the scope specified for its parent company (Official Journal of The Republic of Poland, 2013, art. 85.1-86).
Foreign entrepreneurs may also establish their representations abroad. However, the scope of their activities may cover only advertising and promotion of a foreign business (Official Journal of the Republic of Poland, 2013, art. 93-94).
A transaction in a host country is considered a FDI when it entails investment in a company’s equity. FDI also covers subsequent capital flows between a parent company and the direct investment enterprise, such as reinvesting profits, net purchases of shares in the company and/or debt instruments by the direct investor, and internal borrowings from the direct investor. In addition, the involvement of a foreign investor in the domestic company may consist of membership in the Supervisory Board, involvement in management, in-kind transactions between companies, replacement of management staff, making knowledge and technology available, and granting long-term loans on terms more favourable terms than those offered on the market. The usual threshold that allows a particular investment to be classified as FDI is ownership by the foreign investor of at least 10% of stock or shares of the direct investment enterprise (Klysik-Uryszek, 2011, pp.
16-17; OECD, 2008).Hence FDI is a much more complex phenomenon that just capital flow itself. Establishing a multinational business entails, e.g., opening branches abroad, technology transfer, production organization, and ensuring appropriate labour resources, including management staff. FDI should be distinguished from Foreign portfolio investments, which are capital flows that consist of the acquisition of foreign financial instruments, e.g. stock, bonds, deposits by residents of another country etc.
As already indicated, the assessment of the significance of FDI to the global economy has been the subject of many studies and analyses. Their conclusions, depending on internal and external circumstances, are not without ambiguity. There is one point, however, where all the authors agree: FDI plays an important role (positive or negative) in the global economy. The importance of an investment may be measured by the size of flows, i.e. with the value of an investment in subsequent years, and by their overall value, i.e. the sum of amounts cumulated in a specific period (Swierkocki, 2004, p. 93).
Motives and Determinants of FDI Inflow to a Country (Region)
In recent decades, the development of economic activity of multinational companies has prompted a great deal of research concerning the motivation behind the inflow of foreign direct investment. FDI is considered one ofthe most important stimulants of growth, which also provides support to an economy in times of stagnation. Thus studying foreign investors' motivations may be especially useful for public administration officials. A rich review ofthe theory and empirical studies devoted to reasons behind FDI inflow can be found in, e.g., Assuncao, Forte, Teixeira (2011).
Numerous theories of the 1960s sought to explain the determinants of FDI inflow. Some of them were based on microeconomic factors, such as organizational aspects, cost reduction, and economies of scale. Others related to macroeconomics, e.g., availability and allocation of resources, barriers to entry, political stability, market size, etc. (Dunning, Lundan 2008; Faeth, 2009).
The first studies of the premises for FDI, based on models by Heckscher-Ohlin (1933), MacDougall (1960) and Kemp (1964), referred to the benefits from operation on a foreign market resulting from e.g., lower cost of labour and reduced transaction risk. The theory of internalization was initiated by Buckley and Casson, who pointed out that companies decide to invest abroad when transaction costs are higher than the costs of internalization in the host country (Faeth, 2009; Assuncao, Forte, Teixeira, 2011).
However, the most comprehensive approach was proposed by Dunning (eclectic theory/OLI paradigm), who linked internalization with traditional trade theory and classified the benefits attained by companies as a result of the internationalization of economic operations. Undoubtedly, Dunning’s main contribution to the theory of economics is the listing of various theories and concepts as well as variables relating to ownership, location and internalization which determine the international activities of companies (Dunning, Lundan, 2008). Factors which belong to the OLI model are most often analyzed as FDI location determinants: infrastructure, human capital, economic stability, and production costs. Also institutional factors are taken into account (corruption, political stability, quality of public institutions, and tax and financial incentives) and factors resulting from the new trade theory (market size, market growth, openness of the economy and factor endowments) (Assuncao, Forte, Teixeira, 2011).
In fact, entrepreneurs, when making decisions on foreign investment, are guided by an array of factors. Obviously, above all, they wish to improve the economic performance of their companies and to strengthen their position on the international market. This means economic factors are the main reasons for FDI. Specific location is selected based mostly on the domestic market potential (possibly including the potential of neighbouring markets or of the market of an integration group as well) and on demand-specific factors. Investors analyze e.g. the size and structure of a particular market, per capita income, consumer preferences, and soft and hard infrastructure. The growth rate of the host economy is also relevant - Mottaleb (2007) and Busse and Hefeker (2007) list it as an important determinant of FDI inflow. Market size is especially important for the so-called market-seeking FDI undertaken with a view to gain access to the local market and to circumvent barriers protecting the market.
Not all of FDI, however, is motivated by the wish to enter a particular market. Direct investors also want to find a location which will ensure access to specific resources unavailable in their countries (regions) of origin. These resources may also be cheaper or better in the host country. Here we have in mind mainly raw materials, labour, and production capacity. Often investors want to improve the international competitiveness of their companies, and sales on the domestic market are less of a motivation.
Human resources and social capital, R&D potential, innovation, institutional framework, territorial forms of production organization (clusters), and other intangible assets are also important determinants of FDI inflow. These are typical of better developed areas and may be attractive for more advanced types of economic operations. Some of them may be generated or supported by national, regional and local authorities, which can influence the investment attractiveness of an area in question.
The wish to rationalize costs by consolidating production, benefiting from more favourable regulations (e.g. tax and labour laws) and gaining access to a bigger market of a regional integration group are also among the reasons for a foreign investment in a particular location (Kiysik-Uryszek, 2011, pp. 18-19). Bevan and Estrin (2004) demonstrated that the mere prospect of EU accession of the countries of Central and Eastern Europe was an important determinant of FDI inflow. Similar conclusions were reached by Egger and Pfaffermayr (2002), who showed that the prospects for changes in an integration group, be it in qualitative terms (e.g., intensification of integration) or resulting from the accession of new countries, impacts FDI inflow.
Foreign investors are also motivated by legal and institutional premises, such as (Klysik- Uryszek, 2011, pp. 20-21):
1. Economic, political and social stability, security, and predictability of legal and administrative regulations;
2. Tax policy, State aid, including investment incentives and allowances;
3. Regulations concerning market entry, operations, and protection of competition;
4. Efficiency of state administration and institutions involved in the business environment (the so-called ‘business climate’).
Depending on the type of activity pursued, infrastructure in the region may also be a determinant for a location decision. Investors may consider various types of infrastructure: telecommunication, transport, but also social infrastructure including health, education, sports and leisure, or culture. All of these are elements of the overall assessment of the investment climate of a country (region), which serves as the basis for the location decision for an FDI and its future continuation.
The motives most often listed in the literature are confirmed in empirical studies conducted, inter alia, in the countries of the Visegrad Group. One example may be the 2010 direct study of a sample of companies with foreign capital conducted in Poland at the regional level (Dorozynski, Urbaniak, 2011). The sample studied was representative - it included companies of different sizes, with differentiated involvement of foreign capital, types of operations and geographical structure of sales. The results to a large extent confirmed theoretical considerations, but also have a practical dimension as they identify issues to be taken care of by the public administration responsible for the policy vis-a-vis foreign investors.
According to the foreign investors surveyed, the most important motives for FDI location in Poland were connected with the availability of labour with appropriate skills. Other important reasons for FDI location included low costs and wages and the availability of the required qualifications. Favourable geographical location also strongly motivated investors, who expected income from sales on the internal market, interpreted here as also encompassing the EU market. The most discouraging factors were poor transport and social infrastructure and red tape, i.e. the protracted administrative procedures and incompetence of administration officials. However, the problems were not so big as to cause foreign investors to resign from their location decisions.
A review of the literature on the motives for FDI location shows it depends on many factors connected with the particular circumstances of the investing enterprises and the development level of the host country. In most cases, however, resource- and market-related determinants prevail. The former are connected with the wish to find better and cheaper production factors; the latter are focused on increasing or maintaining sales.
Benefits and Costs of FDI in the Host Country
As stated earlier, the impact of FDI on the host country is ambiguous. The economic changes implicated by the entry of foreign economic operators are of interest to many market actors and economists dealing with developmental subjects. FDI consequences for the economy can be observed at various levels. It is often the case that positive changes in one or more areas are accompanied by unfavourable changes in other areas. Generally, however, it is assumed that FDI-related benefits offset the undesirable effects and provide a positive impulse to the economy of the country and region in which they are located. However, there are some of studies which question this thesis.
Due to the complexity of FDI’s effects on the economy, we usually take into account only some key areas over time - those most sensitive to the impact exerted by investors and the best reflecting the economic situation of regions where FDI is located (Kiysik-Uryszek, 2010, pp. 79-80). In most cases the effects are changes in production, GDP (Fortanier, 2007), the productivity of production factors (Haskel, Pereira & Slaughter, 2007), quantitative and qualitative changes on the labour market, changes in competition, innovation, and dissemination of knowledge and technological progress (Kathuria, 2000).
Many works provide examples confirming that FDI inflow acts as an impulse for regional development. Since Keynes it has been known that business cycles depend on the changes in investment rates and in the capital intensity of investment (Harrod, 1939; Domar, 1946). This thesis is the starting point for models where growth is a variable, dependent on increased capital supply. According to Rostow (1971), author of the idea of economic convergence, countries with insufficient capital resources may make their growth more dynamic by attracting foreign direct investment. These theories remain up-to-date. The key change which occurred since they were put forward is that at present global investors are not only American, Japanese and West European holdings, but also companies from Arab and Asian countries, which were mostly established as a result of redeployment of the production equipment of huge corporations.
Theories of economic development provided the background for concepts linking FDI inflow with economic development. Japanese economists were particularly committed to the subject and made several attempts to explain it, e.g. Ozawa, Fukuchi, Oguchi, Yoon, etc. (Nytko, 2009). These models are similar, yet only Ozawa’s model of economic development stages was broadly disseminated throughout the world (Ozawa, 1992). Based on theories of economics and the experiences of Asian countries, in particular Japan, the countries of South-East Asia and Latin America, Ozawa observed that they developed successfully by opening up their economies to the external world. That contributed to the creation of a favourable climate for multinational corporations to transfer their operations to these countries, allowing local companies to absorb modern management, production and marketing solutions, all of which taken together helped modernize their economies. Thus, the general conclusion may be that FDI development changes the structure of the economy, with daughter companies supporting the emergence of comparative advantages in international trade and impacting on ownership advantages of local companies, as a result of which they may operate on foreign markets. The perspective of an improved position on international markets for the less developed countries, created by innovations flowing with and from FDI, is also demonstrated by Akamatsu (1962) in his “flying geese” model.
A large portion of the studies demonstrating the impact of FDI on the host country focus on the analysis of developing countries (Aitken & Harrison, 1999; Nunnenkamp, 2002; Sumner, 2005), mainly the so-called emerging markets (Whitman, 1999; Report of the Working Group of the Capital Markets Consultative Group, 2003; Zhang, Li, Li & Zhou, 2010; Globerman, Shapiro&Tang, 2004; Hailu, 2010). There are much fewer studies devoted to the highly developed countries (Lipsey, 2000). As most of them point to positive effects of FDI inflow into economies and regions, many countries offer attractive conditions to foreign investment, treating it as a transfer medium for scientific and technological progress and an economic development factor. This is confirmed by the examples of South Korea, Taiwan, Singapore, and Malaysia. The positive effects of FDI for the economy of India has been described by Marwah & Klein (1998), and similar results were documented for China (Li, Liu & Rebelo, 1998) and Singapore (Lim & McAleer, 2002).
While the results of some studies, e.g., by Aitken & Harrison (1999) and Konings (2009) point out neutral or negative effects of FDI on the host country’s economy, according to Gorg & Greenway (2004) this is due to the fact that the positive effects of an investment are noticeable in the long-run and may not be captured in short-term analyses (which dominate in literature). Besides, multinational corporations may deliberately hide benefits of their investment from local competitors. It is also worth mentioning that the positive impact of FDI may be visible only in selected industries and “occur not horizontally (intra-industry) but vertically through relationships that are missed in conventional spillover studies” (Gorg & Greenway, 2004, p. 180).
The level and dynamics of GDP are often used as measures of FDI’s impact upon a given economy. Studies based on econometric models usually highlight the positive effects of FDI inflow when it comes to a host country’s GDP, independent of its development stage. In the work by Roy & Van Der Berg (2006) such effects are presented using the example of the U.S. economy. Analyses for countries of East Asia were conducted e.g. by Baharumshah & Thanoon (2006), for Malaysia - Karimi and Yusop (2009), and for India and China by Agrawal & Khan (2011). FDI promotes economic growth, but the scale of benefits additionally depends on other factors, e.g. trade policy regulations, workforce qualifications, and absorptive capabilities. Horizontal studies by Choe (2003) on a sample of 80 countries representing different development levels (e.g., Japan, countries of Western Europe, Africa, and Latin America) also demonstrate the influence of economic growth on attracting further FDI.
FDI also impacts the labour market, a phenomenon which has also been widely studied.1 Usually changes in the size of employment, wages, and “quality” of jobs are analyzed in this context. According to Cieslik (2003), the quantitative effects of FDI inflow depend on the structure and flexibility of the labour market. On one hand, foreign companies create new jobs but, on the other hand, they restrict the employment in the domestic sector by competing for access to capital with local operators. When wages are rigid and foreign companies invest in production which is more capital-intensive than the local one, financing it with domestic capital, employment in the host economy may decline. When FDI is financed completely with foreign capital or brings with it greenfield investments, employment may increase.
In the opinion of Klysik-Uryszek (2010), the effects of FDI inflow for the labour market in the host economy may be simultaneously positive and negative, and they materialize at three levels: quantitative, qualitative, and location-specific. The first level means e.g. increased net capital, which creates new jobs in local cooperating companies, but may push domestic competitors out of the market. Qualitative effects may mean higher wages and improved productivity resulting from the applied technology and better work organization, but may also bring with it the implementation of undesired employment practices (longer working hours, restrictions vis-a-vis trade union membership, etc.). Location-specific effects (of a regional dimension) may lead to the creation of new and better jobs (generating more value added) in regions of high unemployment, or it may contribute to the further concentration of economic activity in urban areas, which deepens regional imbalances (Klysik-Uryszek, 2010, p. 85).
There are studies in the literature showing that FDI raises the demand for skills in the host country. This means that local workers, prior to gaining employment in a multinational company, must participate in additional, costly training, unless they can take advantage of special training offered by corporations. These processes increase the resources of highly qualified workforce on the local market. Confirmation can be found in studies by Feenstra & Hanson (1997), who argue that U. S. FDI into Mexico contributed to rising Mexican demand for higher-skilled workers across both regions and industries. However, studies by Blonigen & Slaughter (2001) do not confirm the existence of a relationship between skill upgrading within
U.S. industries and either outward or inward FDI. Surely, however, FDI may result in skills upgrading on the local market, with domestic companies having to compete with the foreign companies, both in terms of knowledge and attracting skilled labour. According to Aitken, Harrison & Lipsey (1996) this provides an impulse to local companies to improve management efficiency and human resource quality, while knowledge transferred by workers facilitates reproducing organizational and management solutions, as well as imitating technologies and procedures of market leaders.
Some researchers are trying to prove that the presence of multinational corporations where employees receive higher wages may raise the wage rate in the domestic economy. Aitken, Harrison & Lipsey (1996) analyzed FDI’s impact on wages in domestic firms in Mexico, Venezuela and the US. They detected a positive impact of FDI on wages in domestic firms in the US, but in the remaining two countries the impact was negative,
i. e. the increasing presence of FDI in Venezuela and Mexico led to a reduction in wages paid by domestic firms. Girma, Greenaway & Wakelin (2001) studied the same effect with respect to the UK manufacturing sector, but they could not confirm that FDI impacts domestic wages in any way.
FDI may also have differing impacts on the productivity of domestic firms. A positive influence is due to the fact that skilled workforce, trained in corporations, may later decide to start their own businesses (Fosfuri, Motta & Ronde, 2001). Besides, foreign corporations may create demand for local inputs, increasing the specialization and efficiency of upstream and downstream activities and generating positive externalities for local industries (Markusen & Venables, 1999). On the other hand, the presence of multinational companies may adversely affect the productivity of local companies, which is especially visible in the short-term, or it may have no influence at all (Gorg & Greenaway, 2004).
Corporations may also monopolize local markets and draw demand away from domestic firms, causing them to cut production and reduce their efficiency (Aitken & Harrison 1999). Moreover, they may replace local suppliers with foreign ones, and thus negatively impact the regional economy (Lall 1978). Very interesting conclusions can be found in Siotis (1999). He reveals that FDI may be initiated by a company without any particular skills, in the hope of acquiring valuable skills from local firms. Effects of penetration may thus be absorbed not only by FDI firms, but also by the parent company in the country of origin. From the point of view of local firms, such FDI may be harmful as they capture competitive advantages.
Along with the flow of capital, foreign companies transfer technology by selling licenses, patents or technological solutions, and offering technical assistance, education or knowledge. Modern studies focus not only on the effects of technology transfer but also on its reasons and diffusion channels between economic entities. Technology transfer, its diffusion and promotion of innovation are definitely among the most desired benefits of FDI. Kokko (1992) identifies the following ways of technology transfer to the host country:
1. Demonstration effect - imitation;
2. Competition effect;
3. Effect of international relationships;
4. Effect of learning (subcontractors).
Multinational corporations are usually more often and more willingly invest in R&D than domestic entities. OECD data show that R&D outlays in corporations are substantial, even when compared with aggregate R&D expenditures of countries (OECD 2010, p. 121) and public funding of R&D in the business sector in a number of countries (OECD 2009, p. 120). Thus, we may conclude that R&D expenditures in a joint venture with foreign capital may influence the total R&D operations in the host country. It also happens that the fear of multinational corporations entering the domestic market increases R&D outlays in local companies (Aghion, Blundell, Griffith, Howitt & Prantl, 2009). Another benefit may be the “diffusion of information and knowledge to host country organizations. Potential receivers of this knowledge are domestic firms, universities, or research centres” (European Commission 2012, p. 8).
However, the technology transferred to new locations is not always the first/best technology. Older ‘mature’ technology may be transferred, already withdrawn from highly developed countries but still allowing for competitive advantage in a given location. The literature is dominated by the opinion that second-best technology may be more favourable for the host economy, as its assimilation is easier (Blomstrom & Kokko, 2003; Glass & Saggi, 1998).
FDI inflow makes the economy more competitive internally, better integrated with the international system, more open and perceived as more competitive (Kiysik-Uryszek, 2010). FDI inflow may also increase exports (Banga, 2006) and their diversification (Jayaweera, 2009), which will be visible mostly when investors export their products to international markets or when they buy in international markets. Corporations which exploit low costs of production in the host country may generate trade if FDI is designed to service the global market. Such conclusions can be found in Ekholm, Forslid & Markusen (2007), who see a clear link between FDI and the growth in exports, some of which may be to new markets or in new industries, thus also diversifying exports. Harding & Javorcik (2012) prove that FDI offers the potential for raising the quality of exports in developing countries. The research sample described in the publication included 105 countries in the period between 1984-2000. If local companies improve their productivity and become more competitive as a result of cooperation with other corporations, they may expand to foreign markets.
The review of the literature on FDI’s effects for the host country shows they may go in different directions, and are not always positive. They depend on a wide range of factors connected with the features of the investing company, the development stage of the host country, and the local environment. Thus we should be very cautious in assessing FDI effects and always consider circumstances specific to a given region and to the host country.
STRUCTURE OF FDI INFLOW IN THE VISEGRAD GROUP COUNTRIES
Direction of FDI in the World Economy
The dynamic increase in global FDI started in the mid-1980s. To date we have witnessed three breakdowns in its upward trend, connected with general slowdowns in global growth dynamics (Figure 1).
In 1985 less than USD 60 bn were invested all over the world, while in2000 the figure reached as much as USD 1.4 trln. At the beginning of the 21st century, global FDI was significantly reduced as a result of the global economic downturn, which was accompanied by lower investment activity of multinational corporations, but this trend reversed in2004. FDI flows from developed countries2 grew by roughly 40% on average from 2003 until the end of2007, supported by high economic growth in key host economies and strong corporate performance (Sauvant, Maschek & McAllister, 2009, p. 2).
Figure 1. Inward foreign direct investment flows from 1990 to 2012 (bn USD)
Source: UNCTADStat
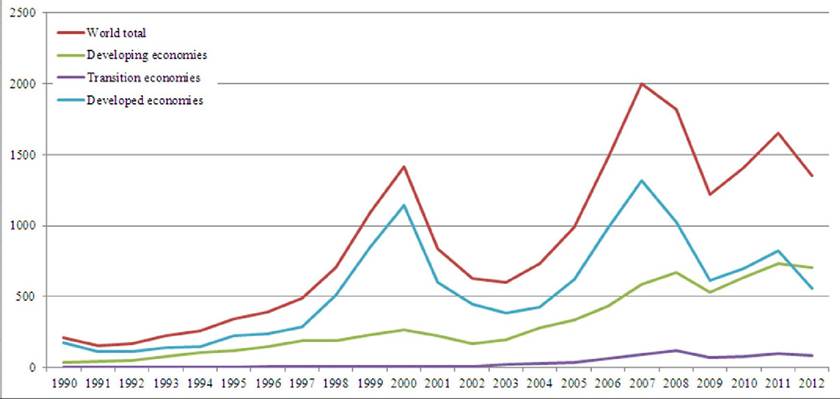
The year 2007 was the record-breaking year for FDI inflow, which reached USD 2 trln. The financial crisis, which began in 2008, visibly influenced international capital flows. FDI inflow dropped by 20% compared to the previous year, reaching even 33% declines in developed economies. In 2009 FDI was further reduced by 40%. The drop was caused mainly by the drastic decrease in mergers and acquisitions (by 2/3) and, to a lesser extent, by the reduced number of greenfield projects. In addition, terms of loans became more rigid and firms’ profits dropped, which significantly reduced their investment potential (Poulsen & Hufbauer, 2011, p. 2). For these reasons, many companies, mostly large multinational corporations, gave up or suspended their FDI projects. In many countries privatization was also stopped, e.g., Sweden, Kuwait, France, Mexico. Massive capital withdrawals were observed, and profits were repatriated instead of being reinvested. This trend was common and visible in many industries, starting from the extracting industry up to manufacturing and services.
The actual financial crisis emphasized the flexibility of the developing and transition economies to the current global economic situation (Carp, 2012, p. 39). The increased volume of FDI at the beginning of the crisis was reduced in 2008 by 16%, and in 2009 by about 21%. Clear changes could be noted in the hierarchy of beneficiaries and investors, mainly by raising the relative weight held by investors in developing and transition countries.
In 2012 FDI volume decreased by almost 1/5. The deepest drops were reported for developed economies, mainly in the EU. Declines were recorded in 22 out of 38 developed economies, including 16 European economies. FDI in this group dropped by 32%, to the lowest level in ten years. Almost all industries suffered from the crisis. The smallest declines were recorded in the manufacturing sector (food processing, tobacco, pharmaceuticals) and services for business, communication, transport, and logistics.
In 2012, for the first time ever the developing economies absorbed more FDI than developed countries. Nine developing economies and two transition economies ranked among the 20 largest recipients of FDI in the world (WIR, 2013). Among developing regions, FDI inflows to developing Asian countries fell by 6.7% as a result of decreases across major economies, including China, Hong Kong, India, the Republic of Korea, Saudi Arabia and Turkey. However, 2012 inflows to Asia are still high, accounting for 58% of FDI flows to developing countries. FDI to Latin America and the Caribbean decreased only slightly, by 2.2 per cent in 2012, and amounted to over 240 bn USD. Africa was a region that saw FDI inflows rise in 2012 to about USD 50 bn. Slightly smaller FDI inflows were experienced by the transition economies of South-East Europe and the Commonwealth of Independent States.
The global ranking of the largest FDI investors shows that investors from developing and transition economies have become very active in recent years and are willingly seeking new investment locations in the world. In 2012 two developing countries now rank among the five largest foreign investors in the world, with China was the world’s third largest investor, after the United States and Japan.
FDI Inflow Dynamics in the Visegrad Group Countries
Since the beginning of the 1990s, when the Visegrad Group countries opened up their economies, investors have been showing increasing interest in locating FDI in their territories. The Czech Republic, Poland, Slovakia, and Hungary are economically much further advanced than the majority of Central and East European countries.3 They were the first to launch systemic transformations and one of their top priorities in modernizing their economies was to attract as many operators with foreign capital as possible, and the highest possible volume of FDI (Figure 2).
Figure 2. Inward FDIflows to Visegrad Group countries, annually 1990-2012 (mln USD)
Source: UNCTADStat
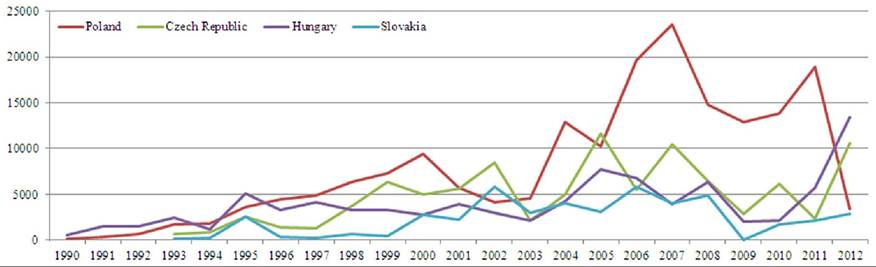
In the first years of transformation, Hungary received the most FDI, due to its more attractive legal framework compared to the other countries in the Group. Hungary was also the first to involve foreign investors to a great extent in the privatization process (Sass & Kalotay, 2012, p. 1). On top of that, labour was inexpensive in Hungary and the government was able to offer extremely attractive investment incentives. FDI inflow to other V4 countries, mainly to Poland, started when foreign operators were allowed to participate in privatization. Moreover, radical reforms and the size of the Polish market rapidly increased Poland’s attractiveness. Since 1996 Poland has systematically attracted more foreign capital than the remaining three countries and, with the exception of two years, regularly received the largest share of FDI inflows.
On the other hand, the Czech Republic and Hungary recorded declines in FDI inflows in mid- 1990s. In the Czech Republic this was caused by foreign exchange crisis in 1996. Little FDI inflow was yet noticeable in the Slovak territory until 1998 (with the exception of 1995). This was because the government had engaged in efforts to build the so-called Slovak capital community and refused to open Slovakia to foreign investment (Kucharcikova, 2013, p. 3). In the 1990s FDI volume in the countries of the Visegrad Group was also influenced by the competition of their economies, which had just started transformation, and the Russian crisis of 1998.
Nevertheless, in the period 1990-1999 the Czech Republic, Hungary, and Poland accounted for cumulated FDI inflows amounting to 79% of total FDI into Central and Eastern Europe. In the years 1995-2001 Poland was the single absolute largest recipient of inward FDI, with the Czech Republic being the next absolute largest recipient in all of the Central and Eastern Europe. However, Poland was far from being the most FDI-intensive host economy when nominal FDI flows are deflated by nominal GDP levels (Globerman, Shapiro & Tang, 2004, p. 7).
Data on the dynamics of annual FDI inflow to the countries of the Visegrad Group confirms the increased interest of foreign investors after they joined the EU. This indicates their competitive position improved as a result of EU accession. In Poland, the higher FDI volume was also the effect of lowering the fiscal burden of the corporate income tax, which encouraged investors to declare higher profits in their branches in Poland. While Poland was, as already mentioned, clearly the leader in the region, it should be noted that in 2002 and 2005 the Czech Republic attracted the most capital invested in the Visegrad Group.
Slovakia attracted the least FDI compared to other countries in the Group during the entire transformation period, with the exception of the years 1995, 2000 and2002. The main reasons were political developments in Slovakia, legislative barriers to entry, and a weak business environment (Fifekova & Hardy, 2010, p. 9). After 1999, FDI inflow intensified, but once the maj or privatization projects had taken place, it slowed down again.
In the second half of the first decade of the 21st century Poland was receiving the majority of investment capital in the CEE countries. The record-breaking year was 2007, when the inflow of foreign capital in Poland reached USD 23.5 bn. This was almost 80% higher than in2004, and over 15% higher than in 2006. In 2008 FDI in Poland dropped by over 37% compared to the preceding year, reflecting the trends on the global market. Such a substantial decrease in investment in Poland could suggest a deep regression with respect to the investment attractiveness of the country. We need to stress, however, that this happened a year after Poland’s FDI record-breaking result recorded in 2007, i.e. just before global economic crisis.
The negative impact of the crisis was overcome in Poland in 2011, but in 2012 FDI recorded a dramatic drop by over 82% compared to the previous year. This result was largely influenced by the scale of capital in transit,4 which in 2012 increased sevenfold globally. Disregarding capital in transit, Poland’s FDI inflow in 2012 would reflect the negative impact of crisis, but it would not be such a steep decline.
Since 2008 other Visegrad Group countries have also experienced serious consequences of the global recession. In Hungary reinvestment was significantly reduced, and other capital flows were negative as a result of the increase in reverse borrowings within companies and debt repayment from Hungarian branches to parent companies. FDI flows to Hungary were especially hard hit by the crisis years of 2009 and 2010, both in absolute terms and relative to flows to other countries, such as Poland and the Czech Republic. The 2011-2012 dataset indicates an increase in FDI inflows, however, according to Hungarian National Bank this is mainly due to a large capital in transit flow. A similar situation took place in the Czech Republic, where FDI increased four times in 2012 compared to 2011.
Summing up, since the beginning of transformation until 2012 almost 44% of all FDI directed to Visegrad Group countries was located in Poland, over 23% in the Czech Republic, over 21% in Hungary, and 11% in Slovakia. However, the value of FDI per capita has definitely been the highest in the Czech Republic throughout the entire period of 1990-2012.
Investors’ Geographic Origin
In analyzing the directions from which FDI flows into the Visegrad Group countries, initial stress should be paid to the very strong economic and trade ties of the region with other EU member states, in particular with the Economic and Monetary Union member states, (euro area, also known as the Eurozone). On average, about 70% of inward FDI in Poland, the Czech Republic, Slovakia, and Hungary comes from the euro area member states. The Baltic States are an exception in Central and Eastern Europe in this respect, as investments originating from euro area represent not more than 35% of the total incoming FDI. Becoming dependent upon one area, even an economically advanced region, may also have negative consequences. They may be particularly painful in times of economic crisis (Bialek, 2012).
Having stated the above, we may also note some differences in the origin of foreign capital in the form of FDI reaching the countries of the Visegrad Group. This is the outcome of the various determinants of investors’ interest, which have been summarily outlined in the first part of the Chapter.
The Czech economy offers a highly advanced technical infrastructure, skilled labour and a functioning market economy particularly strongly linked with the so-called “old” EU member states, also referred to as the EU-15. But strong trade relationships with the euro area slowed down economic growth in the Czech Republic in recent years. The authorities are trying to counteract the situation by improving Czech’s investment attractiveness by offering a wide array of incentives.
In the period 1993-2011 cumulated FDI inflow into Czech Republic was estimated at over EUR 77 bn. As of 31 December 2011, by the country of origin, the biggest share of foreign capital in the Czech economy originated from the Netherlands (27.4%), Germany (14.9%), and Austria (13.2%). Countries whose total outward FDI exceeded CZK 100 bn (approximately EUR 3.6 bn) also include Luxembourg, France, and Switzerland. The total share of EU-originating FDI investment amounted to 87.6%, with almost 92.5% from Europe in the broadest sense of the term. Hence only 7.5% of foreign capital investment was owned by investors from outside the Old Continent, mainly from the United States and Japan (Foreign Direct Investment in 2011, 2013).
In recent years Hungary has faced serious economic problems. The financial crisis had a strong impact upon the economic performance of the country. Cumulated FDI value at the end of 2011 was about EUR 70 bn. Over 70% originated from the EU, including about 22% from Germany. Similarly to all EU member states, investors from other countries of the Community, in particular from Germany, the Netherlands, Austria, Luxembourg, and France dominated FDI inflow to Hungary. Operators from outside of the EU also represented a substantial share, mainly those from the United States and, to a smaller extent, from South Korea and Japan.
The presence of investors from Central America is also an important aspect in Hungary. That might be the consequence of Hungarian investments in the region in previous years. In Hungary there are, e.g. investors from the construction (Cemex) and automotive (Nemak) industries. Hungary’s investment attractiveness was clearly enhanced by a variety of investment incentives addressed mainly to these industries. Besides direct subsidies and allowances, companies were attracted by industrial parks. In Hungary there are more than 200 such parks (Sass, Kalotay, 2012; Central Bank of Hungary, 2013).
Slovakia, despite being one of the smallest countries of Central and Eastern Europe, efficiently and quickly managed to cope with economic crisis. It provides a relatively attractive alternative to foreign investors with its low costs, investment incentives, and organizational support of the public administration. No doubt Slovakia’s membership in the euro area (since 2009) is also an advantage in the eyes of investors.
Cumulated FDI value for Slovakia in 2011 was almost EUR 40 bn. Data of the Slovak Investment and Trade development Agency (SARIO) indicates that FDI investment was distributed rather equally across the regions. With respect to the country of capital origin, the period 2002-2012 was clearly dominated by German investments (17%). Substantial shares were also recorded for investment projects from other EU member states (Denmark 6%, France 5%, United Kingdom 5%, the Netherlands 4%, Spain 4%, and Belgium 4%). Slovakia became also the location of non-EU capital, in particular from South Korea (12%) and from the United States (7%) (SARIO, 2012).
Considering its area, GDP, population and resources, Poland is the biggest economy in the Central and East European region. Its successful transformation, large domestic market, relatively low cost of a highly skilled workforce and management staff, and rich catalogue of incentives make Poland the unquestionable leader in attracting and maintaining FDI in the region. The value of cumulated FDI inflow to Poland in the years 1994-2011 exceeded EUR 139 bn.
From the point of view of invested capital, the Netherlands is at the top of the list of foreign investors in Poland. The value of cumulated Dutch investment at the end of 2011 was EUR 26.8 bn. Subsequent runners-up are investors from Germany (EUR 20.4 bn), France (EUR 18.7 bn), Luxembourg (EUR 13.1bn), and the U.S. (EUR 9.3 bn) (Biaiek, 2012).
In 2011 the largest FDI flow originated from Luxembourg (EUR4,542 mln), Spain (EUR 4,318 mln), Germany (EUR 3,592 mln), and Sweden (EUR 2,617 mln). There were also cases of divestment, i.e. investors’ withdrawals from Poland. These investors were mostly Irish (EUR -2,946 mln) and Swiss (EUR -2,424 mln) (NBP, 2012).
Structure of FDI Flows
As was the case with the origin of capital, the structure of FDI flows to the Visegrad Group countries is similar throughout the group. In all the countries investors from the automotive, electronics, and machinery industries played an important role. However, more in-depth analysis of FDI inflows to individual countries of the Group reveals some differences and specializations in the host countries.
In Poland, like in other Visegrad Group countries, firms with foreign capital are gaining in importance in the economy. Today it is hard to imagine many sectors of the economy without foreign investors, with their knowledge, organization, technology, and capital. This is clearly visible in automotive industry, and in electronics and domestic appliances.
In 2011 there were almost 25,000 economic entities with foreign capital operating in Poland, nearly 8% more than in 2010. In terms of legal arrangements, the group was dominated by limited liability companies (93.1%). Joint stock companies ranked second, but their share was only 3.8%. In 2011 more than 1,500 new entities were established (approximately 200 more than in the preceding year). The majority of new businesses dealt with trade and repairs of motor vehicles (440). New projects were mostly greenfield investments (80%).
From the point of view of the size of the businesses invested in, more than 84% were small firms (up to 49 employees), including 66% micro-businesses (employing up to 9 people). The smallest group, less than 5%, was comprised of big companies (employing over 250 people). The majority of businesses (almost 2/3) dealt with the trade and repair of motor vehicles (28.0%), industrial processing (20.1%), the real estate market (9.5%), and construction (9.2%). At the end of 2011 companies with foreign capital employed 1,566,500 people, an increase of 3.2% more compared to 2010.
In 2011, as many as 10,108 companies with foreign capital exported their products or goods and materials. They represented 40.6% ofthe total number of businesses with foreign capital (41.1% in 2010). Exports to the parent company or to related entities in a capital holding or in a group of companies to which a given entity belongs (so called intra-group exports) accounted for 41.7% of total exports by these companies in 2011 (a decline of 5.6%). Exports to parent companies or related entities prevailed among the manufacturing entities - 83.8%.
In 2011 as many as 46.1% of businesses with foreign capital reported outlays for the purchase of fixed assets in Poland (47.7% in 2010). Their value was PLN 73,704.4 mln, an increase of 19.6% compared to the same value for 2010. The largest amounts were invested by businesses in the manufacturing sector (35.1% of outlays for fixed assets made by all entities with foreign capital), companies dealing with trade and repair of motor vehicles (11.6%), and information and communication (10.4%) (GUS, 2012).
Many foreign investors operating in Poland represent leading multinational corporations. The scope of this publication does not allow to list even a small portion of the largest ones. By way of example however we will mention Amcor Ltd, Strabag, Toyota, France Telecom, Hutchinson, Dell, Peugeot, BSH Bosch und Siemens Hausger- ate, IBM, Metro Group AG, Siemens, Volkswagen, FIAT, Indesit, Fujitsu, and Philips (PAIiIZ, 2013).
The two recent decades witnessed a major change in FDI structure in Hungary. At the beginning of the 1990s, direct investments focused predominantly on manufacturing. Then the importance of this sector gradually decreased. In 2000 its share was still significant and accounted for 47% of all FDI in Hungary. The role of manufacturing continued to decrease to the level oscillating around 25% in 2009, then increased to 30% in 2010. Transport and electric engineering were the most important investment destinations within the manufacturing sector. On the other hand, services have gained in importance in the structure of FDI in Hungary over the last 20 years, in particular wholesale and retail trade, repairs, real estate, IT and business services.
The largest investment projects in Hungary can be divided into two groups. The first includes affiliates of multinational corporations, such as Audi, Nokia, GE, Samsung, Philips, E.ON, Deutsche Telekom (M-Telekom), and Fibria Cellulose. The second group consists of former Hungarian state- owned enterprises privatized through public offers on the stock exchange, where at present a number of majority shareholders are foreign investors, e.g. MOL, OTP Bank, and Richter.
Some sectors of the Hungarian economy, especially manufacturing and services, are dominated by entities with foreign capital. When it comes to vehicles, Hungary is the host country for such renowned global corporations as Japanese Suzuki and German Audi. In 2012 a new plant of German automotive-holding Daimler AG launched production in Hungary. Other automotive corporations, such as American General Motors’ and German Opel, specializing in spare parts, also enjoy a substantial share in the Hungarian market. It is also worth mentioning top class German manufacturers of vehicle systems, such as Knorr-Bremse (braking systems) or Robert Bosch (spare parts and accessories).
In Hungary there are also many global leaders in the electronics industry, e.g. American National Instruments, Jabil, and GE, Flextronics from Singapore, Foxconn from Taiwan, Dutch Philips, South-Korean Samsung, German Siemens, and Finnish Nokia.
Leaders in the service sector comprise multinational financial and telecommunication corporations. An example may be MKB bank, with German BayerischeLandesbank as its major shareholder, and CIB Bank owned by Italian IntesaSanpaoloSpA. On the telecommunications market in Hungary one may find, e.g., M-Telekom owned by the German giant Deutsche Telekom and an affiliate of Norwegian Telenor. Operators with foreign capital also have a big share in Hungarian retail trade, with the leading corporations in this area including French Auchan, Cora from Belgium, British Tesco, and German Lidl (Sass, Kolotay, 2012).
In Slovakia the majority of FDI was attracted by the automotive industry, with plants opened by Volkswagen, KIA Motors, and PSA Peugeot Citroen. Investors from the electronics industry are also interested in Slovakia. It is a host country for FDI by Sony, Samsung, Panasonic, and AU Optronics.
Foreign investors have also located their capital in other industries in the Slovak economy, e.g. in machine-building and chemical industries and in telecommunication services. The list of key foreign investors in Slovakia should be supplemented with e.g. U.S. Steel, Whirlpool, IBM, HP, DELL, Siemens, Alcatel, Foxconn, and Soitron (Bialek, 2012, SARIO, 2012).
Currently in the Czech Republic there are more than 173,000 businesses with foreign capital. Like in other Visegrad Group countries, the first period after transformation was dominated by investments in manufacturing. Modernization of the economy, upgrading of infrastructure, and human resource development have turned the Czech Republic into an attractive investment location also for services and R&D centres.
According to the Investment and Business Development Agency (CzechInvest), there are at least several industries in the Czech economy where FDI inflows are constantly increasing. As has been mentioned, knowledge-based industries and advanced technologies are among them. These are mostly telecommunication, business support services, aviation, the automotive industry, machine engineering, equipment and tools, natural sciences, electric engineering and electronics, renewable energy, and nanotechnologies.
Among the over 173,000 businesses with foreign capital in the Czech Republic, the biggest companies are ABB, Continental, DANONE, Ford, Panasonic, Nestle, IBM, DHL, Astra Zeneca, Rockwell, Procter & Gamble, Renault, Siemens, Lufthansa, Honeywell, and Volkswagen (Czech- Invest, 2013; Czech National Bank, 2013).
INVESTMENT ATTRACTIVENESS
Assessment in the Light of Selected Rankings
When analyzing the results of leading international rankings, we may conclude that over the last several years, including the times of crisis and economic downturn, Visegrad Group countries have remained an attractive investment location.
According to The Global Competitiveness Report 2012-20135 Poland and Hungary are in transition from economies driven by increasing productivity to innovation-driven economies. The Czech Republic and Slovakia are considered innovation-driven economies. (The Global Competitiveness Report 2012-2013, 2012, p. 10). Between 2004-2012 only Poland markedly improved in the Global Competitiveness Index ranking from 60 to 41, Czech Republic remained stable (+1). Slovakia (-28) and Hungary (-21) lost substantially. From among the countries of the Visegrad Group, the highest ranking positions in the competitiveness ranking6 in 2012-2013 are occupied by the Czech Republic and Poland, 39th and 41st respectively, while Hungary and Slovakia rank 60th and 71st respectively (The Global Competitiveness Report 2012-2013, 2012, p. 14). This means the economic transformation has brought concrete measurable results, as these countries have managed to achieve higher efficiency in many industries and improve the investment attractiveness of the region. At present, the areas where FDI is expected in these countries are creative industries, strategic services, and R&D.
When analyzing the factors determining the intensity of FDI inflow to Central and Eastern Europe in the years 1996-2010, Mateev & Tsekov (2012) demonstrate that the primary advantages of these countries are low taxes (Czech Republic) and the competitive cost of labour (Slovakia). However, individual countries differ in geopolitical, economic, and cultural terms, hence there are factors which distinguish them from one another, and methods of attracting foreign capital by offering, e.g. well developed infrastructure or establishing special economic zones.
According to the World Bank's Doing Business 2013 report the “economies in Central and Eastern Europe have received large inflows of FDI over the past couple of decades because they are seen as entry points into the huge European market and also because they have relatively well-educated labour forces.” (2013, p. 49). Macroeconomic forecasts suggest Central Europe will continue to be the fastest growing region in the European Union. Another advantage of these countries consists in their skilful combination of emerging markets with the stability of developed economies.
Studies by Ernst & Young show that, in the opinion of 49% of interviewed investors, in the years to come Central and Eastern Europe will be the most attractive investment spot globally. (E&Y attractiveness survey, Europe, 2013, p. 8). Investors even ranked CEE ahead of Brazil, Russia and India. Countries of the Visegrad Group are the most popular among the countries of the CEE region. Stability, predictability, and a well educated labour force are the location selection criteria most often taken into consideration in the times of recovery. Half of interviewed multinationals also pointed to the cost of labour as a basic element of investment decisions. In this area as well the Visegrad Group countries, despite increases in salaries and wages, remain attractive to foreign investors. It suffices to say that annual wages in Poland, Hungary and the Czech Republic remain, on average, half of those in Germany, France or the UK (Eurostat, July 2013).
According to E&Y, in 2012 Poland and the Czech Republic combined accounted for 5.8% of all FDI projects globally (2013, p. 15). In addition, Poland was the top improver globally, according to the World Bank’s Doing Business 2013 report, because it has won attention as the fastest growing EU member since 2008, and benefits from a skilled native and migrant workforce. (Doing Business 2013, 2013).
Poland is also a leader according to UNCTAD when it comes to investment attractiveness. Its major competitive advantages are a large and rapidly developing internal market, an educated and flexible workforce, stable banking system, access to international local markets, and the availability of suppliers and partners. Most probably the above mentioned factors gave Poland, as the only member of the Visegrad Group, a place in the group of the top 15 attractive FDI locations in recent years. (World Investment Report, 2010, 2011, 2012, 2013).
Poland is also the only country among the Visegrad Group members included in the basket of 25 countries covered by the FDI Confidence Index.7 It occupied its highest ranking position, sixth, in 2010, while in 2012 and 2013 ranked 23rd and 19th, respectively (2013, p. 3). The report by A.T. Kearney stresses that Poland is particularly strong in automotive components and vehicle assembly, and is seeing increased activity around its newly built highways. Besides, Poland “is also seeing more knowledge-centered investments, thanks to a large student population, a breadth of language talent, and an EU grant scheme to support such investments” (A.T. Kearney 2013 FDI Confidence Index, 2013, p. 22).
The Visegrad Group countries also occupy high positions in the ranking published in 2013 by Foreign Policy magazine. Its B aseline Profitability Index (BPI) is intended to be an overall guide for all foreign investors and is based on three factors: asset growth, preservation of value, and repatriation of capital. In the BPI ranking Poland is 18th among the most attractive countries in which to invest, while the Czech Republic ranks 22nd, Slovakia 28th, and Hungary 37th.
System of Investment Incentives
The system of investment incentives in place significantly impacts the investment climate in a given economy. It also contributes to increased attractiveness of the host country. Support is most often coordinated by a specialized agency and includes all sorts of tax allowances, favourable settlement rules for investment projects, and also direct subsidies for investors.
Although foreign investors often perceive the CEE as a single area, the countries in the region differ rather substantially with respect to their economic accomplishments, FDI absorption capacity, and their approaches to investment incentives (all of course in line with the EU acquis communautaire). Poland and the Czech Republic can be proud of their successes in attracting foreign capital. In the period 2000-2012 cumulated FDI inflow into both countries was the highest in the CEE; it exceeded USD 154 bn in Poland and USD 82 bn in the Czech Republic.
The whole Central and East European region is situated in the centre of the pan-European market, and each of the four countries of the Visegrad Group has its own particular geographical mer- its.8 Considering not only the location but, first of all, market determinants, Poland is very well positioned, having definitely the biggest market in the region. It is also economically stable, with a good availability of workforce. However, conditions for running a business in Poland are assessed lower than in the remaining Visegrad Group countries. The Czech Republic has the best air transport connections in the region. The advantages offered by Hungary include a relatively well-developed infrastructure and high quality of human resources. In Slovakia costs are the lowest and it may become the primary destination of service investments. All countries of Visegrad Group constantly improve their business environment and investors may expect direct support from local and regional authorities.
Poland also offers a wide range of incentives for FDI proj ects. Investors may benefit from multiannual support programs, subsidies, real estate tax allowances, or special economic zones. The Ministry of Economy manages a special program9 designed to enhance innovation and competitiveness in the Polish economy. Its main aim is attracting and supporting FDI in sectors referred to by the OECD as hi-tech sectors.10 Support is offered only to investors who plan to invest in the following priority industries: automotive, electronics, aviation, biotechnology, modern services, and R&D. The system provides investment support for the cost of creating new jobs (non-refundable employment subsidies) and eligible costs of the new investment (non-refundable investment subsidies).
In Poland there are also 14 special economic zones, and several dozen technology and industrial parks. The latter have become a popular tool for supporting local and regional development through entrepreneurship and innovation support schemes, which establish the framework for cooperation between public administration, businesses, and research centres. Finally, Poland is the largest beneficiary of EU structural funds from among the countries of Central and Eastern Europe. Its cohesion policy budget for the years 2007-2013 exceeded EUR 67 bn. Currently, ongoing discussions concern the new financial perspective for 2014-2020. A major part will be dedicated to companies, with the Polish Information and Foreign Investment Agency (PIFIA), together with local and regional authorities, entrusted with the task of seeking and supporting foreign investors. All these institutions should provide concrete and coherent information to allow an investor to tailor his or her position to ensure that he or she receives the maximum amount of incentives available.
Foreign investors are attracted to the Czech Republic by a rich offer of financial incentives financed with public resources. Investment projects are supported by the Czech government via the CzechInvest agency, and (similar to other EU member states) the assistance may not exceed the amount specified in the regional map of State aid intensity. The ceiling depends on the region where an investment project is taking place. A large portion of the assistance is directed to manufacturing projects. Support consists in, e.g., granting full or partial tax allowances (up to five years of full corporate tax relief for newly established legal entities, and partial corporate tax relief for the expansion of existing production), subsidizing new jobs (up to 2,000 EUR annually for each newly created job), subsidies for training and retraining, and also site support (transferring public land at a favourable price). Incentives are also available for developing export-oriented industries representing high value added.
Since July 2012, when the Act on Investment Incentives was amended, State aid has been expanded to cover technology centres and business support services. Support is available for investment in research, development, and innovation (technology centres) and strategic services centres. The latter are units dealing with selected operations by companies, closely linked with IT technologies and having clear international orientation, e.g., IT software development centres or expert and task-specific ICT centres. On top of that, the Ministry of Industry and Trade launched the program Entrepreneurship and Innovation, which covers 15 various assistance programs and offers, e.g., non-refundable subsidies, preferential loans and guarantees. Similarly to Poland, the Czech Republic receives structural funds under the EU cohesion policy.
In Hungary there are also some instruments providing incentives to investors. These include all sorts of cash subsidies, tax allowances (including 80% reduction of the corporate income tax), low-interest loans, and land available either free of charge or at reduced prices. The main types of cash incentives related to investments focus on the delivery of an investment project (e.g. purchasing assets, construction works, etc.), creating new jobs and training employees. The Hungarian Government provides a negotiation-based “VIP” subsidy opportunity for investments greater than EUR 10 million with a fixed number of newly created jobs, depending on the purpose and location of the investment. There is also the possibility to subsidize a project from available EU Funds.
In Hungary, priority is given to FDI aimed at the development of the economy, employment, transport, human resources, health and wellness services, environment and energy, public services and the regions. Investors may choose from more than 200 industrial parks, which facilitate the establishment and operation of a business, and offer the support of local authorities, tax allowances, and preferential conditions.
The typical services specifically provided by industrial parks in Hungary include: the provision of basic infrastructure for production (e.g. energy, water and waste-water treatment facilities) and a wide range of other quality services (e.g. banking services, customs administration, consultancy, security guards and office services).The institution entrusted with the task of promoting foreign investment and bilateral trade, as well as assisting EU integration-oriented development of SMEs, is the Hungarian Investment and Trade Agency (HITA).
The last on our list of analyzed countries, Slovakia, also offers a transparent system of incentives. State aid and investment incentives vary and depend on four categories of projects that can be supported: industrial production, technological centres, shared service centres, and tourism. Support is available to investors starting new businesses as well as to those expanding existing initiatives. For each category of projects, there are specific conditions which must be met in order to apply for investment incentives. Incentives consist of, e.g. subsidizing the acquisition of material and immaterial assets, income tax relief, a contribution for new jobs created, and transfer or exchange of real property at a price lower than the general asset value. State aid is available up to 50% of investment and the minimum invested amount depends on the unemployment rate in a given location (it can be even as much as EUR 14 mln).
Recently Slovakia initiated support for the R&D sector by offering a wide array of public subsidies, incentives and programs which have encouraged many investors to transfer their technology and research centres to Slovakia. The first contact point for investors is SARIO. Among its many responsibilities, the most important deal with providing investors with initial information and assistance with their investment.
Special Economic Zones as a Tool to Attract Foreign Investors
Special economic zones, or so-called free trade zones, operate in several countries in Central and Eastern Europe (Romania, Estonia, Latvia, and Lithuania). From among the Visegrad Group countries they operate only in Poland. For this reason below we shall discuss the specificity of Polish special economic zones. Special economic zones (SEZs) are one of many tools designed to attract foreign investors and increase the investment attractiveness of the host country or region
Pursuant to Polish law, a special economic zone is an uninhabited, distinguished territory, where businesses may operate on terms laid down in the law (Ustawa, 1994). A zone may be established to stimulate economic development of a part of the country’s territory, in particular by (Ustawa, 1994, Art. 3):
1. Developing specific areas of business activity,
2. Developing new technical and technological solutions and the application thereof in the national economy,
3. Developing exports,
4. Increasing the competitiveness of products and services,
5. Utilizing existing industrial assets and economic infrastructure,
6. Creating new jobs,
7. Utilizing available natural resources in a sustainable and environmentally friendly way.
At present in Poland there are 14 SEZs. As of the end of June 2012, almost 1,500 permits were issued to operators to run businesses in these zones. These entrepreneurs invested almost PLN 82 bn (approximately EUR 20 bn) and employed more than 240,000 people. The main incentives for locating a business in a SEZ include preferential operational terms, developed investment plots, and qualified staff (Special Economic Zones, 2012).
Preferential terms mean the availability of State aid. In the case of SEZs, State aid may be granted in accordance with regulations which specify its allowable intensity for a given area. The aid takes the form of corporate income tax allowance and real estate tax allowances. Allowances and relief are available to entrepreneurs up to 2020 when, pursuant to the amended Act on SEZs, the zones will cease to exist under the current arrangements.
Recent years have witnessed the stabilization and further development of SEZs in Poland. In 2011, 188 permits were issued, an increase of 6% compared to 2010. The most permits were issued in the Kostrzyn-Slubice and Lodz SEZs - 22 each. With respect to investment outlays, in 2011 a slight decrease was recorded (by 3%) compared to the preceding year. Statistics were better for the labour market. In 2011 the number of people employed in SEZs exceeded 240,000 and increased by 7% compared to 2010. In absolute numbers, the zone in Katowice has the highest employment (ca. 48,500), followed by the SEZ in Walbrzych (ca. 31,200), Tarnobrzeg (ca. 28,700), and Lodz (ca. 24,800).
Special economic zones are open to both domestic and foreign investment projects. Ministry of Economy data shows that entities with foreign capital play an important role as sources of investment expenditure in all of the 14 special economic zones. As at 31 December 2010, the total investment outlays amounted to over PLN 73 bn (approx. EUR 17.3 bn), and only 17.3% consisted of Polish capital. In the group of foreign investors, German businesses accounted for the largest share of investment. By the end of 2010 it reached almost PLN 12 bn (approx. EUR 3 bn), i.e., 16.3% of total investment outlays in all the 14 zones. In terms of value, the largest investments were recorded in the Legnica and Lodz Special economic zones. German investors were followed by American (11.5%), Japanese (9.7%), Dutch (9.5%), and Italian (8.5%) business entities. In all the SEZs, the share of EU-based capital was ca. 44% (Ministry of Economy, 2010).
It is worth stressing that SEZs in Poland score high against other similar zones in the world. In the ranking of FDI Magazine, which lists the 50 top special economic zones in the world, five were SEZs from Poland: the SEZ in Katowice ranked 11th, in Lodz 18th, in Walbrzych 22nd, in Pomorska 35th, and in Starachowice 37th. The ranking was dominated by SEZs from the Middle East (23 out of 50), mainly from United Arab Emirates (14), although the zones from Central and Eastern Europe were also noted. They were recognized mostly for good quality infrastructure and well developed networks (www.fdiintelli- gence.com, 2013).
Special economic zones seem to be a specific location advantage of Poland compared to other Central and Eastern Europe countries, including the Visegrad Group countries. The operational scale and legal framework offered to investors in Poland have not been reproduced in any other country in the CEE region. Slightly similar arrangements, although on a smaller scale, are available only in Lithuania and Latvia. Estonia and Romania offer access to selected duty free areas. Neither in Bulgaria nor in any other Visegrad Group country can we find specific areas that operate similarly to SEZs. This does not mean, of course, that those countries do not have any investors’ support schemes involving State aid. On the contrary, as has been mentioned above, e.g., Czechs grant tax allowances depending on the region and volume of investment expenditure.
Investment Barriers
One of the main obstacles facing investors wishing to pursue economic operations in the Visegrad Group countries is public administration and red tape. The numerous documents and procedures that must be filled out and complied with to start a business, the cost and time of receiving necessary permits and restrictions in access to loans are factors which, no doubt, may impact negatively on the investment attractiveness of a country, and these are not an exclusive list of the formal limitations that impact foreign investors.
The number of days needed to start a business, time needed to construct a production area, number of days required to close a real estate transaction, and the investor protection index (an average of three components: transaction disclosure requirements, availability of legal remedies in case of court proceedings, and the ease of receiving documents necessary for potential shareholder suits) are the most common measures of bureaucracy of an economic system.
In recent years, Poland and Slovakia have enacted a number of reforms aimed at facilitating business operations (both countries are leaders in the region). However, even in these countries there are still many arrangements that need to be modified. According to the World Bank, which publishes the ranking “Ease of Doing Business,” the Visegrad Group countries rank only moderately high.11 The top ranking was awarded to Slovakia (46), followed by Hungary (54), Poland (55), and the Czech Republic (65). It is worth noting that the Visegrad Group countries ranked better than Italy, China or India. Unfortunately, in individual categories of the study, the ranking of Visegrad Group countries is lower. The category “Starting a Business” places Hungary at 52nd place in the world and the Czech Republic, the worst performing country in the group, is ranked 140th. We need to highlight that, in the Visegrad Group, only Slovakia and Poland improved their rankings and Poland was considered the best reformer globally. It was rewarded with the biggest jump in global ranking in the following categories: registering property, paying taxes, enforcing contracts, and resolving insolvency. (Ease of Doing Business 2013, 2013, p.4).
Another barrier to FDI inflow to Central and East European countries is corruption, which is much higher than in the western part of Europe. This raises doubts when it comes to the transparency of decisions made by public officials, awarding contracts via public procurement, or granting authorizations or licenses. Corruption is measured by The World Economic Forum along with the competitiveness index. The higher the index (maximum of 7), the more transparent is the country. For some countries of Central and Eastern Europe the competitiveness index is close to the European average, however, for the majority of countries of the region the index is significantly lower. For Poland it is 4.0 (44th globally), but for Hungary 2.6 (106th), Slovakia - 2.5 (120th), and for the Czech Republic 2.3 (127th).12 (The Global Competitiveness Report2012-2013, 2012, p. 390).
A similar role is played by the Corruption Perception Index, measured since 1995 by Transparency International. Its main objective is to assess the transparency in the public sector. Currently (2012) the ranking covers 176 states and territories around the world. Assessment is made from 0 to 100, where 0 means the highest corruption/low- est transparency and 100 the lowest corruption/ highest transparency. In 2012 the most transparent countries were: Denmark, Finland, and New Zealand, with an average score of 90. The lowest ranking position was that of Somalia (12), North Korea and Afghanistan (13 each). The Visegrad Group countries were assessed rather well. They ranked in the first half of the ranking and scored better than, e.g., Italy, Bulgaria, Greece, Mexico or Brazil. However, they were overtaken by e.g., Chile, Uruguay, Cyprus, Spain, Portugal, Slovenia, and Taiwan. Similarly as in the ranking of The World Economic Forum, Poland scored the highest among the Visegrad Group countries. It ranked 41st with a score of 58 points. The other Visegrad group countries performed a bit worse, with Hungary ranked 46th (55 points), Czech Republic 54th (49 points), and Slovakia 62nd (46 points) (Corruption Perception Index, 2012).
Protection of intellectual property rights is also a major barrier hindering FDI inflow into the Visegrad Group countries. Available legal solutions, although largely improved compared to previous years, still do not live up to those applied in the most industrialized economies. That hampers hi-tech investment, as foreign companies would put themselves at risk of illegal imitation. As a result, investors are reluctant to transfer their R&D centres to Visegrad host countries. The above-quoted The Global Competitiveness Report 2012-2013 includes an index of intellectual property protection. Like its other indices, the maximum score is 7, meaning the highest protection. None of the countries in the region has exceeded the EU average (4.9), with Poland and Slovakia below the global average.13 The Visegrad Group countries’ ranking ranged from 48th (Hungary) to 67th (Poland). (The Global Competitiveness Report 2012-2013, 2012, p. 389).
Another determinant of FDI inflow is infrastructure. Its high quality is an important factor in making the location decision concerning an investment project. Infrastructure impacts the cost of transport and contributes to the integration with the EU internal market and links with abroad. Besides transportation network, other types of infrastructure such as IT, telecommunications and energy networks are also important determinants for FDI inflow. When it comes to infrastructure, Visegrad Group countries perform much less favourably than the rest of the EU. In many of them road, highway and railway infrastructure is insufficient and often in need of deep modernization. This is why European Union, in its new budget for 2014 - 2020, again plans to allocate substantial resources for the development and modernization of infrastructure, with an additional EUR 50 bn for a new infrastructural fund allocated to the “Connecting Europe Facility” (CEF), out of which EUR 9.1 bn will be spent on energy and EUR 9.2 bn on telecommunication.14
Taxes are also important for business activity. Sometimes they are even decisive for the direction of international expansion. In the light of global crisis, some states, e.g., the Czech Republic and Hungary, increased taxes to raise additional income for their budgets, which surely will not encourage investors to locate their investments there. Poland, for political reasons, does not cut public expenditures, which often forces tax increases.
In conclusion it is worth noting that all the Visegrad Group countries, with the exception of Slovakia, use their own currencies, which for investors may constitute an obstacle, especially if we consider that all the Visegrad Group countries are EU member states. Different currencies introduce an additional risk factor. An autonomous monetary and foreign exchange policy may increase exchange rate volatility, which may restrict FDI inflow and discourage foreign investors. We also need to note that economic policy, including foreign exchange policy, may be subordinated to political goals, which is evidenced by the change in policy of the Hungarian government in 2012-2013. Besides, the relatively small supply of Visegrad domestic currencies on the foreign exchange market may lead to speculation and increase the risk involved in FDI.
FUTURE RESEARCH DIRECTIONS
While the investment attractiveness of the countries of the Visegrad Group has been studied for many years, nevertheless there are areas which still need to be analyzed more deeply. Studies on investment attractiveness at the regional level (i.e. smaller administrative units within a country) remain a challenge to researchers, as they would help better understand the reasons taken into account by entities with foreign capital when making location decisions. Such analyses would provide public administration with information about which incentives are most likely to attract FDI.
The literature rarely discusses the efficiency of State aid instruments in the context of FDI inflow to regions. Which incentives are more and which are less important for investors in a given sector? What is the motivation of multinational corporations when they decide on an FDI in, e.g., the pharmaceutical, automotive or electronics industry? Such studies are very important for the development of an effective policy for attracting investors.
A promising perspective is also delineated in indepth studies on FDI’s impact upon the economy of the host country. Opinions highlighting benefits for countries and regions resulting from FDI, rather common among theoreticians, economic practitioners and politicians, are becoming ever more thoroughly discussed and questioned by many economists. The negative effects of FDI in Central and eastern Europe were analyzed by e.g. Orlowski. According to his estimates, by increasing competition the larger inflow of FDI to Central and Eastern Europe decreased GDP growth in the private sector in these countries during the period 1990-1994, and GDP growth of domestic companies between 1995-2007 (Orlowski, 2010).Thus the final assessment of FDI’s real impact on the economy is still unclear. Examples include its impact upon, e.g., the labour market, balance of payments, or the environment. In light of the increased environmental awareness of the general public, the last aspect seems particularly important. On one hand, the threats to the environment (particularly in less developed economies) resulting from the excessive exploitation of natural resources, increased consumption and shifting “contaminating” production processes to countries where environmental regulations are less stringent (the creation of so-called ‘pollution havens’) are highlighted. On the other hand, investors usually originate from OECD countries, where technological and organizational advancement is high, which may lead to dissemination of good practices across the host countries (Gentry, 1999; Wysokinska, Witkowska, 2004).
In brief, there are many areas which may become subjects for future studies at both the regional and national levels for the entire Visegrad Group. The problem, however, is the limited availability of qualitative and quantitative data at regional and sub-regional levels, which complicates in-depth analyses.
CONCLUSION
International links among businesses do not consist exclusively in the exchange of goods and services. On the contrary, since the second half of the 20th century, and in particular in the past three decades, the flows of production factors have gained in importance, especially the flows of capital. Thus, international capital flows are one of the key phenomena in the modern global economy and have become the subject of numerous studies and analyses. FDI is a very important type of capital outflow, different from the others. It is connected with the emergence of a specific group of businesses - multinational corporations.
As evidenced by the studies, FDI stimulates growth and counteracts short-term economic problems of countries and regions. International capital flows take place when there are imbalances in the global economy, i.e., when there are countries with capital surpluses and countries with capital shortages. Global capital outflows and FDI originate predominantly from the industrialized countries. They account for ca. 95% of cumulated FDI investments. In imports of capital their share is smaller, but still very high (ca. 80%). The second ‘deficit’ group is definitely more numerous and its members compete internationally for foreign capital. This group includes the countries of Central and Eastern Europe, which also includes the members of the Visegrad Group (Rymarczyk, 2006; Budnikowski, 2006).
As we stressed in the first part of the Chapter, enterprises may internationalize their operations in many sorts of ways. For sure, exports are the simplest way of expansion to foreign markets. Enterprises may also sell technologies to foreign partners. FDI is a more complex and costly solution. It requires additional outlays connected with taking over an existing business or starting a new one, and ensuring it will continue to operate in a different economic setup. Why then do investors decide to take this step? One of the most comprehensive answers to the question was proposed by the British economist J. H. Dunning in his OLI paradigm.
The potential benefits of FDI are shared between investors and host countries and regions. They touch upon many aspects of the economy. FDI seems particularly important to developing economies as it provides the gateway for the inflow of two factors vital for economic growth: capital and technology. In the literature one may also find arguments against FDI, connected with, e.g., the labour market, balance of payments, or monopolistic practices. However, a review of the empirical studies conducted in many countries and over different periods of time allows for a general conclusion that usually the benefits of FDI inflow exceed the costs, and its overall net effect is positive (Swierkocki, 2004; Budnikowski, 2006; Rymarczyk, 2006).
In the 1990s the countries of the Visegrad Group underwent unprecedented political and economic transformation. Liberalization of the provisions concerning foreign investments opened up their economies to external capital. Opening the national borders of countries which, at that time, suffered from shortages of products and services and offered access to relatively cheap production factors enhanced investors’ interest. There were still many legal, administrative or infrastructural barriers, which were and are still being gradually removed. At the same time, various incentives were put in place, e.g., subsidies and special economic zones designed to encourage foreign capital investors to choose a particular location and to pursue business operations there. These processes were reinforced by EU integration, which brought with it also the availability of additional resources from the EU cohesion policy budget. All of the above have made Central and Eastern Europe, and especially the Visegrad Group countries, one of the most attractive FDI locations globally. Thus, in general, the assessment and prognosis is rather positive. This does not mean, however, that public administration has nothing to do to support foreign investors.
Studies by Nikolovova (2012) show, inter alia, that the countries of the Visegrad Group seem to benefit a lot from FDI spillovers. The presence of MNEs in these countries is “above the average for Eastern Europe, reinforcing the economic significance of the estimated positive effect.” (Niko- lovova, 2012, p. 28). The effect is the strongest for industries with lower technological intensity, “where it is consistently significant across all specifications.” (Nikolovova, 2012, p. 32).
The inflow of foreign capital usually leads to the creation of new jobs, and this is particularly true of greenfield investment projects. They ensure employment not only when a company starts working but already, indirectly, when it is being constructed. In the 1990s in the Czech Republic, Slovakia, and Poland FDI inflow increased employment in most industrial sectors. The situation was different in Hungary, where in some industries, such as food processing, metallurgy or furniture manufacturing, employment in companies with foreign capital decreased, while simultaneously there was increased employment in local businesses in the same industries (Mickiewicz, Ra- dosevic & Varblane, 2000).
Moreover, entities with foreign capital are often buyers of local products and services. This is another way FDI may contribute to economic recovery in many regions. This is confirmed by, e.g., direct studies conducted in Poland at the regional level (Dorozynski, Urbaniak, 2011).
Foreign enterprises are usually more inclined to export than companies with exclusively domestic capital, which means they are important for international trade turnover and, as a corollary, impact the balance of payments. Many big multinational corporations present in Visegrad Group countries are also major exporters in the host countries. These are mainly businesses from the automotive, major appliances and audiovisual equipment industries. In Poland in 2010 export operations were carried out by 41% of all companies with foreign capital. (Ministry of Economy, 2012, p. 226).
The positive impact of foreign investors also consists in the dissemination of innovative work organization methods and personnel management, which improves discipline and productivity. Synthetically, this phenomenon is reflected in the labour productivity index, which in the period 2000-2011 increased by ca. 42% for the entire Visegrad Group, which was higher compared to the average for the OECD countries (18%) or for the countries of the euro area (11%).15 It is also clear that in companies with foreign capital average labour productivity is higher, which is evidenced, e.g., by the data for Poland. In the years 2000-2007 labour productivity in businesses with foreign capital was 64% higher than in businesses with exclusively Polish capital (Hybel, 2011, p. 27).
The role of foreign investors as animators of economic recovery in the Visegrad Group was not limited to manufacturing, services and trade. They also contributed to the boom in construction by showing their interest in locating their R&D and logistics centres in the Visegrad countries. This is undoubtedly a huge advantage of FDI inflow, as Poland is one of the least innovative countries among all of the EU developed economies, which is confirmed by its poor position in all global innovation rankings.16 According to the Innovation Union Scoreboard, which analyzes 27 EU economies, Poland ranks 24th, ahead of only Bulgaria, Romania, and Latvia. The remaining three Visegrad Group countries are referred to as moderate innovators.(Innovation Union Scoreboard 2013, 2013, p. 5.).
In summary, the general assessment of FDI inflow to Poland, the Czech Republic, Hungary, and Slovakia is positive. All these countries introduced significant changes, which made them attractive investment destinations. This, however, should not be taken for granted. One must not forget the competition of other countries and regions in the world. Advantages based only on cheap labour and low operational costs are not enough. This means that public administration should continuously strive to improve the investment attractiveness of regions by, e.g., investing in hard and soft infrastructure.
Studies also show that investors more and more often select a particular location taking into consideration not only the conditions for running a business, but also the standard of living. Hence investment should also be made into social infrastructure, in particular in education, healthcare, sports and leisure, and environmental protection.
All these factors mean that now more than ever the burden of meeting the increasing challenges relating to attracting and retaining foreign investors in regions will fall upon the shoulders of regional and local administrators. The latter are the best placed, with all their competences and resources, to create attractive and favourable conditions for running a business in a given territory. It is also a challenge for researchers, as regional investment attractiveness is very rarely the subject of in-depth studies. Such studies would help better understand the premises upon which entities with foreign capital base their location decisions, and support public administration in making effective use of budgetary resources.
REFERENCES
Aghion, P., Blundell, R., Griffith, R., Howitt,
P., & Prantl, S. (2009). The effects of entry on incumbent innovation and productivity. The Review of Economics and Statistics, 91(1), 20-32. doi:10.1162/rest.91.1.20
Agrawal, G., & Khan, M. A. (2011). Impact of FDI on GDP: A Comparative Study of China and India. International Journal of Business and Management, d(10), 71-79. doi:10.5539/ijbm. v6n10p71
Aitken, B., & Harrison, A. (1999). Do Domestic Firms Benefit from Direct Foreign Investment? Evidence from Venezuela. The American Economic Review, 89(3), 605-618. doi:10.1257/ aer.89.3.605
Aitken, B., Harrison, A., & Lipsey, R. (1996). Wages and foreign ownership: A comparative study of Mexico, Venezuela, and the United States. Journal of International Economics, 40(3-4), 345-371. doi:10.1016/0022-1996(95)01410-1
Akamatsu, K. (1962). A Historical pattern of Economic Growth in Developing Countries. The Developing Economies, 1, 1-23. doi:10.1111/j.1746-1049.1962.tb00811.x
Assuncao, S., Forte, R., & Teixeira, A. A. C. (2011). Location Determinants of FDI: A Literature Review. FEP Working Papers, 433, 1-23.
Back to Business: Optimism Amid Uncertainty. (2013). The 2013 A.T. Kearney Foreign Direct Investment Confidence Index.
Baharumshah, A., & Thanoon, M. (2006). Foreign capital flows and economic growth in East Asian countries. China Economic Review, 17(1), 70-83. doi:10.1016/j.chieco.2005.09.001
Banga, R. (2006). The Export-diversifying Impact of Japanese and US foreign Direct Investments in the Indian Manufacturing Sector. Journal of International Business Studies, 37(4), 558-568. doi:10.1057/palgrave.jibs.8400207
Banski, J. (2008). Polska i Europa Srodkowo- W schodnia w koncepcj ach podzialu Europy. Prace Geograficzne, 218, 121-134.
Bevan, A. A., & Estrin, S. (2004). The determinants of foreign direct investment into European transition economies. Journal of Comparative Economics, 32(4), 775-787. doi:10.1016/j. jce.2004.08.006
Bialek, U. (2012). Przegl¾d bezposrednich in- westycji zagranicznych w Europie Srodkowej i Wschodniej. Bulletin of Central and Eastern Europe, No 3. Center for International Relations.
Blomstrm, M. (1986). Foreign investment and productive efficiency: the case of Mexico. The Journal of Industrial Economics, 35(1), 97-110. doi:10.2307/2098609
Blomstrom, M. &Kokko, A. (2003). The Economics of Foreign Direct Investment Incentives. NBER Working Paper, w9489.
Blonigen, B., & Slaughter, J. (2001). Foreign- Affiliate Activity and U.S. Skill Upgrading. The Review of Economics and Statistics, 83(2), 362-376. doi:10.1162/00346530151143888
Budnikowski, A. (2006). Midynarodowe sto- sunki gospodarcze. Warsaw: PWE.
Busse, M., & Hefeker, C. (2007). Political Risk, Institutions and Foreign Direct Investment. European Journal of Political Economy, 23(2), 397-415. doi:10.1016/j.ejpoleco.2006.02.003
Carp, L. (2012). The Impact Of The Economic Crisis On The Dynamic Of International FDI. CES Working Papers, 4(1), 35-43.
Central Bank of Hungary. (2013). Statistics. Retrieved August 31, 2013, from www.mnb.hu Choe, J. (2003). Do Foreign Direct Investment and Gross Domestic Investment Promote Economic Growth? Review of Development Economics, 7(1), 44-57. doi:10.1111/1467-9361.00174
Cieslik, A. (2003). Skutki oddzialywania przeds⅛biorstw m⅛dzynarodowych kraju goszcz¾cymwwarunkachistnienianiedoskonalosci na Iokalnych rynkach produkcji. Bank i Kredyt, 34(4), 120-128.
Corruption Perception Index. (2012). Transparency International. Author.
Czech Investment and Business Development Agency. (2013). Statistics. Retrieved August 31, 2013, from www.czechinvest.org
Czech National Bank. (2013). Statistics. Retrieved August 31, 2013, from www.cnb.cz
Domar, E. D. (1946). Capital expansion, rate of growth and employment. Econometrica, 14(2), 137-147. doi:10.2307/1905364
Dorozynski, T., & Urbaniak, W. (2011). Ocena dzialalnosci inwestorow zagranicznych w wojewodztwie lodzkim. In J. Swierkocki (Ed.), Rola bezposrednich inwestycji zagranicznych w ksztaltowaniu aktualnego i przyszlego profilu gospodarczego regionu Iodzkiego. Uodz: Uodzkie Towarzystwo Naukowe.
Dunning, J. H., & Lundan, S. M. (2008). Theories of foreign direct investment. In Multinational Enterprises and the Global Economy. Cheltenham, UK: Edward Elgar Publishing Limited.
Ease of Doing Business 2013. (2013). Smarter Regulations for Small and Medium-Size Enterprises. World Bank.
Egger, P., & Pfaffermayr, M. (2002). Foreign Direct Investment and European Integration in the 90’s. Working Papers in Economics, 2, University of Innsbruck, 1-14.
Ekholm, K., Forslid, R., & Markusen, J. (2007). Export-Platform Foreign Direct Investment. Journal of the European Economic Association, 5(4), 776-795. doi:10.1162/JEEA.2007.5.4.776
Ernst & Young’s 2012 European attractiveness survey. (2012). Growth, actually. Author.
(2013). Ernst & Young’s attractiveness survey [Author.]. Europe, 2013.
European Commission. (2012). Internationalisation of business investments in R&D and analysis of their economic impact. Directorate General for Research and Innovation.
Faeth, I. (2009). Determinants of foreign direct investment - a tale of nine theoretical models. Journal of Economic Surveys, 23(1), 165-196. doi:10.1111/j.1467-6419.2008.00560.x
Feenstra, R. C., & Hanson, G. H. (1997). Foreign Direct Investment and Relative Wages: Evidence from Mexico’s Maquiladoras. Journal of International Economics, 42, 371-393. doi:10.1016/ S0022-1996(96)01475-4
Fifekova, M., & Hardy, J. (2010). Business Service, Foreign Direct Investment in Central and Eastern Europe, trends, motives and impacts. Project of The Economy And Society Trust.
Foreign Direct Investment in 2011. (2013).
Monetary and Statistics Department, Balance of Payments Division. Czech National Bank.
Foreign Direct Investment in Emerging Market Countries. (2003). Report of the Working Group of the Capital Markets Consultative Group. September.
Fortanier, F. (2007). Foreign direct investment and host country economic growth: does the investor’s country of origin play a role? Transnational Corporations, 16(2), 41-76.
Fosfuri, A., Motta, M., & Ronde, T. (2001). Foreign direct investment and spillovers through workers’ mobility. Journal of International Economics, 53, 205-222. doi:10.1016/S0022- 1996(00)00069-6
Gentry, B. (1999). FDI and the Environment: Boon or Bane? In FDI and the Environment. OECD.
Girma, S., Greenaway, D., & Wakelin, K. (2001). Who benefits from foreign direct investment in the UK? Scottish Journal of Political Economy, 48(2), 119-133. doi:10.1111/1467-9485.00189
Glass, A. J., & Saggi, K. (1998). International technology transfer and the technology gap. Journal of Development Economics, 55(2), 369-398. doi:10.1016/S0304-3878(98)00041-8
Global Competitiveness Report 2012-2013. (2012). World Economic Forum, Switzerland.
Globerman, S., Shapiro, D., & Tang, Y. (2004). Foreign Direct Investment. In Emerging And Transition European Countries. Center for International Business, Western Washington University.
Glowny Urz¾d Statystyczny. (2012). Dziatalnosc gospodarcza podmiotow z kapitatem zagranic- znym w 2011 roku. Warsaw: Author.
Gorg, H., & Greenaway, D. (2004). Much Ado about Nothing? Do Domestic Firms Really Benefit from Foreign Direct Investment? The World Bank Research Observer, 19(2), 171-197. doi:10.1093/ wbro/lkh019
Hailu, Z. A. (2010). Impact of Foreign Direct Investment on Trade of African Countries. International Journal of Economics and Finance, 2(3), 122-133. doi:10.5539/ijef.v2n3p122
Halecki, O. (1994). Historia Europy - jej granice i podziaty. Instytut Europy Srodkowo-Wschodniej.
Harding, T., & Javorcik, B. S. (2012). Foreign Direct Investment and Export Upgrading. The Review of Economics and Statistics, 94(4), 964-980. doi:10.1162/REST_a_00226
Harrod, R. F. (1939). An essay in dynamic theory. The Economic Journal, 49(193), 14-33. doi:10.2307/2225181
Haskel, J. H., Pereira, S. C., & Slaughter, M. J. (2007). Does inward foreign investment boost the productivity of domestic firms? The Review of Economics and Statistics, 89(3), 482-496. doi:10.1162/rest.89.3.482
Hybel, J. (2011). Rola bezposrednich inwestycji zagranicznych w tworzeniu miejsc pracy w Polsce w latach 2000-2009. EIOGZ, 93, 19-28.
Innovation Union Scoreboard 2013. (2013). EU.
FDI Intelligence. (2013). The FDI Report 2013. Global greenfield investment trends.
Jayaweera, S. (2009). Foreign Direct Investment and Export Diversification in Low Income Nations. Retrieved August 30, 2013, from http://ssrn.com/ abstract=1566044
Karimi, M., & Yusop, Z. (2009). FDI and Economic Growth in Malaysia. MPRA, Paper no. 14999.
Kathuria, V. (2000). Productivity spillovers from technology transfer to Indian manufacturing firms. Journal of International Development, 12(3), 343-369. doi:10.1002/ (SICI)1099-1328(200004)12:33.0.CO;2-R
Klysik-Uryszek, A. (2010). Bezposrednie in- westycje zagraniczne w gospodarce regionu. Teoria i praktyka. Warsaw, CeDeWu.pl.
Klysik-Uryszek, A. (2011). Gospodarcze efekty naplywu bezposrednich inwestycji zagranic- znych do regionu. In J. Swierkocki (Ed.), Rola bezposrednich inwestycji zagranicznych w ksztattowaniu aktualnego i przysztego profilu gospodarczego regionu todzkiego. Eodz: Eodzkie Towarzystwo Naukowe.
Kokko, A. (1992). Foreign direct investment, host country characteristics, and spillovers. (Doctoral Dissertation). Stockholm School of Economics, Stockholm, Sweden.
Konings, J. (2009). The Effects of Foreign Direct Investment on Domestic Firms: Evidence from Firm Level Panel Data in Emerging Economies. Economics of Transition, 9(3), 619-633. doi:10.1111/1468-0351.00091
Kucharcikova, A. (2013). Foreign Direct Investment in the Context of the Economic Recession in Slovakia. Journal of Financial Economics, 1(1), 1-7.
Lall, S. (1978). Transnational, Domestic Enterprises and Industrial Structure in Host LDCs: A Survey. Oxford Economic Papers, 30(2), 217-248.
5. latPolski w UniiEuropejskiej. (2009). Urz¾d Komitetu Integracji Europejskiej, Warsaw.
Li, H., Liu, Z., & Rebelo, I. (1998). Testing the Neoclassical Theory of Economic Growth: Evidence from Chinese Provinces. Economics of Planning, 31(2/3), 117-132. doi:10.1023/A:1003571107706
Lim, L. K., & McAleer, M. (2002). Economic Growth and Technological Catching Up by Singapore to the USA. Mathematics and Computers in Simulation, 59(1-3), 133-141. doi:10.1016/ S0378-4754(01)00401-3
Lipsey, R. E. (2000). Interpreting Developed Countries’ Foreign Direct Investment. NBER Working Paper No. 7810.
Markusen, J., & Venables, A. (1999). Foreign Direct Investment as a Catalyst for Industrial Development. European Economic Review, 43(2), 335-356. doi:10.1016/S0014-2921(98)00048-8
Marwah, K., & Klein, L. R. (1998). Economic Growth and Productivity Gains from Capital Inflow: Some Evidence for India. Journal of Quantitative Economics, 14(1), 81-108.
Mateev, M. I., & Tsekov, I. (2012). Do Central and Eastern European Countries Possess FDI Advantages to More Developed Western Countries?. Retrieved August 5, 2013, from http:// dx.doi.org/10.2139/ssrn.2139361
Mickiewicz, T., Radosevic, S., & Varblane, U. (2000). Foreign Direct Investment, Structures of Employment and Job Creation in Transition Economies, 1993-1996. In M. A. Weresa (Ed.), Foreign Direct Investment in a Transition Economy: The Polish Case. London: SEESS University College.
Ministry of Economy. (2010). Wartosc inwestycji w SSE wg kraju pochodzenia. Grudzien 2010. Warsaw.
Ministry of Economy. (2012). Polska druga pod wzglζdem atrakcyjnosci inwestycyjnej. Warsaw.
Mottaleb, K. (2007). Determinants of Foreign Direct Investment and Its Impact on Economic Growth in Developing Countries. MPRA Paper No. 9457, 1-15.
Narodowy Bank Polski. (2012). Zagraniczne inwestycje bezposrednie w Polsce w 2011 roku. Warsaw: Departament Statystyki.
National Bank of Poland. (2013). Statistics. Retrieved August 31, 2013, from www.nbp.pl
Nikolovova, P. (2012). Impact Of FDI On The Host Economy. Cerge-Ei Working Paper Series, 471.
Nunnenkamp, P. (2002). Foreign Direct Investment in Developing Countries: What Economists (Don’t) Know and What Policymakers Should (Not) Do! India: CUTS Centre for International Trade, Economics & Environment.
Nytko, M. (2009). Model T. Ozawy jako narzedzιc prognozy skutkow rozwoju bezposrednich inwestycji zagranicznych. In J. Czech-Rogosz (Ed.), Koniunktura gospodarcza a reakcje podmiotow gospodarujqcych. Katowice: Akademia Ekonom- iczna w Katowicach.
OECD. (2010). Measuring Globalisation: OECD Economic Globalisation Indicators 2010. Paris: Organisation for Economic Co-operation and Development.
OECD benchmark definition of Foreign Direct Investment. (2008). OECD.
Official Journal ofthe Republic of Poland. (2013). Obwieszczenie Marszalka Sejmu RP w sprawie ogloszenia jednolitego tekstu ustawy o swobodzie dzialalnosci gospodarczej. Dziennik Ustaw RP, Warsaw, 11.06.2013, item 672.
Orlowski, W. (2010). W pogoni za straconym czasem: Wzrost gospodarczy w Europie Srodkowo- Wschodniej 1950-2030. Warsaw: PWE.
Ostergren, R. C., & Rice, J. G. (2004). The Europeans: A geography of People, Culture and environment. The Guilford Press.
Ozawa, T. (1992). Foreign direct investment and economic development. Transnational Corporation, 1, 27-54.
Parcon, H. (2008). Labor Market Flexibility as a Determinant of FDI Inflows. Department of Economics. University of Hawai’i at Manoa. Working Paper No. 08-07.
Pietrzyk, I. (2004). Globalizacja, integracja eu- ropejska a rozwoj regionalny. In A. Jewtuchowicz (Ed.), Wiedza, innowacyjnosc, przedsiςbiorczosc a rozwoj regionow. Eodz: Wydawnictwo Uniwer- sytetu Eodzkiego.
Polish Information and Foreign Investment Agency. (2013). Statistics. Retrieved August 31, 2013, from www.paiz.gov.pl
Poulsen, L. S., & Hufbauer, G. C. (2011). Foreign Direct Investment in Times of Crisis (Working Paper 11-3). Peterson Institute for International Economics.
(2012). Raport o stanie gospodarki. Warsaw: Ministry of Economy.
Report, W. I. (2013). Global Value Chains: Investment and Trade for Development. UNCTAD.
Robertson, R. (1994). Globalisation or Glocalisa- tion? Journal of International Communication, 1(1), 33-52. doi:10.1080/13216597.1994.9751 780
Rostow, W. W. (1971). The Stages of Economic Growth: Non Communist Manifesto. Cambridge.
Roy, A. G., & Van den Berg, H. F. (2006). Foreign Direct Investment and Economic Growth: A TimeSeries Approach. Global Economy Journal, Journal of Technology and Human Interaction, 1(3), 1-14. doi:10.4018/jthi.2005070101
Shackleton, M. R. (1969). Europe: A regional geography. University of London.
Siotis, G. (1999). Foreign Direct Investment Strategies and Firms’ Capabilities. Journal of Economics & Management Strategy, 8(2), 251-270. doi:10.1162/105864099567659
Slovak Investment and Trade Development Agency. (2012). Statistics. Retrieved August 31, 2013, from www.sario.sk
Special Economic Zones. (2012). Raport KPMG.
Stawicka, M. (2007). Atrakcyjnosc Inwestycyjna Polski. Warsaw: CeDeWu.pl.
Sumner, A. (2005). Is Foreign Direct Investment Good for the Poor? A Review and Stocktake. Development in Practice, 15(3/4), 269-285. doi:10.1080/09614520500076183
Svensson, G. (2001). Glocalization of Business Activities: A Glocal Strategy Approach. Management Decision, 39(1), 6-18. doi:10.1108/ EUM0000000005403
Swierkocki, J. (2004). Zarys miςdzynarodowych stosunkow gospodarczych. Warsaw: PWE.
Swyngedouw, E. (2004). Globalisation or Glo- calisation? Networks, Territories and Rescaling. Cambridge Review of International Affairs, 17(1), 25-48. doi:10.1080/0955757042000203632
Ustawa z dnia 20 pazdziernika 1994 r. o spec- jalnych strefach ekonomicznych. Dz. U. 1994 Nr 123 item 600, together with subsequent amendments. (1994).
Whitman, M. M. (1999). FDI in emerging countries: A home-country review. Working Paper, 254, 1-15.
Wysokinska, Z., & Witkowska, J. (2004). Handel i inwestycje zagraniczne a zrownowazony. Eodz: Wydawnictwo Uniwersytetu Eodzkiego.
Zhang, Y., Li, Y., & Zhou, L. (2010). FDI spillovers in an emerging market: the role of foreign firms’ country origin diversity and domestic firms’ absorptive capacity. Strategic Management Journal, 31, 969-989.
ADDITIONAL READING
Ahmed, S. (Ed.). (2013). Foreign Direct Investment, Trade and Economic Growth: Challenges and Opportunities. India: Routledge.
Benito, G. R. G., & Gripsrud, G. (1992). The Expansion of Foreign Direct Investments: Discrete Rational Location Choices or A Cultural Learning Process? Journal of International Business Studies, 23(3), doi:10.1057/palgrave.jibs.8490275
Beugelsdijk, S., Smeets, R., & Zwinkels, R. C. J. (2008). The impact of horizontal and vertical FDI on host’s country economic growth. International Business Review, 17(4), 452-472. doi:10.1016/j. ibusrev.2008.02.004
Bijsterbosch, M., Kolasa M. (2010). FDI and productivity convergence in Central and Eastern Europe: an industry-level investigation. Review of World Economics 145.
Blalock, G., & Gertler, P. (2008). Welfare Gains from Foreign Direct Investment through Technology Transfer to Local Suppliers. Journal of International Economics, 74(2), 402-421. doi:10.1016/j.jinteco.2007.05.011
Blonigen, B., & Piger, J. (2011). Determinants of Foreign Direct Investment. NBER Working Paper Series, No 16704.
Borensztein, E., De Gregorio, J., & Lee, J. W. (1998). How does Foreign Direct Investment Affect Economic Growth? Journal of International Economics, 45(1), doi:10.1016/S0022- 1996(97)00033-0
Busse, M., & Groizard, J. L. (2008). Foreign Direct Investment, Regulations and Growth. World Economy, 31(7), 861-886. doi:10.1111/j.1467- 9701.2008.01106.x
Demekas, D. G., Horvath, B., Ribakova, E., & Wu, Y. (2007). Foreign direct investment in European transition economies - The role of policies. Journal of Comparative Economics, 35(2), 369-386. doi:10.1016/j.jce.2007.03.005
Drahokoupil, J. (2008). Globalization and the State in Central and Eastern Europe: The Politics of Foreign Direct Investment. Routledge.
Dunning, J. H. (1979). Explaining Changing Patterns of International Production: In Defense of the Eclectic Theory, Oxford Bulletin of Economic and Statistics, 1979, Vol. 41.
Dunning, J. H. (1993). Multinational Enterprises and the Global Economy. New York: Addison- Wesley Publishing Company.
Dunning, J. H. (Ed.). (1998). Globalization, Trade and Foreign Direct Investment. Emerald Group Publishing Limited.
(2002). Foreign Direct Investments for Development, maximizing benefits, minimizing costs. OECD.
Globalization, S. (2013). New Trends in Foreign Direct Investment. Bertelsmann Foundation.
Hagemejer, J., & Tyrowicz, J. (2009). Is the Impact Really That High? The Effect of FDI in Transition. MPRA Paper 14934. Germany: University Library of Munich.
Importance of the Investment Climate for FDI and Domestic Investments (2006)., World Bank Institute, May.
Kumar, N. (2002). Globalization and the Quality of Foreign Direct Investment. Oxford University Press.
Liebscher, K., Christl, J., Mooslechner, P., & Ritzberger-Grunwald, D. (2007). Foreign Direct Investment in Europe: A Changing Landscape. Edward Elgar Pub. doi:10.4337/9781847208798
Markusen, J. R., & Venables, A. J. (1999). Foreign direct investment as a catalyst for industrial development. European Economic Review, 43(2), 335-356. doi:10.1016/S0014-2921(98)00048-8
Moran, T. H. (2011). Foreign Direct Investment and Development. Peterson Institute.
Moran, T. H., Graham, E. M., & Blomstrom, M. (2005). Foreign Direct Investment Promotes Development? New Methods, Outcomes and Policy Approaches. Peterson Institute.
Nicholls, D. (2012). Foreign Direct Investment: SmartApproaches to Differentiation and Engagement. Gower Pub Co.
Nunnenkamp, P. (2002). Determinants of FDI in developing countries: has globalization changed the rules of the game? KielerArbeitspapiere, No. 1122.
Walsh, J., & Jiangyan, Yu. (2010). Determinants of Foreign Direct Investment: A Sectoral and Institutional Approach. IMF Working Paper, No 10/187.
KEY TERMS AND DEFINITIONS
Cohesion Policy: One of the goals of economic restructuring and modernization is to increase cohesion between individual areas. Cohesion policy includes actions by public authorities designed to stimulate social and economic development in regions. Its main objective is to restrict economic, social, and territorial disparities, ensuring sustainable growth and enhancing competitiveness and innovation in all regions.
Economic Transformation: Change of an economic system, in particular shifting from a centrally-planned to a market economy, based on a functioning free market, competition, and private business. Centrally-planned economies were in place in most of the Central and East European countries until the end of the 1980s. This made the economy fully dependent on the decisions of central authorities. Private business was limited to the minimum, production assets were fully owned by the state, there were no financial or capital markets, market mechanism did not function, prices were decided by officials, and competition was replaced by a monopoly. Trade with third countries was regulated.
Foreign Direct Investment: A specific type of capital flow, consisting in taking control over a company based in one country by residents of another country by either starting an independent economic activity from scratch or by acquiring management control over an existing company. Investment may also consist in the acquisition of fixed assets abroad with a view to expand the current operations and to create a joint venture with a foreign entity.
Industrial Park: An area with a real estate complex and technical facilities, usually abandoned by an already liquidated or restructured enterprise. It is usually managed by the local authority, which uses it to create favorable conditions for businesses, especially SMEs.
Portfolio Investment: Acquisition by investors from one country of financial assets (mainly Treasury securities) in another country. Portfolio investment differs from FDI as in the first case an investor satisfies himself with return on her/ his capital while in FDI he/she acquires active management interest and responsibility over businesses in a given country.
Special Economic Zone: A geographical area in a given country dedicated for economic operations conducted on specific terms laid down in appropriate legal regulations. Economic zones are created to stimulate the economic growth of a given region through the development of specific industries, implementation of new technologies, creation of new jobs, exports, and managing and modernizing existing infrastructure and industrial assets. Entities authorized to operate within the special zone may expect to benefit from various types of State aid, e.g. income tax allowances.
State Aid: Any action undertaken by state authorities consisting in granting aid, in any form whatsoever, to an individual entrepreneur or to a group of entities, which distorts competition on the market. In the EU State aid is regulated in Art. 107 and 108 TFEU. The following premises must be met (jointly) to reach a finding that we are dealing with incompatible State aid: (1) A measure is an aid to an undertaking; (2) Aid is granted by the State or from the State resources; (3) Aid favors certain undertakings or the production of certain goods; (4) Aid distorts competition or threatens to distorts it; (5) Aid distorts trade among member states; (6)Aid is not covered by any of the Treaty exemptions. An example of aid covered by the Treaty exemption and, as such, compatible with the EU market, is aid to promote economic development of areas where the standard of living is abnormally low or where there is serious underemployment. State aid consists in granting direct financial or in-kind advantages to the beneficiary, e.g. subsidies, grants for equipment, etc. State aid may also consist in the reduction of public and legal liabilities of the beneficiary, e.g., liabilities write-offs.
Visegrad Group: An informal regional alliance of four countries of Central and Eastern Europe, member states of the EU: Poland, Czech Republic, Hungary, and Slovakia. The countries are joined not only because of geographical proximity, but also due to shared similar political fate, history, culture, and tradition. The Group originated in a summit meeting on 15 Febru- ary1991in the Hungarian town of Visegrad where the Declaration laying down the framework of their cooperation was signed by the Presidents of Poland, Hungary and Czechoslovakia. In the initial period, the Group focused on democracy building, market economy, and aspiring to EU membership. Its present tasks deal with regional cooperation and joint initiatives within the EU in the area of transport infrastructure, power and energy, as well as culture, education, science, and youth mobility.
ENDNOTES
1 In the literature a lot of attention is paid to demonstrating the reverse link: labor market flexibility as an FDI inflow stimulator. An extensive review of literature in this field can be found in Parcon (2008).
2 According to UNCTAD terminology, “developed economies” encompass the twenty-seven member states of the EU, plus Australia, Bermuda, Canada, Gibraltar, Iceland, Israel, Japan, New Zealand, Norway, Switzerland, and the United States. “Transition economies” encompass six countries of South-East Europe (Albania, Bosnia and Herzegovina, Croatia, The FYR of Macedonia, Montenegro, and Serbia), and the twelve countries of the Commonwealth of Independent States: Armenia, Azerbaijan, Belarus, Georgia, Kazakhstan, Kyrgyzstan, the Republic of Moldova, Russian Federation, Tajikistan, Turkmenistan, Ukraine, and Uzbekistan. All other countries are “developing economies.” The notion and scope of Central and Eastern Europe are defined in many sorts of ways in the existing literature. R.C. Ostergren and
J.G. Rice (2004), in their concept of macroregions, making reference to O. Halecki (1950, 1994), included states independent in the intra-war period (also Austria) situated among Scandinavia, Germany and Italy on the west and Russia on the east into Central and Eastern Europe. Poland is the biggest country in this part of Europe. The American textbook Europe and the Mediterranen describes Central Europe as a part of the continent between France in the west and Russia in the east. It includes countries like: Germany, Poland, Czech Republic, Slovakia, and Austria. The British Europe, regional geography, considers Switzerland a part of Central Europe. Eastern Europe includes only Russia, while Bulgaria, Romania, Yugoslavia, and Albania belong to the SouthCentral region (Shackleton, 1969). For the needs of this publication we adopted the most commonly used scope of Central and Eastern Europe, which includes: Poland, Czech Republic, Slovakia, and Hungary (Visegrad Group), Baltic States (Lithuania, Latvia, and Estonia), countries of the former Yugoslavia, Romania, Bulgaria, and Albania. There are controversies over Ukraine and Belarus. In seems certain that in the event of their political convergence with European and Transatlantic structures (more probable in the case of Ukraine), they will be included in the concept of Central and Eastern Europe for the purposes of economic studies. (Banski, 2008).
Capital in transit involves transactions of the so-called ‘Special Purpose Entities’, which, for tax optimization reasons, transfer funds through certain countries on order of the parent corporation.
The notion of competitiveness, as intended by the WEF combines the twelve pillars of competitiveness with three stages of economic development of a given country: factor-driven economy, efficiency-driven economy, and innovation-driven economy. The GCI measures the level of competitiveness of an economy, defined as the set of institutions, policies, and factors that determine the level of productivity of an economy.
The FDI Confidence Index is a regular survey of global executives conducted by A.T. Kearney. The Index provides a look at the present and future prospects for international investment flows.
The Czech Republic borders the Western European markets of Germany and Austria. Hungary is closest to the Southern European markets, and also has good access to Western Europe. Poland borders the major Western European markets of Germany and the B altic Sea, together with access to the Ukraine and the Baltic markets. Slovakia has borders with the other three Central and European states, and access to the Ukraine and the CIS markets. Its capital city is extremely close to Vienna. For more on localization advantages, see Foreign direct investment in Central and Eastern Europe (2011).
Program for supporting investment important for Polish economy for the years 2011-2020.
| 10 These industries generate the highest value added and contribute the most to economic development and fostering competitive advantages. 11 Higher ranking position means simpler and more favorable regulations of business activities, and more and higher quality reforms in individual countries. 12 Global average is 3.6, EU - 4.03. 13 Global average is 3.8. | 14 www.eurofundsnews.pl/content/ view/15576/104/ 15 Own calculations based on OECD.StatEx- tracts (as at August 2013). 16 In the Global Innovation Index Poland ranks 44th (28th in Europe), in the Global Creativity Index 2011 - 41th, in the Economist Intelligence Unit - 44th, in The Global Competitiveness Index 2012-2013 - also 44th, and in the Knowledge Economy Index 2012 - 38th. |
This work was previously published in Geo-Regional Competitiveness in Central and Eastern Europe, the Baltic Countries, and Russia, edited by Anatoly Zhuplev and Kari Liuhto, pages 239-288, copyright 2014 by Business Science Reference (an imprint of IGI Global).
776