Graphical presentation of CREDIT DEPOSIT RATIO AND CREDIT SHARE OF STATES
Credit Deposit ratio represents the actual loans and advances as a proportion of total deposit collected in a particular year for any state. It also indicates the efficiency and productivity of the bankers as well as total fund for productive purpose.
The ratio, in other words, presents the coefficient of conversion of total investible funds of the banks to real sectors’ investment after deducting the statutory reserves to be kept in different forms in line with the guidelines of the Reserve Bank of India, the central bank of India. A state with high C/D ratio means it is efficient in utilizing its total deposit money and is expected to have positive impact upon the domestic product of that particular state. Conversely, a low C/D ratio state means it is weak in efficiency ground so far as conversion of deposit into credit is concerned.On the other hand, share of credit of any state out of the total credit of the sixteen states clubbed together represents the position of the state in
holding an expected power to utilize it into productive purposes. A high share state implies that it has high capacity to utilize the fund in different purposes and also in aggregate domestic product so that it can lead the country in terms of output, investment and employment opportunities.
A state with high credit share is expected to have high C/D ratio and a low share with a low C/D ratio. But in reality there can be different combinations of results between these two credit variables. Figure 1 and Figure 2 present the C/D ratio of all the selected states over time and Figure 3 and Figure 4 present the credit share of states over time.
The observed series of C/D ratio of the states show fluctuations over time and they are seemed to be non stationary at their level values. Tamil Nadu has been the top state with a C/D ratio of around 95 per cent throughout the entire period.
The states to follow it are Karnataka, Maharashtra and Andhra Pradesh etc. The states in the bottom line are Uttar Pradesh and Bihar who are able to convert 40 per cent of their deposit money into credit for their own economic activities. For most of the states, the trends follow downward up to the year 2002 and after that the rising trends start.It is observed from the Figure 3 and 4 that the trends of credit shares of all the states are also non
Figure 1. Credit-deposit ratio of states
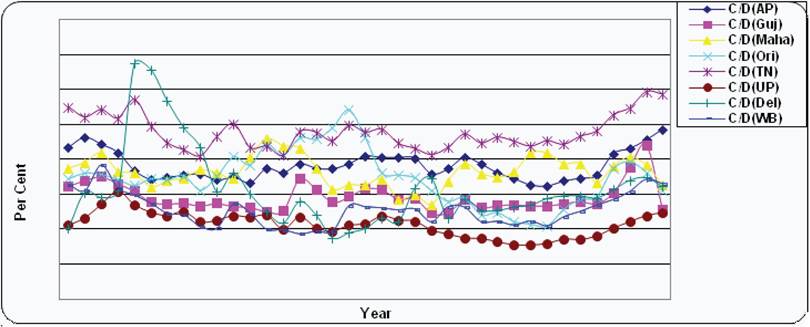
Figure 2. Credit-deposit ratio of states
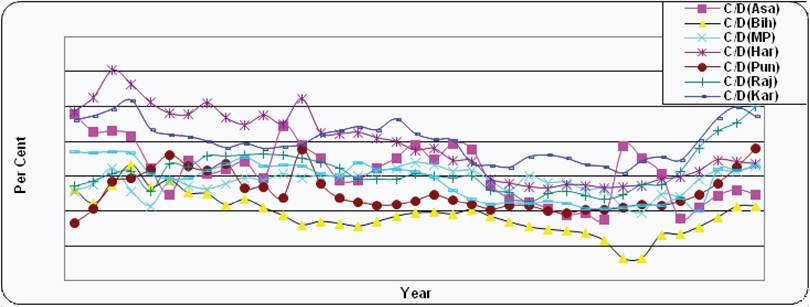
Figure 3. State-wise share of credit
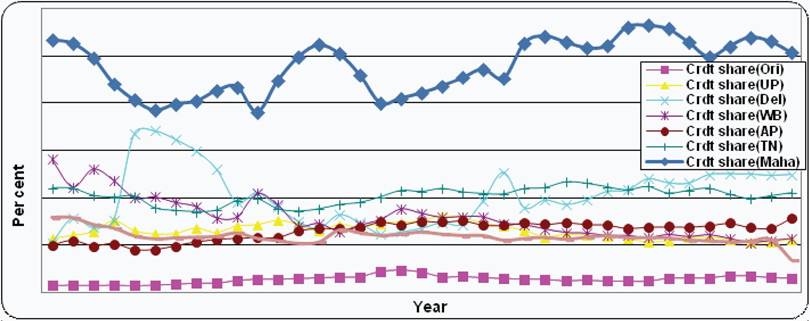
Figure 4. State-wise share of credit
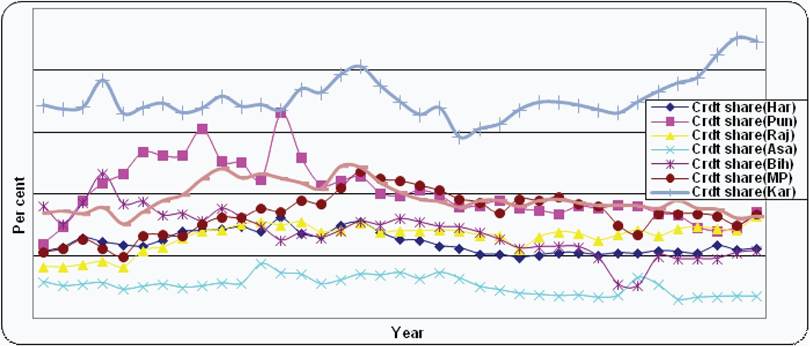
stationary at their level values. Maharashtra is the top state in the list possessing around 25 per cent of credit of the all states’ credit clubbed together. The states following Maharashtra are Tamil Nadu, Delhi, and Karnataka etc. In some states the shares of credit takes upward trend during the pre reform phase but downward in the post reform phase. The states that are lying at the trough are Assam, Orissa, Haryana and Rajasthan, etc.
The figures of credit shares show the presence of disparity as the top four states possess over half of the total credit allocated for their economic activities. The rest twelve states occupy less than half of the total credit for their economic activities. Now it is a natural question of whether a state improving in C/D ratio is also improving in its credit share or not. To explore this we need to study further the state specific trends of C/D ratio and credit share.
To have closer look on the interrelations between the C/D ratio and credit shares for states we have ranked the states in some specific time points with respect to these two credit variables.
It is observed from Table 1 that for five time points (1972, 1982, 1993, 2003 and 2008) the states in most cases are varying in their positions. In respectTable 1. Ranks of states in C/D ratio and credit share over periods
| Year/ States | 1972 (C/D) | 1972 (Share) | 1982 (C/D) | 1982 (Share) | 1993 (C/D) | 1993 (Share) | 2003 (C/D) | 2003 (Share) | 2008 (C/D) | 2008 (Share) |
| Andhra Pradesh | 5 | 8 | 7 | 8 | 2 | 6 | 4 | 5 | 3 | 5 |
| Assam | 3 | 14 | 10 | 16 | 3 | 16 | 5 | 16 | 14 | 16 |
| Bihar | 12 | 9 | 16 | 12 | 16 | 12 | 16 | 14 | 16 | 14 |
| Delhi | 15 | 7 | 6 | 2 | 7 | 3 | 6 | 2 | 11 | 2 |
| Gujarat | 10 | 4 | 14 | 7 | 11 | 7 | 9 | 8 | 13 | 8 |
| Haryana | 2 | 13 | 2 | 14 | 5 | 14 | 7 | 13 | 6 | 13 |
| Karnataka | 4 | 5 | 4 | 6 | 6 | 8 | 3 | 4 | 4 | 4 |
| Kerala | 7 | 10 | 9 | 10 | 13 | 10 | 13 | 9 | 7 | 11 |
| Maharashtra | 6 | 1 | bgcolor=white>81 | 10 | 1 | 2 | 1 | 10 | 1 | |
| Madhya Pradesh | 13 | 12 | 11 | 11 | 8 | 9 | 12 | 11 | 8 | 10 |
| Orissa | 8 | 16 | 3 | 15 | 4 | 15 | 8 | 15 | 12 | 15 |
| Punjab | 16 | 11 | 12 | 9 | 15 | 11 | 14 | 10 | 5 | 9 |
| Rajasthan | 11 | 15 | 5 | 13 | 9 | 13 | 10 | 12 | 2 | 12 |
| Tamil Nadu | 1 | 3 | 1 | 4 | 1 | 2 | 1 | 3 | 1 | 3 |
| Uttar Pradesh | 14 | 6 | 15 | 5 | 14 | 5 | 15 | 7 | 15 | 7 |
| West Bengal | 9 | 2 | 13 | 3 | 12 | 4 | 11 | 6 | 9 | 6 |
to C/D ratio Tamil Nadu is at first position but it’s rank in credit share slightly fluctuating. On the other hand, Maharashtra ranks first in credit share but ranks differently in terms of C/D ratio.
Therefore, we need to study which series causes whom for a particular state that is the central objective of the present study.