HOW ACCURATE ARE PROJECTIONS IN PRACTICE?
The Colossal Chemical example explains how to build a financial forecast from the bottom up, but because it is fictitious, readers cannot test the projections against the company’s actual, subsequent performance.
Exhibit 12.13, however, provides a real-life illustration of the potential and limitations of financial forecasting. The middle column is an actual forecast for Jostens, a provider of class rings, yearbooks, school photography, and graduation products, as well as employee achievement and sports awards, for the second quarter of 2001. It was created by George Chalhoub, a Merrill Lynch high-yield bond analyst specializing in consumer goods. Actual figures for the corresponding 2000 period appear in the left-hand column, while the right-hand column shows the actual outcome for 2001’s second quarter. In Jostens’s highly seasonal business, the second quarter is the biggest in terms of sales and earnings.Even though sales were lower in the first quarter of 2001 than in the corresponding period of 2000, Chalhoub expected strong orders for yearbooks and jewelry, along with improved profit margins, in the second quarter. He projected net sales of $350 million, up slightly from $344.7 million in the year-earlier period, and a rise in gross profit to $196 million from $189.9 million. (Observe that analysts are generally not arrogant enough to try to forecast the figures accurately to the first decimal place, that is, to the hundred-thousands for a company with revenues in the hundreds of millions.)
Evidently, the analyst had a good handle on how business was going in yearbooks and class rings. Actual sales came in at $351.0 million, just 0.3% above the projection. The accuracy of the forecast was likewise highly respectable at the EBITDA line, where the actual number, $100.2 million, was just 1.2% higher than the forecast.
As usually happens, changed circumstances caused the outcome to deviate somewhat from the analyst’s forecast.
In the course of the second quarter, Jostens decided to postpone certain equipment upgrades untilEXHIBIT 12.13 Jostens (JOSEA) ($000 omitted)
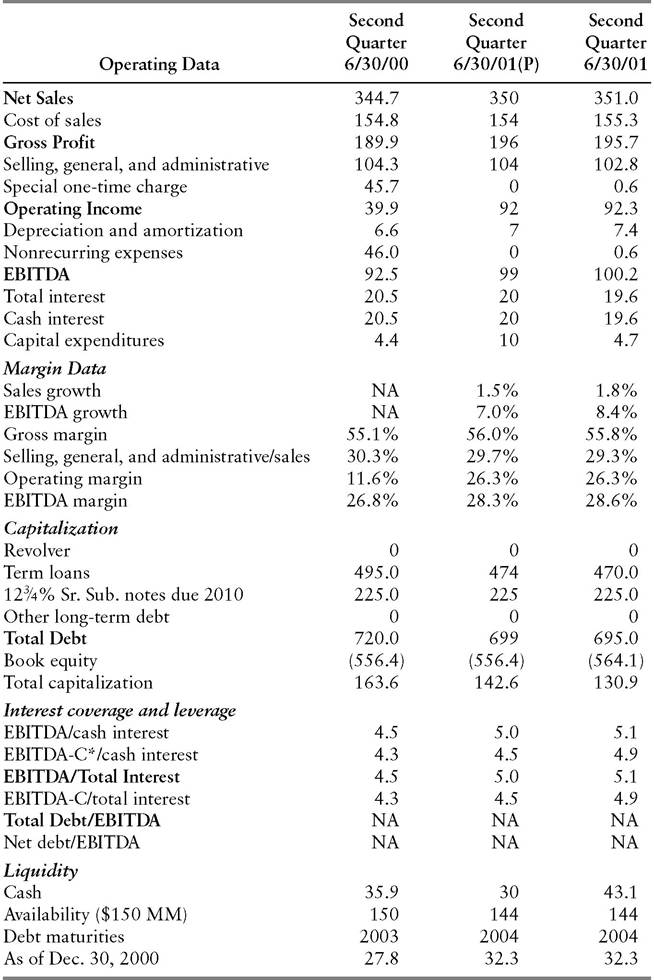
(P) = Projected.
*EBITDA-C is EBITDA less Capital Expenditures. Source: Merrill Lynch & Co.
2002. That caused Chalhoub’s $10 million capital spending projection to overshoot the actual figure by $5.3 million. The lower-than-projected capital spending, in turn, helped to produce a higher end-of-period cash balance ($43.1 million) than the forecasted $30 million. Also contributing to the variance was higher-than-expected cash generation from reductions in working capital.
Although the variances in capital spending and ending cash balance were substantial in percentage terms, they did not cause key financial ratios to vary greatly from their forecasted levels. The ratios, rather than the absolute amounts shown on individual lines of the financial statements, form the basis of credit analysis, as explained in Chapter 13. As a practical matter, fixed income portfolio managers were no less disposed to invest in the Jostens bonds on the basis of Chalhoub’s projected 5.0x EBITDA coverage of total interest than they would have been if he had nailed it exactly by forecasting 5.1x.
Naturally, the variance was greater in the case of total interest coverage EBITDA minus capital expenditures (an actual 4.9x versus a projected 4.5x), reflecting Jostens’s lower-than-projected capital spending. On another fine point, Chalhoub’s quarterly projection shows “NA” (not applicable) for the standard ratio of total debt to EBITDA. As explained in the “Combination Ratios” section of Chapter 13, it is generally inappropriate to compare a quarterly income statement item (EBITDA) with a balance sheet figure, especially in the case of a highly seasonal company such as Jostens. Analysts can, however, calculate a meaningful ratio of total debt to EBITDA for the second quarter by using a denominator consisting of combined EBITDA for the second half of 2000 and the first half of 2001.