SENSITIVITY ANALYSIS WITH PROJECTED FINANCIAL STATEMENTS
Preparing a set of projected financial statements provides a glimpse at a company’s future financial condition, given certain assumptions. The analyst can study the projected statements using the same techniques discussed in Chapters 2 through 4 for the historical statements and also use them to calculate the ratios employed in credit analysis (Chapter 13) and equity analysis (Chapter 14).
Based on the historical and projected data in Exhibits 12.1 through 12.8, Colossal Chemical’s credit quality measures will improve in 2002 (Exhibit 12.9). Total debt will decline, not only in absolute terms, but also as a percentage of total capital—from 29.0% to 26.7%. Si- miliarly, total debt as a multiple of cash provided by operations will fall from 1.93x to 1.64x. As explained in Chapter 13, both of these trends indicate reduced financial risk. These projected ratios are only as reliable as the assumptions underlying the projected statements that generated them. Logical though they may seem, the assumptions rest heavily on macroeconomic forecasting, which is far from an exact science, to put it charitably. Typically, the analyst must modify the underlying economic assumptions, and therefore the projections, several times during the year as business activity diverges from forecasted levels.Knowing that conditions can, and in all likelihood will, change, wise investors and lenders will not base their decisions entirely on a single set of
EXHIBIT 12.9 Trend of Credit Quality Measures—Base Case
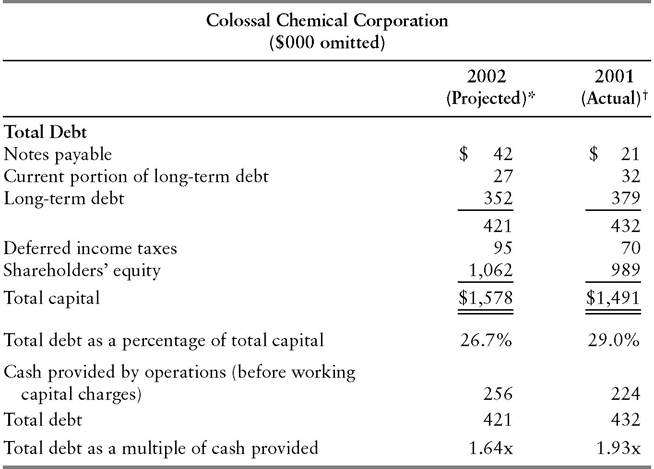
*From Exhibit 12.8.
tFrom Exhibit 12.1.
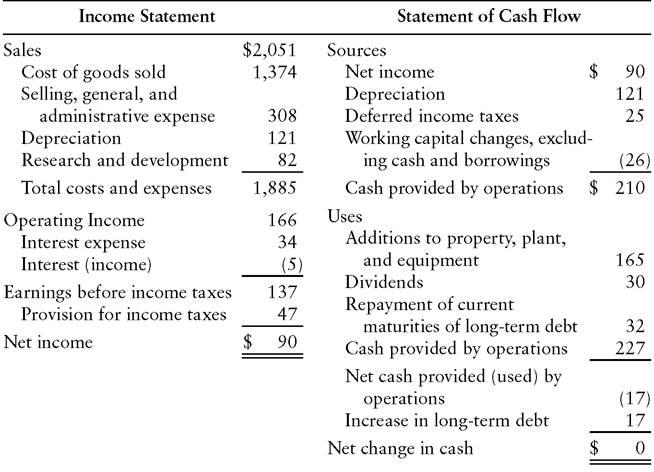
EXHIBIT 12.10 Sensitivity Analysis Projected Financial Statements
Colossal Chemical Corporation
Year Ended December 31, 2001 ($000 omitted)
Base Case (Exhibit 12.2) Sales Growth Assumption Reduced from 6% to 3% (No improvement in gross margin over preceding year)
Balance Sheet
projections, or “point forecast.” Instead, they will assess the risks and potential rewards in light of a range of possible outcomes.
Exhibit 12.10 illustrates how the analyst can modify the underlying assumptions and then observe the extent to which projected ratios will be altered.
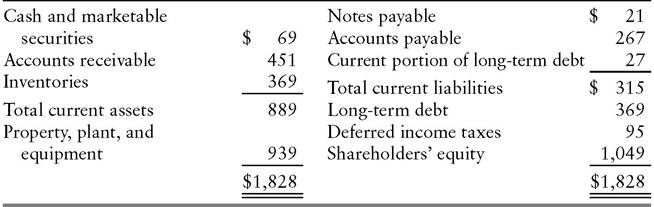
This process is known as sensitivity analysis. In the example, the analyst projects a sales increase over the preceding year of just 3%. That is one-half the growth rate assumed in the base case (the most probable scenario) represented by Exhibit 12.2. The less optimistic sales forecast implies a less robust economy than assumed in the base case. For example, the analyst may assume no real growth and a 3% inflation rate. In the revised scenario, the analyst assumes that chemical producers will have no opportunity to increase their gross margins over the preceding year. Keeping the other assumptions intact, the revised projections show smaller increases, relative to the base case, in net income, shareholders’ equity, and funds provided by operations. Long-term debt declines more slowly under the new assumptions.Using Exhibit 12.10’s revised statements, the analyst can recalculate Exhibit 12.9’s credit quality measures as shown in Exhibit 12.11. Under the
EXHIBIT 12.11 Trend of Credit Quality Comparison
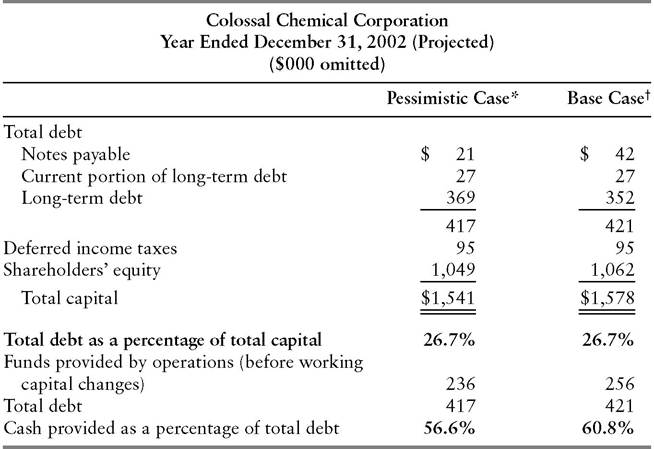
*From Exhibit 12.10.
tFrom Exhibit 12.9.
new, more pessimistic sales growth and gross margin assumptions, projected funds provided by operations represent 56.6% of total debt. The implied improvement over 2001 is smaller than indicated by the 60.8% ratio projected in the base case. Interestingly, though, total debt as a percentage of total capital is unaffected by the changed assumptions, measuring 26.7% in both the base and the p essimistic cases. Although the addition to retained earnings (and hence growth in shareholders’ equity) is smaller in the pessimistic case, so is the need for new working capital to support increased sales.
The borrowing need is therefore reduced, offsetting the slower growth in equity.To complete the analysis, an investor or lender will also want to project financial statements on an optimistic, or best-case, scenario. Sample assumptions for a three-scenario sensitivity analysis might be:
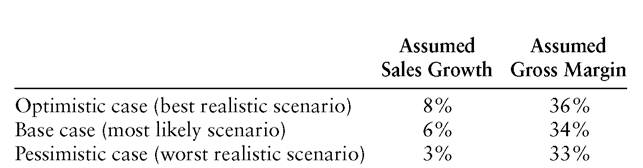
Note that the assumptions need not be symmetrical. The optimistic case in this instance assumes sales only two percentage points higher than the base case, whereas the pessimistic case reduces base case sales by three percentage points. The analyst simply believes that the most likely scenario embodies more downside than upside.
Other assumptions can be modified as well, recognizing the interaction among the various accounts. Colossal Chemical may have considerable room to cut its capital spending in the short run if it suffers a decline in funds provided by operations. A projection that ignored this financial flexibility could prove overly pessimistic. Conversely, the assumption that a company will apply any surplus funds generated to debt reduction may produce an unrealistic projected capital structure. Particularly in a multiyear projection for a strong cash generator, the ratio of debt to capital may fall in the later years to a level that the company would consider excessively conservative. In such cases, it may be appropriate to alter the assumption from debt retirement to maintenance of a specified leverage ratio. Surplus cash will thus be applied to stock repurchase to the extent that not doing so would cause the debt component of capital to fall below a specified percentage.
In addition to creating a range of scenarios, sensitivity analysis can also enable the analyst to gauge the relative impact of changing the various assumptions in a projection.
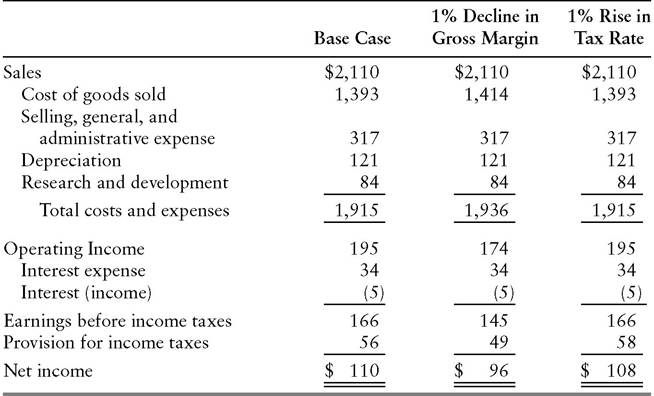
Contrast, for example, the impact of a I% change in gross margins with the impact of a 1% change in the tax rate on Colossal Chemical’s income statement. Exhibit 12.12 shows the effects of these two changes in assumptions on the projected income statement in Exhibit 12.2, holding all other assumptions constant. The sensitivity of net income to a 1% change in gross margins is $14 million ($110 million minus $96 million), all other things being equal. A 1% change in the tax rate, on the other hand, affects net income by just $2 million, all other things again being equal.This type of analysis is popular among investors. They may, for example, estimate the impact on a mining company’s earnings, and hence on its stock price, of a 10-cent rise in the price of a pound of copper. Another application is to identify which companies will respond most dramatically to some expected economic development such as a drop in interest rates. A rate decline will have limited impact on a company for which interest costs represent a small percentage of expenses. The impact will be greater on a company with a large interest cost component and with much of its debt at floating rates. (This assumes the return on the company’s assets is not similarly rate-sensitive.)
EXHIBIT 12.12 Sensitivity Analysis: Impact of Changes in Selected Assumptions on Projected Income Statement
Colossal Chemical Corporation
Year Ended December 31, 2002 ($000 omitted)
Alluring though it may be, sensitivity analysis is a technique that must be used with caution. As suggested, it generally isolates a single assumption and proceeds on the basis that all other things remain equal. In the real world, this is rarely the case. When sales fall, typically, so do gross margins. The reason is that declining capacity utilization puts downward pressure on prices. Similarly, rising interest rates do not affect only interest expense and interest income. Higher rates depress the level of investment in the economy, which can eventually depress the company’s sales.