THE PRiCE-EARNiNGS RATIO
Although the dividend-discount model is an intuitively satisfying approach to valuing a common stock, it is not the most convenient method of comparing one stock’s value with another’s.
Better suited to that task is the priceearnings ratio, alternately known as the P/E ratio or earnings multiple:![]()
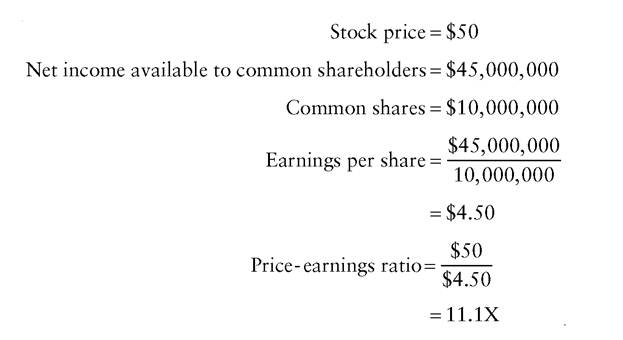
Based on this formula, Wolfe Food Company (see preceding section) has a price-earnings ratio of:
To understand how the price-earnings ratio may be used to compare companies with one another, consider a competitor of Wolfe Food Company,
EXHIBIT 14.2 Selected Financial Data for Grubb & Chao
| Net income available to common shareholders Dividends to common shareholders Common shares outstanding Expected annual growth in earnings Investors’ required rate of return, given predictability of company’s earnings Current stock price | $54,000,000 $18,000,000 15,000,000 10% 13% $48.75 |
Grubb & Chao (Exhibit 14.2).
Grubb & Chao has the same expected earnings growth rate as Wolfe (10%) and is assigned the same required rate of return (13%). Its price-earnings ratio, however, is higher than Wolfe’s (13.5X vs. 11.1X ):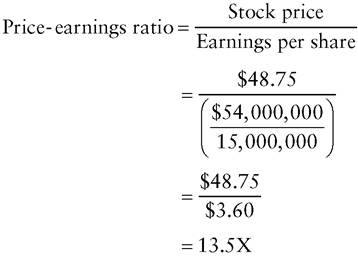
Based on the information provided, an investor would regard Wolfe as a better value than Grubb & Chao. This conclusion proceeds from applying the dividend-discount model to the latter’s numbers:
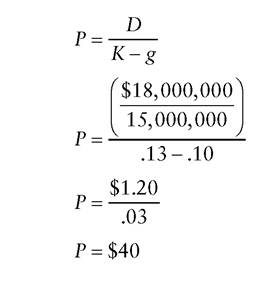
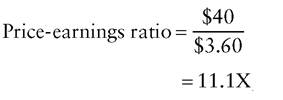
The price thus derived is lower than the actual price of $48.75, implying an overvaluation by the market. Observe as well that the “correct” price for Grubb & Chao produces the same price-earnings ratio as calculated for Wolfe Food Company:
P/E-based value comparisons can go well beyond this sort of company-to- company matchup. The analyst can rank all the companies within an industry (Exhibit 14.3), then judge whether the variations in price-earnings ratios appear justified, or whether certain companies seem misranked. Note that the table ranks companies on the basis of actual earnings over the preceding four quarters, rather than estimated earnings for the coming year, another
EXHIBIT 14.3 Companies within an Industry Ranked by Price-Earnings Ratio: Cosmetics and Personal Care Industry—September 2001
| Company | Share Price Divided by Estimated 2001 Earnings per Share |
| Colgate-Palmolive | 29.06 |
| Gillette | 25.00 |
| Estee Lauder | 24.71 |
| Avon Products | 22.58 |
| Chattem | 19.37 |
| Inter Parfums | 18.75 |
| Alberto-Culver A | 17.47 |
| Del Laboratories | 16.27 |
| DSG International | 15.31 |
| Paragon Trade | 9.36 |
| CCA Industrie | 5.42 |
| Parlux Fragrance | 5.38 |
| 4.35 |
Source: Bloomberg.
typical format employed in P/E ratio comparisons. Earnings exclude both extraordinary and nonrecurring items (see Chapter 3).
Earnings per share are calculated on a diluted basis by taking into account the possibility that new shares will be created through conversion of outstanding convertible securities.