Carbon cycles dynamically at the global scale
Carbon (C) is critically important for life because of its role in energy transfer and the construction of biomass (see Concept 5.2 and Concept 20.1). At a global scale, C that is actively cycling is relatively dynamic, moving between atmospheric, terrestrial, and oceanic pools relatively quickly (over weeks to decades).
It is important that we understand the global C cycle because changes in the fluxes of C among these pools are influencing Earth's climate system. Carbon in the atmosphere occurs primarily as carbon dioxide (CO2) and methane (CH4). As we saw in Chapter 2, both of these greenhouse gases influence atmospheric absorption of infrared radiation and its reradiation from Earth's surface. Thus, any changes in the atmospheric concentrations of these gases can have profound effects on the global climate, as we will see later in this chapter.There are four major global pools of C: atmosphere, oceans, land surface (including soils and vegetation), and sediments and rock (FIGURE 25.3) (Schlesinger and Bernhardt 2020). The largest of these pools is the combination of sediments and rock, which contain 99% of global C. The C in this pool is found primarily in the form of carbonate minerals and organic compounds. It is the most stable of the major pools, taking up and releasing C on geologic time scales.
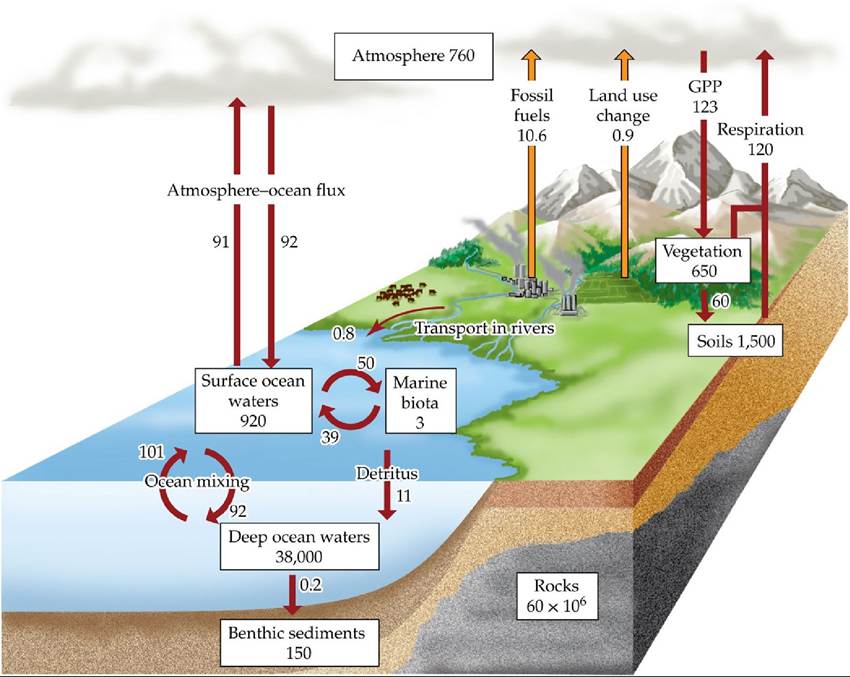
FIGURE 25.3 TheGlobalCarbonCycle Boxes represent major pools of C, measured in petagrams (1 Pg = 1015 g). Arrows represent major fluxes of C, measured in petagrams per year; anthropogenic fluxes are shown in orange. Note that the largest fluxes are terrestrial gross primary production (GPP) and respiration.
How would deforestation influence the magnitude of carbon fluxes?
(After W. H. Schlesinger and E.S.
Bernhardt. 2013. Biogeochemistry: AnAnalysis of Global Change, 3rd eds. Academic Press: Cambridge, MA; F. S. Chapin et al. 2002. Principles of Terrestrial Ecosystem Ecology. Springer-Verlag: New York; P. Ciais et al. 2013. In Climate Change 2013: The Physical Science Basis, T. F. Stocker et al. [Eds.], pp. 466-570. Cambridge University Press: Cambridge.) View larger imageThe oceanic pool consists of two main components: surface waters (to depths of 75-200 m), where most marine biological activity occurs, and deeper, colder waters. Carbon dioxide dissolves in ocean water because of the concentration gradient between the atmosphere (which has a higher concentration) and the ocean (which has a lower concentration). There is relatively little mixing between ocean surface waters and deeper waters, although C is transferred between them by the sinking of detritus and carbonate shells of marine organisms and by the downwelling of polar ocean currents described in Concept 2.2. Most of the C in the oceans (>90%) is in the deeper waters. Some flux from this deep ocean pool occurs when upwelling brings carbon-enriched water to the surface, releasing CO2 into the atmosphere.
The terrestrial pool, which includes vegetated and nonvegetated land surfaces and their associated soils, is the largest pool of biologically active C. The soil pool contains approximately twice as much C as the vegetation pool. The terrestrial pool exchanges C with the atmospheric pool primarily through photosynthetic uptake of CO2 by plants and respiratory CO2 release by plants and heterotrophs. Prior to the Industrial Revolution that began in the early nineteenth century, the exchanges between these two pools were roughly equal, with no net change in atmospheric CO2.
As a result of the rapid growth of the human population over the past 200 years and associated industrial and agricultural development, there has been an increase in the release of C to the atmosphere from the terrestrial pool.
This anthropogenic (human-generated) release of C is the result of land use change —mainly forest clearing for agricultural development—and the burning of fossil fuels. Prior to the mid-nineteenth century, deforestation was the largest contributor to anthropogenic C release to the atmosphere. Removing the forest canopy warms the soil surface, increasing rates of decomposition and heterotrophic respiration. Burning of the trees also releases CO2, as well as small amounts of carbon monoxide (CO) and CH4, into the atmosphere. During the last half of the twentieth century, deforestation for agricultural development shifted from the mid-latitudes of the Northern Hemisphere to the tropics.The rate of anthropogenic emission of C into the atmosphere has continued to increase in recent decades. In 1970, anthropogenic CO2 emissions added C to the atmosphere at a rate of 4.1 petagrams (1 Pg = 1015 g) per year; by 2018, this rate had almost tripled to 11.5 Pg C per year. Today, burning of fossil fuels accounts for approximately 92% of the anthropogenic C flux to the atmosphere; the remaining 8% is associated with deforestation. Approximately half of these anthropogenic CO2 emissions are taken up by the oceans and terrestrial biota. This proportion will decrease with time, however, as the uptake of CO2 by terrestrial and marine ecosystems will not keep pace with the rate of emissions to the atmosphere (IPCC 2021).
Emissions of CH4 to the atmosphere from the terrestrial pool have also increased in the past two centuries as a result of human activities. Although atmospheric concentrations of CH4 are much lower than those of CO2, even small increases in CH4 could influence the global climate because it is 25 times more effective as a greenhouse gas per molecule than CO2. Methane is emitted naturally by anaerobic methanogenic archaea that live in wetlands and shallow marine sediments.
Methanogenic archaea in the rumens of ruminant animals are also a source of atmospheric CH4. Anthropogenic emissions of CH4 have doubled since the early nineteenth century as a result of the processing and burning of fossil fuels, agricultural development (primarily rice, which is grown in flooded fields), burning of forests and crops, and livestock production (IPCC 2021). As a result, atmospheric CH4 concentrations have more than doubled over the past two centuries.The process of photosynthesis is sensitive to the concentration of CO2 in the atmosphere. As a result, photosynthesis has the potential to increase as anthropogenic CO2 emissions increase, primarily in plants with the C3 photosynthetic pathway (see Concept 5.3). Experiments have shown, however, that for some herbaceous plants, these increases may be short-term because the plants may acclimate to elevated CO2 concentrations (Pastore et al. 2019). For other plants, such as forest trees, increases in photosynthetic rates may be more sustained.
It is extremely important that we understand the response of forest ecosystems to elevated CO2 concentrations. Because much of terrestrial net primary production (NPP), and thus C uptake, occurs in these ecosystems, their response will have a profound effect on the fate of anthropogenic CO2 emissions. However, it is difficult to manipulate atmospheric CO2 concentrations experimentally in an intact forest. In one successful approach, called free-air CO2 enrichment, or FACE, researchers inject CO2 into the air through vertical pipes surrounding stands of trees while monitoring the atmospheric concentration of CO2 within the experimental stands. The rate of CO2 injection is controlled to maintain a relatively constant elevated level.
One of the first FACE experiments was initiated by Evan DeLucia and his colleagues to investigate the ecosystem effects of elevated CO2 concentrations in a young loblolly pine (Pinus taeda) forest in North Carolina (DeLucia et al.
1999) (FIGURE 25.4). The experiment was initiated in 1997, when three plots exposed to elevated CO2 concentrations and three control plots exposed to ambient CO2 concentrations were established. The researchers used measurements of tree basal area to estimate aboveground NPP and repeated collections of soil cores to estimate fine root growth and belowground NPP. DeLucia and his colleagues found that the elevated CO2 concentrations increased the overall NPP of the forest by 25%. Input of C into the soil, from both aboveground litter and belowground fine root turnover, also increased. The results of this experiment indicated that forests may be an important sink for anthropogenic CO2. However, DeLucia et al. suggested that their young forest stand represents the upper limit of potential CO2 uptake and that older forests, and forests with lower water and nutrient supplies, may not have as great a capacity to take up CO2. Results from other FACE experiments in forest ecosystems have found similar responses to elevated CO2 concentrations (an average increase in NPP of 23%; Norby et al. 2005). The greater productivity observed in forests in the Northern Hemisphere over the past five decades may be related in part to elevated atmospheric CO2 concentrations (Graven et al. 2013), verifying the predictions of the FACE experiments.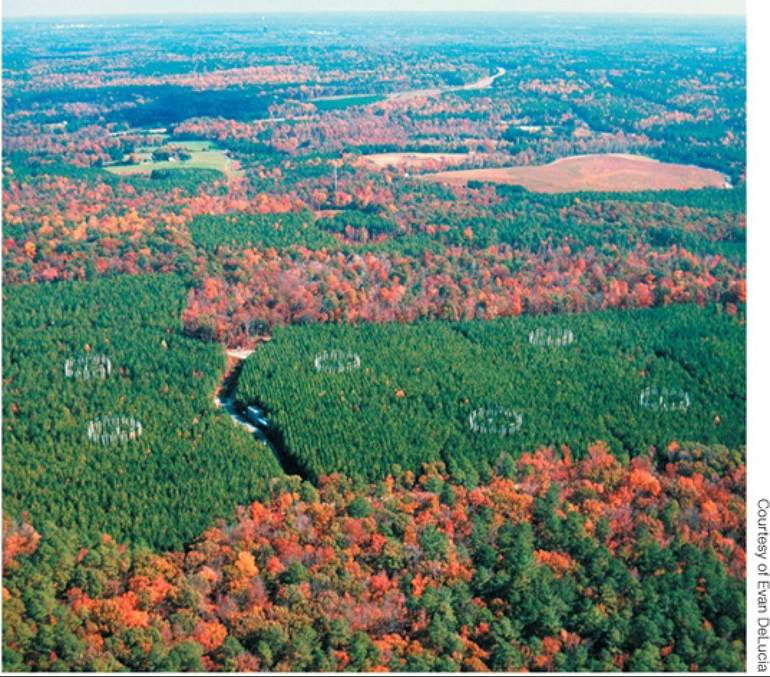
FIGURE 25.4 AFACEExperiment The circles visible in this aerial photo are free-air CO2 enrichment (FACE) treatment rings in a loblolly pine (Pinus taeda) forest in the Duke Forest in North Carolina. Carbon dioxide is released from plastic pipes surrounding treatment plots at a rate calculated to raise the CO2 concentration to 200 ppm above ambient atmospheric CO2 concentrations. View larger image
Changing atmospheric CO2 concentration directly alters the acidity (pH) of the oceans by affecting the rate at which CO2 diffuses into seawater.
Greater diffusion of CO2 into seawater enhances the formation of carbonic acid, which lowers the pH of the seawater:CO2 + H2O = H2CO3 (carbonic acid) = H1+ HCO3- (bicarbonate) = 2H+ + CO32- (carbonate)
During the past century, ocean acidity has increased by about 30%. Further increases have been forecast using model simulations incorporating the expected increases in anthropogenic CO2 emissions over the twenty-first century (Bopp et al. 2013). The predicted increases will have two negative effects on marine organisms that form protective external shells from calcium carbonate, including corals, mollusks, and many plankton. First, the increase in acidity will dissolve the existing shells of the organisms. Second, lower concentrations of carbonate in seawater will decrease the organisms' ability to synthesize shells (Feely et al. 2004; Orr et al. 2005). Between 1990 and 2009, the rate of formation of calcium carbonate by corals on Australia's Great Barrier Reef declined by 14%, an amount consistent with observed decreases in the pH of seawater (FIGURE
25.5) (De'ath et al. 2009). Both effects will increase mortality and lower the abundances of marine organisms that rely on calcium carbonate, altering the diversity and function of marine ecosystems. Under the current CO2 emissions rate the majority of coral reefs will not be able sustain their carbonate structure by 2100 (Cornwall et al. 2021). (Make your own prediction of the future of ocean pH and its effect in ANALYZING DATA 25.1.)
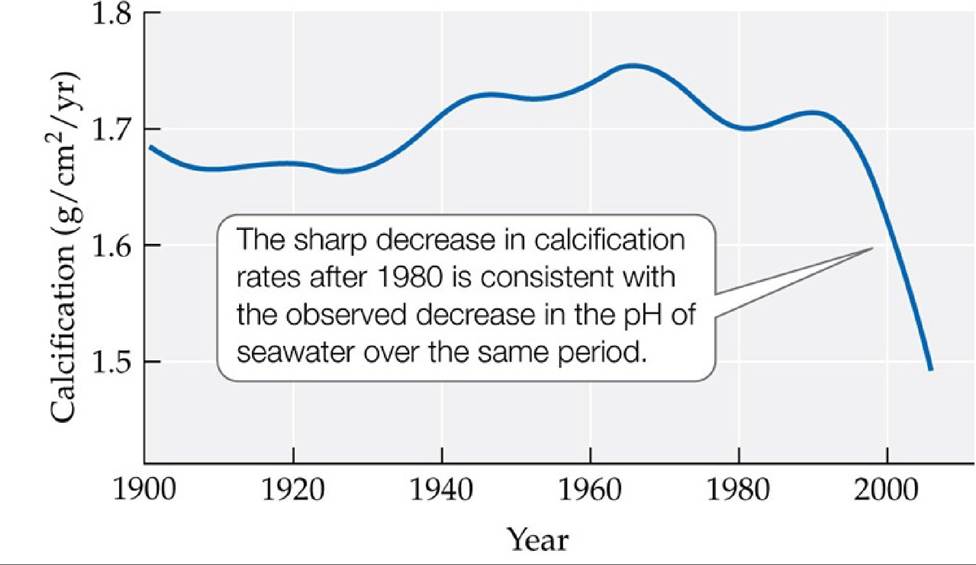
FIGURE 25.5 Rates of Calcification of Corals on Australia’s Great Barrier Reef, 19002005 The sharp decline in calcification rates after 1980 is associated with the combined effects of decreasing pH and increasing ocean water temperature. (After G. De'ath et al. 2009. Science 323: 5910.) View larger image
ANALYZING DATA 25.1
How Much Will Ocean pH Drop in the Twenty-First Century?
Ocean acidification is one of the consequences of increased anthropogenic CO2 emissions. There is already substantial evidence that the pH of ocean waters is declining (FIGURE A). Using information about the chemistry of seawater and diffusion of CO2 from the atmosphere, marine geochemists have projected that the pH of the ocean will have decreased to 7.9 by the year 2050, and by 2100 it will be 7.75, assuming “business as usual” CO2 emissions (a continued increase in the rate of emissions growth) during the twenty-first century (IPCC 2013).*
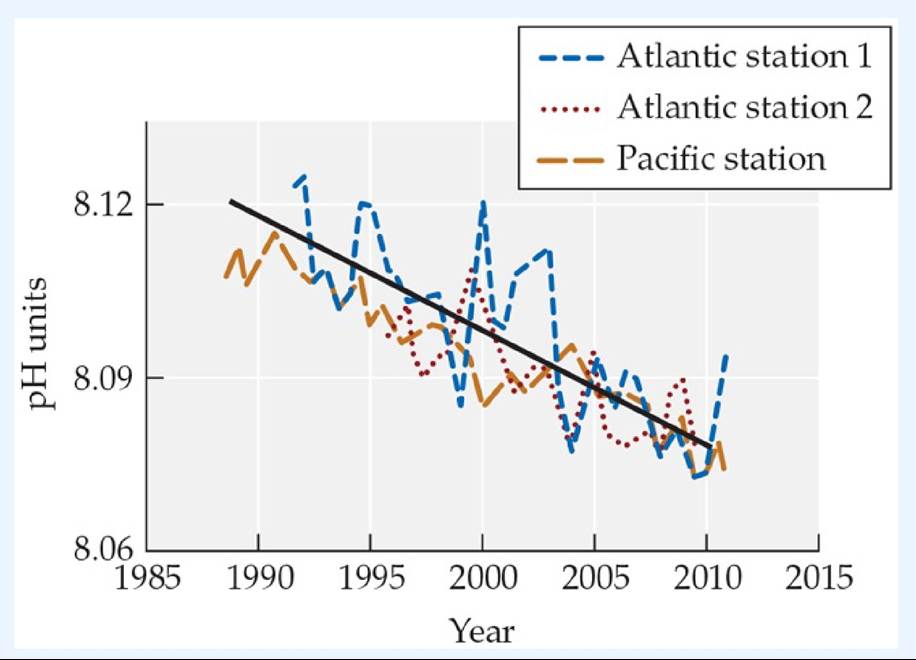
FIGURE A Measured Trend in Ocean pH for Two Stations in the Atlantic Ocean and One in the Pacific Ocean (After IPCC. 2013. Climate Change 2013: The Physical Science Basis. Cambridge University Press: Cambridge.) View larger image
1. Using the data in Figure A, derive a simple linear mathematical relationship or draw a graph to come up with your own prediction of the ocean pH in the years 2050 and 2100. How well do your predictions match up with the IPCC's predictions based on seawater chemistry and continued increases in atmospheric CO2? Your answer should give you a higher estimated ocean pH than the one
predicted in the IPCC report. What might account for this discrepancy?
2.
The decrease in ocean pH is already affecting the calcification rates of marine organisms, as indicated for corals in Figure 25.5. To get a view of what may occur with an even more CO2-rich future, Uthicke et al. (2013)t studied the abundance and diversity of foraminiferans (zooplankton that form carbonate shells) in sediments around natural CO2 seeps in the ocean (FIGURE B). Using your own and the IPCC's prediction of change in ocean pH from Question 1 and the relationships shown in Figure B, estimate the percentage decrease in abundance (density) and species richness of foraminiferans from 2000 (pH = 8.10) to 2050 and from 2000 to 2100.
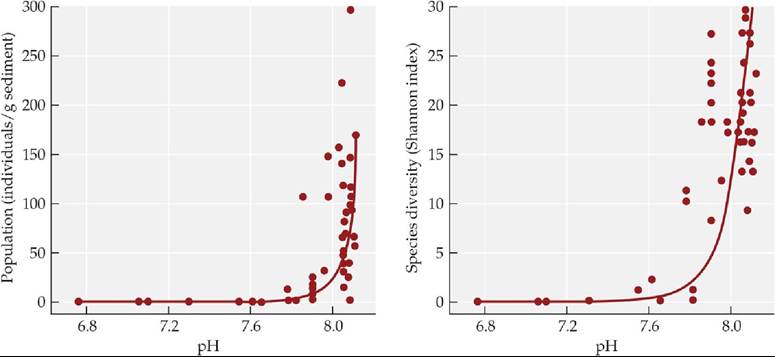
FIGURE B Influence of Ocean pH on the Density and Species Richness
of Foraminiferans near Natural CO2 Seeps (After S. Uthicke et al. 2013. Sci
Rep 3: 1-5.) View larger image
*IPCC. 2013. Climate Change 2013: The Physical Science Basis. Cambridge University Press: Cambridge. Available at the IPPC website: www.ipcc.ch/report/ar5/wg1.
tUthicke, S., P. Momigliano, and K. E. Fabricius. 2013. High risk of extinction of benthic foraminifera in this century due to ocean acidification. Scientific Reports 3: 1-5.
Atmospheric concentrations of C have changed dynamically throughout Earth's history in association with geologic and climate changes. Concentrations of CO2 have ranged from greater than 3,000 parts per million (ppm) 60 million years ago to less than 200 ppm 140,000 years ago. Over the past 400,000 years, variations in the concentrations of CO2 and CH4, as measured in tiny bubbles preserved in polar ice, have followed glacial-interglacial cycles. The lowest CO2 concentrations during this time were associated with glacial periods (FIGURE
25.6). Over most of the past 12,000 years, atmospheric CO2 concentrations remained relatively stable, varying between 260 and 280 ppm. Since the midnineteenth century, however, CO2 concentrations have increased at a rate faster than at any other time over the past 400,000 years (IPCC 2013), reaching values of 415 ppm in 2021. Even if we dramatically decreased our CO2 emissions starting today, atmospheric CO2 concentrations would remain elevated for a long time to come because of a time lag (decades to centuries) in oceanic uptake. The influence of CO2 and CH4 on climate change will be discussed later in this chapter.
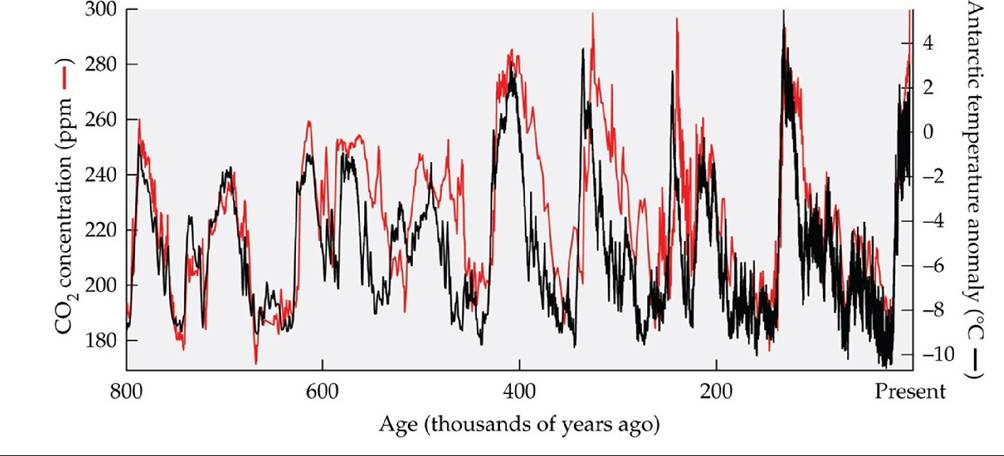
FIGURE 25.6 Changes in Atmospheric CO2 Concentrations over Time Atmospheric CO2 concentrations have varied with temperature over the past 800,000 years. These gas concentrations were measured in bubbles trapped in Antarctic ice; temperatures were estimated using oxygen isotopic analyses (see Ecological Toolkit 5.1). CO2 concentrations in 2019 are 408 ppm. (After D. Luthi et al. 2008. Nature 453: 379-382.) View larger image