Energy flow between trophic levels can be depicted using energy or biomass pyramids
A common approach to conceptualizing trophic relationships in an ecosystem is to construct a stack of rectangles, each of which represents the amount of energy or biomass within one trophic level.
When assembled from lower to higher trophic levels, these rectangles form a trophic pyramid. By portraying the relative amounts of energy or biomass at each trophic level, these pyramids show us how energy flows through the ecosystem.As we have noted, some of the biomass at each trophic level is not consumed, and a proportion of the energy at each trophic level is lost in the transfer to the next trophic level. Therefore, the rectangles in a trophic energy pyramid always decrease in size as we move from one trophic level to the one above it. In terrestrial ecosystems, energy and biomass pyramids are usually similar because biomass is typically a good proxy for energy (FIGURE 21.5A). In aquatic ecosystems, however, the high consumption rates and the relatively short life spans of the primary producers (mainly phytoplankton) can, in some cases, result in a biomass pyramid that is inverted relative to the energy pyramid (FIGURE 21.5B). In other words, the biomass of heterotrophs may be greater at any given time than the biomass of autotrophs. However, the energy produced by the
autotrophs is still greater than that produced by the heterotrophs.
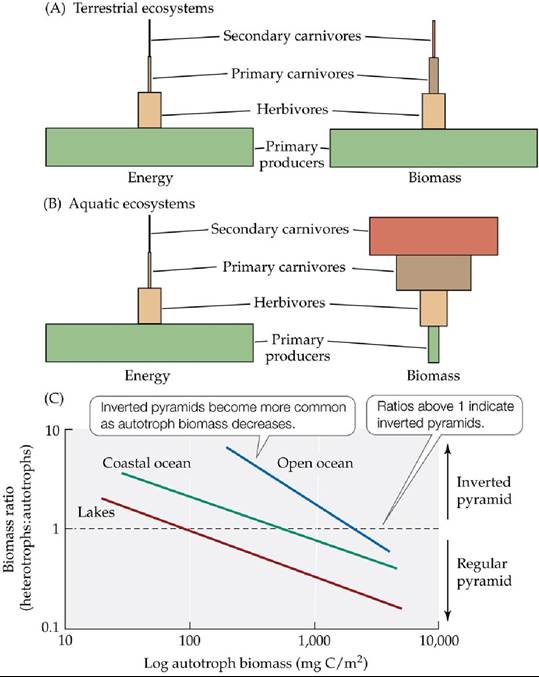
FIGURE 21.5 Trophic Pyramid Schemes (A) In terrestrial ecosystems, energy and biomass pyramids are usually similar. (B) In many aquatic ecosystems, the biomass pyramid is inverted relative to the energy pyramid. (C) Inverted biomass pyramids in aquatic ecosystems are most common in nutrient-poor waters with low autotroph biomass. (A,B after F. S. Chapin et al. 2002. Principles OfTerrestrial Ecosystem Ecology. Springer-Verlag: New York. C after J. M. Gasol et al. 1997. Limnoi Oceanogr 42: 1353-1363.) View larger image
This tendency toward inverted biomass pyramids is greatest where productivity is lowest, such as in nutrient-poor regions of the open ocean (FIGURE 21.5C). The higher proportion of primary consumer biomass relative to producer biomass in these nutrient-poor regions results from a more rapid turnover of phytoplankton, which have higher growth rates and shorter life spans than the phytoplankton of more nutrient-rich waters. Phytoplankton in nutrient-poor regions thus provide a greater energy supply per unit of time (Gasol et al. 1997). In addition, detritus makes a higher proportional contribution to energy flow in these nutrient-poor waters than in nutrient-rich waters.