Extensive life table data exist for people
Many economic, sociological, and medical applications rely on human life table data. Life insurance companies, for example, use census data to construct static life tables that provide a snapshot of current survival rates; they use these data to determine the premiums they charge customers of different ages.
Let's consider two examples of human life tables, one from the United States, the other from Gambia.The U.S. Centers for Disease Control and Prevention periodically release reports that provide life table data for people in the United States. Reports released in 2009 and 2015 provide information on the survivorship (lx), fecundity (Fx), and life expectancy (expected number of years of life remaining) of U.S. females of different ages (TABLE 11.2). To make their interpretation easier, such data can be graphed, as in Figure 11.18, which plots lx data for U.S. females. This curve shows that survival probabilities for U.S. females remain high for many years; in fact, as Table 11.2 reveals, these survival probabilities do not begin to drop sharply until around age 70.
TABLE 11.2 Survivorship, Fecundity, and Years of Life Remaining by Age for U.S. Females
| Age (yr)> x | Survivorship, lx | Fecundity, Fx | Expected no. of years of life remaining (at age x) |
| 0 | 1.0 | 0.0 | 81.8 |
| 1 | 0.994 | 0.0 | 80.5 |
| 5 | 0.994 | 0.0 | 76.6 |
| 10 | 0.993 | 0.0 | 71.6 |
| 15 | 0.992 | 0.004 | 66.7 |
| 20 | 0.991 | 0.203 | 61.7 |
| 25 | 0.989 | 0.511 | 56.9 |
| 30 | 0.986 | 0.578 | 52.0 |
| 35 | 0.982 | 0.479 | 47.2 |
| 40 | 0.977 | 0.232 | 42.4 |
| 45 | 0.970 | 0.046 | 37.8 |
| 50 | 0.958 | 0.003 | 33.2 |
| 55 | 0.940 | 0.0 | 28.8 |
| 60 | 0.915 | 0.0 | 24.5 |
| 65 | 0.880 | 0.0 | 20.3 |
| 70 | 0.828 | 0.0 | 16.5 |
| 75 | 0.752 | 0.0 | 12.9 |
| 80 | 0.640 | 0.0 | 9.6 |
| 85 | 0.485 | 0.0 | 6.9 |
| 90 | 0.292 | 0.0 | 4.8 |
| 95 | 0.119 | 0.0 | 3.3 |
| 100 | 0.027 | 0.0 | 2.3 |
Sources: J.
A. Martin et al. 2009. National Vital Statistics Reports 57. National Center for Health Statistics: Hyattsville, MD; E. Arias. 2015. National Vital Statistics Reports 64. National Center for Health Statistics: Hyattsville, MD.
The data from the United States are in stark contrast to data from Gambia, a country located on the west coast of Africa. Moore et al. (1997) analyzed birth and death records for 3,102 people born in three Gambian villages between 1949 and 1994. They found that the season of birth had long-term effects: individuals born during the “hungry season” (July-October, when food stored from the previous year is in low supply) had lower survivorship as adults than did individuals born at other times of the year (see Figure 11.18). Their data also reveal large differences between the survivorship of people in Gambia and in the United States. For example, only 47% to 62% of Gambians (depending on their season of birth) survived to reach age 45, whereas 97% of U.S. females survived to that age.
A Case Study Revisited
Human Population Growth
Media reports often state that the human population is growing exponentially. As we saw in Figure 11.4, a simple way to determine whether a population is growing exponentially is to plot the natural logarithm of population size versus time. If a straight line results, the population is growing exponentially. When we plot the natural logarithm of human population size versus time for the last 2,000 years, however, we see that our population sizes deviate considerably from the straight line expected in exponential growth (FIGURE 11.19). In fact, as fast as exponential growth is, historically the human population has increased even more rapidly than that.
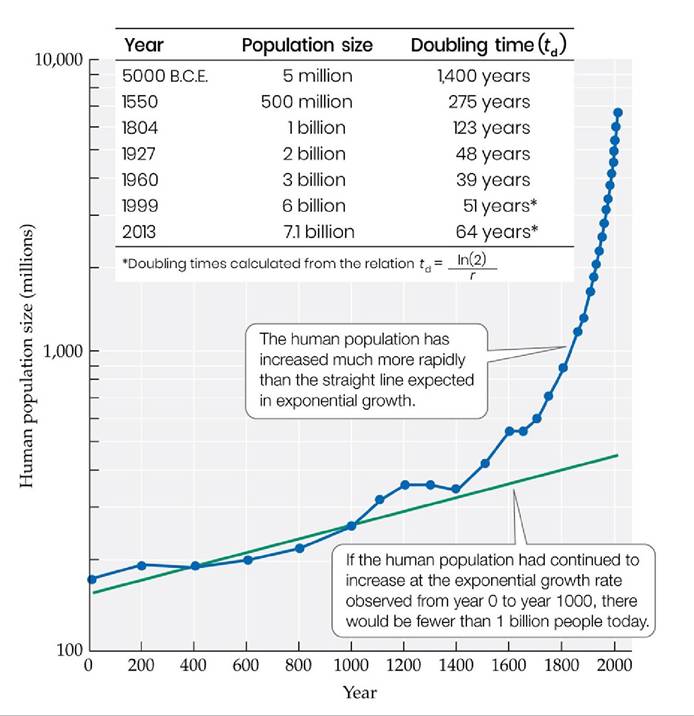
FIGURE 11.19 FasterthanExponential A plot of the logarithm of the human population size over the last 2,000 years differs dramatically from the straight line expected if it were growing exponentially.
View larger imageThe faster-than-exponential nature of human population growth is also evident from historical doubling times for the human population. Recall that in a population that grows exponentially, the doubling time remains constant. However, as shown in the inset of Figure 11.19, the doubling times observed for the human population dropped from roughly 1,400 years in 5000 B.C.E. to a mere 39 years in 1960—again indicating that historically, our population has increased more rapidly than expected of exponential growth.
Projecting into the future, we can predict how long it will take our population to double in size at current rates of growth. To do this, the doubling time is estimated from the relation td = ln(2)∕r (see Equation 11.5), where r is the current growth rate of the human population. Such estimates have shown that the human population was growing most rapidly in the early 1960s, with a doubling time of 32 years. Since then, the doubling time has increased (because r has decreased), reaching 69 years in 2022.
The increase in the doubling time (and the decrease in r) over the past 5 decades indicates that the human population is now growing more slowly than expected in exponential growth. So, returning to the question we asked in the Case Study (whether there would be 14 billion people in 2080), the answer is probably not. U.S. Census Bureau projections indicate that population growth rates are likely to continue to fall over the next 40 years (FIGURE 11.20), leading to a predicted population size of 9.6 billion in 2050 (FIGURE 11.21). Extending that curve out to 2080 suggests that there will be roughly 10 billion people in that year. If these projections turn out to be correct, or nearly so, what will the future hold with that many people? Is 10 billion above the carrying capacity of the human population?
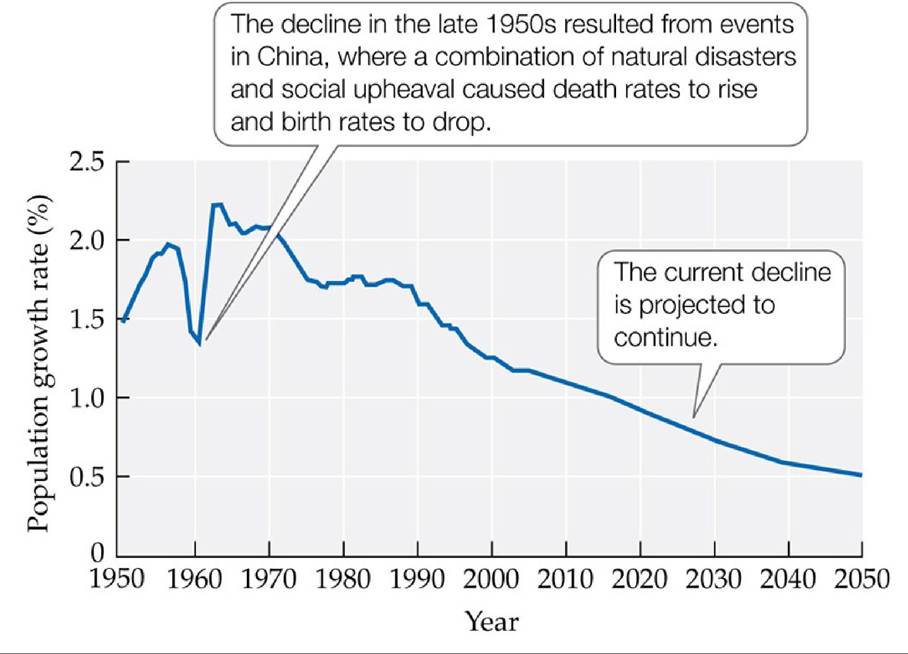
FIGURE 11.20 World Population Growth Rates Are Dropping Annualworld population growth rates have declined since the early 1960s.
(Data from U.S. Census Bureau, International Data Base, June 2011 update.)In 2050, will the human population still be increasing in size? Explain.
View larger image
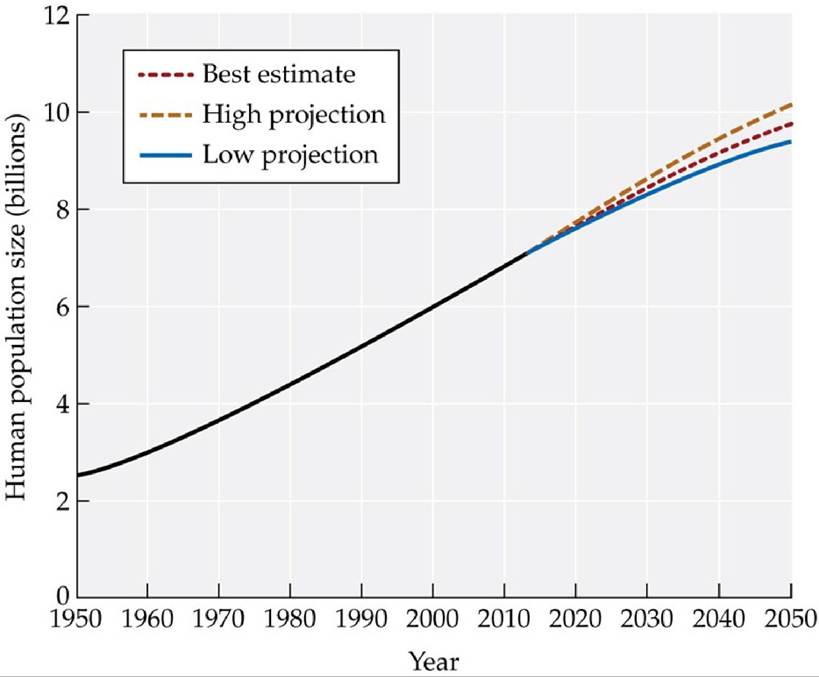
FIGURE 11.21 United Nations Projections of Human Population Size Thehuman population is expected to increase to 9.7 billion by 2050; low and high projections range from 8.3 billion to 10.9 billion.
Using the best-estimate curve shown here and the annual growth rate estimated for the human population in 2050 (see Figure 11.20), approximately how large will our population be in 2051?
(From United Nations, Department of Economic and Social Affairs, Population Division. 2019. World Population Prospects 2019: Data Booklet [ST/ESA/SER.A /424].) View larger image
To answer these questions, we must determine the carrying capacity of the human population, but that is trickier than it may at first appear. Many researchers have estimated the human carrying capacity, obtaining values that range from fewer than 1 billion to more than 1,000 billion (see Cohen 1995). This large variation is due in part to the fact that many different methods—from logistic models to calculations based on crop production and human energy requirements—have been used. In addition, different researchers have made different assumptions about how people would live and how technology would influence our future, assumptions that have a large effect on the estimated carrying capacity.
For example, by using the ecological footprint approach described in this chapter's Connections in Nature, it has been estimated that Earth could support 1.5 billion people indefinitely if everyone used the amount of resources used by people in the United States in 2007 (Ewing et al. 2010). On the other hand, if everyone used the amount of resources used by people in India in 2007, the world could support over 13 billion people. Thus, as we suggested in this chapter's Case Study, issues of human population size and resource use are linked inextricably: more people means that more resources will be used, but the degree to which our growing population affects the environment depends on the amount of resources used by each person.
Connections in Nature
Your Ecological Footprint
When you turn on a light, purchase an appliance, drive a car, or eat fruit imported from another country, you may not think about the effects your actions have on the natural world. How, for example, does driving to the store to get groceries affect forests or coral
reefs?
To answer this question, we must account for the resources required to support our actions. The grains we eat require farmland; the wood products we use require natural forests or plantations; the fish we eat require productive fishing grounds; the machines and appliances we purchase require raw materials and energy to build, as well as energy for their operation. Ultimately, every aspect of our economy depends on the land and waters of Earth. Recognizing this, William Rees proposed that we measure the environmental impact of a population as its ecological footprint, which is the total area of productive ecosystems required to support that population (Rees 1992). The ecological footprint approach turns the carrying capacity concept on its head: instead of asking how many people a given area can support, it asks how much area is required to support a given number of people.
Ecological footprints are calculated from national statistics on agricultural productivity, production of goods, and resource use. The area required to support these activities is then estimated. For example, the land required to support wheat consumption in 1993 by people in Italy was estimated by dividing the amount of wheat consumed (26,087,912 tons) by the amount of wheat produced per unit of land, which was 2.744 tons per hectare (ha). This resulted in 9,507,257 ha, or 0.167 ha per person (Wackernagel et al. 1999). To compare footprint calculations among nations and across different crops, such results are typically converted to global hectares, where a global hectare is defined as a hectare of world-average biological productivity (Kitzes and Wackernagel 2009).
Methods of calculating ecological footprints are still being refined, but results to date are sobering. In 2007, there were 11.9 billion global hectares of productive land available, and the ecological footprint of an average person was 2.7 global hectares (Ewing et al. 2010). These results suggest that Earth could have supported 4.4 billion people (11.9 billion ha/2.7 ha per person) for a long time. In fact, the human population in 2007 was 6.7 billion, more than a 50% overshoot of its carrying capacity. An overshoot of this magnitude indicates that in 2007, environmental resources were being used more rapidly than they could be regenerated, a pattern of use that cannot be sustained.
Similar calculations can be made for nations, cities, and even companies, schools, or individuals (see Review Question 4). In the United States, for example, the average ecological footprint was 8.0 global hectares per person in 2007. Since there were 1,330 million global hectares of productive land available in the nation, this calculation suggests that the carrying capacity of the United States in 2007 was 166 million people (1,330 million ha/8.0 ha per person); the actual population was 309 million, nearly double the carrying capacity.
Human use of resources changes from year to year, depending on population size, per capita rates of resource use, and technology (i.e., the efficiency of production). In addition, the total area of productive ecosystems available to support our activities changes over time because of factors such as gain or loss of farmland, destruction of natural habitat, pollution, and extinctions of species. As a result, our ecological footprint changes over time. People have now begun to use our changing footprint as a way to assess whether our current population size and resource use can be sustained. This approach highlights the fact that all of our actions—what we eat, how big a house we buy, how much we drive or fly, the goods we purchase (e.g., clothes, cars, cell phones)—depend on and affect the natural world.