Life tables can be based on age, size, or life cycle stage
The data that ecologists collect on the patterns of births and deaths for populations can be used to construct life tables. TABLE 11.1 shows a life table using data from the acorn barnacle B.
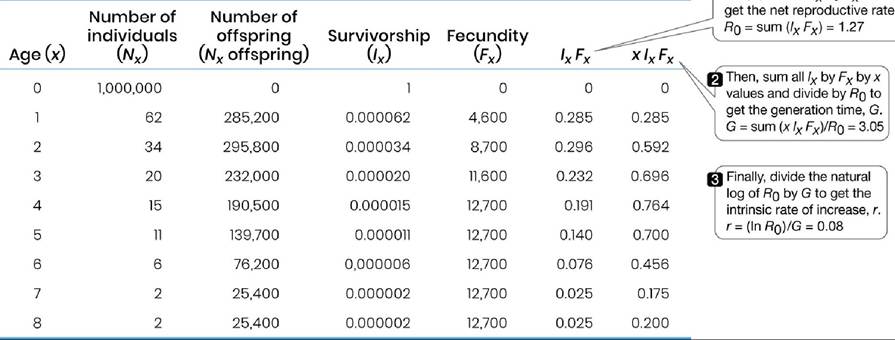
glandula on the shorelines of Scotland. This life table is known as a cohort life table, in which the fate of a group of individuals born during the same time period (a cohort) is followed from birth to death. The two columns on the left show the number of individuals surviving and the number of offspring produced at different ages (x) through time. As the individuals within the cohort die, Nx decreases from 1 million barnacles to only 2 barnacles after 8 years (see Figure 11.17C). The proportion of individuals that survive, known as survivorship (lx), can be calculated by simply dividing Nx by N0, the number of barnacles originally born into the cohort (represented by age 0). In addition, we can calculate the fecundity (Fx), or the mean number of barnacle offspring produced per surviving adult barnacle per age class, by dividing the total number of offspring (Nx offspring) by the number of individuals (Nx) that produce those offspring. Multiplying survivorship (lx) by fecundity (Fx) gives us the number of offspring produced for individuals within a particular age class within the population. The sum of these values for all the age classes gives us the net reproductive rate (R0), which is simply the mean number of offspring produced per individual in the cohort, adjusted for survival:Ro = sum (lxFx)
(11.8)
TABLE ILl________________________________________
Cohort Life Table for Barnacle Balanus g∣andulaa Čτ° es,imεrte thιe Pθr c?Pit?; growth''
*z I rate, r, sum all ∕z by Fy values to
Source: Data from J.H.
Connell. 1970. Ecol Monogr 40: 49-78.σThe life history of barnacles involves releasing larvae into the water column, where they feed and undergo a series of larval stages. Eventually they settle back on the rock and metamorphose into a juvenile barnacle, which grows into a reproductive adult.
If R0 is greater than 1.0, there is a net increase in offspring produced each generation, and assuming the birth and death rates do not change over time, the population should increase exponentially. If R0 is less than 1.0, and individuals are not replaced as they die, the population declines eventually to extinction. If R0 is 1.0, then the births and deaths balance out and the population will not change in size.
We can use R0 to estimate the per capita growth rate, r, of a cohort by scaling R0 to account for the generation time of the cohort. The generation time (G) is the average age of the parents of all the offspring produced within the cohort (see Table 11.1 for equation). To estimate r, we simply divide the natural log (ln) of R0 by G and get 
(11.9)
Note that R0 equals λ when the generation time of the population is equal to 1.
Once we have calculated r from the life table, we can use it (or λ) in our population growth models (Equation 11.2 for geometric growth, Equation 11.4 for exponential growth, or Equation 11.7 for logistic growth) to predict population sizes in the future. In addition, other methods exist to calculate future population growth and size using life table data.
Cohort life tables follow individuals from birth to death as a function of calendar year or life stage (e.g., eggs, larvae, pupae, and adults in insects). This is relatively easy to do if the organisms are easily followed—for example, if they are sessile and short-lived, as we saw in the barnacle example.
However, for organisms that are highly mobile or have long life spans (e.g., trees that live much longer than people), it is hard to observe the fate of individuals from birth to death. In some of these cases, a static life table can be used, in which the survival and reproduction of individuals of different ages during a single time period are recorded. To construct a static life table, one must be able to estimate the ages of the organisms under observation. Estimating ages is difficult in some species, but for others, reliable indicators of age are known, including annual growth rings in fish scales and tree wood and tooth wear in deer. Once ages have been estimated, age-specific birth rates can be determined by counting how many offspring the individuals of different ages produce. Age-specific survival rates can also be determined from a static life table (see Review Question 3), but only if we assume that survival rates have remained constant during the entire time that the individuals in the population have been alive—an assumption that may not be correct.Finally, ecologists and natural resource managers can seek to change the birth or death rates of certain populations, with the ultimate goal of decreasing the size of a pest population or increasing the size of an endangered population. An efficient way to reach this goal is to identify the age-specific birth or death rates that most strongly influence the population growth rate. In one such example, life table data indicated that the most effective way to increase the growth rates of endangered sea turtle populations was to increase the survival rates of juvenile and mature turtles—a change from the common practice of protecting newborns (Ecologicaltoolkit ιι.i).
Z
ECOLOGICAL TOOLKIT 11.1
Estimating Population Growth Rates in a Threatened Species
Loggerhead sea turtles (Caretta caretta) are large marine turtles that lay eggs in nests that adult females dig into sandy beaches.
Newly hatched baby turtles weigh just 20 g (0.04 pounds) and have a shell length of 4.5 cm (1.8 inches). They reach adulthood after 20-30 years, at which point they can weigh up to 227 kg (500 pounds) and have a shell length of 122 cm (4 feet).Loggerhead sea turtles have been listed as a threatened species under the U.S. Endangered Species Act since 1978. Many species eat loggerhead eggs or hatchlings, and the juveniles and adults are eaten by large marine predators such as tiger sharks and killer whales. Loggerheads also face threats from people, including the destruction of nesting sites by development, as well as commercial fisheries (in whose nets sea turtles can become trapped and drown).
Early efforts to protect loggerhead sea turtles focused on the egg and hatchling stages, which suffer extensive mortality and are relatively easy to protect. To evaluate this approach, Crouse et al. (1987) and Crowder et al. (1994) used life table data to determine how the existing exponential growth rate of r = -0.05 would change if new management practices improved the survival rates of turtles of various ages (FIGURE A). Their findings suggested that even if
hatchling survival rates were increased by 90%, loggerhead populations would continue to decline. Instead, they found that the population growth rate was most responsive to increasing the survival rates of older juveniles and adults.
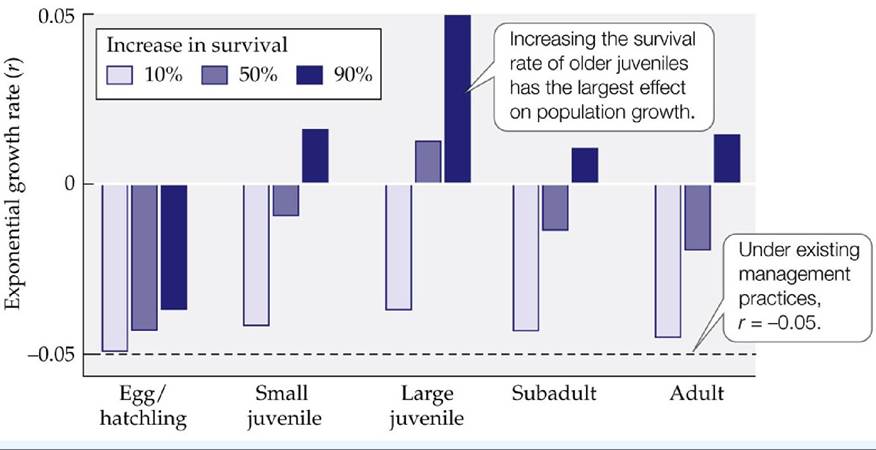
FIGURE A Management Practices and Sea Turtle Population Growth Rates Researchers used life table data to identify the age-specific death rates that most strongly influenced the population growth rate of loggerhead sea turtles. (After L. B. Crowder et al. 1994. Ecoi Appi 4: 437-445.) View larger image
The results obtained by Crouse, Crowder, and their colleagues prompted the enactment of laws requiring turtle excluder devices (TEDs) to be installed in shrimp nets (FIGURE B). A TED functions as a hatch through which juvenile and adult sea turtles can escape when caught in a net. Shrimp nets were singled out because the data suggested that shrimping accounted for more loggerhead deaths (5,000-50,000 deaths per year) than all other human activities combined.
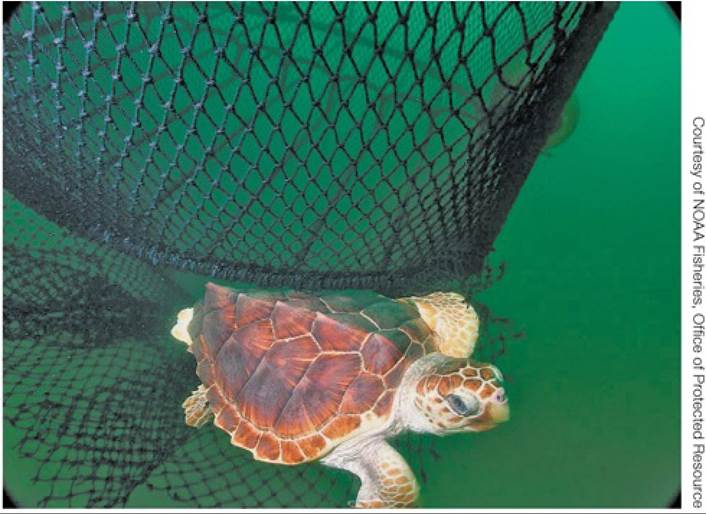
FIGURE B Turtle Excluder Device (TED) View larger image
Loggerheads are most easily counted when they nest, yet it takes 20-30 years for turtles to become sexually mature. As a result, it will be decades before we know whether TED regulations help turtle populations to increase in size. But early results are encouraging: the number of turtles killed in nets dropped substantially (up to 94%) after the TED regulations were implemented (Finkbeiner et al. 2011).