There are three types of survivorship curves
As discussed previously, different age classes of populations have different rates of survivorship. Survivorship data can be graphed as a survivorship curve. In such a curve, survivorship data are used to plot the numbers of individuals from a hypothetical cohort (typically, of 1,000 individuals) that will survive to reach different ages.
Results from studies on a variety of species suggest that survivorship curves can be classified into three general types, which indicate the life stages at which high rates of mortality are most likely to occur (FIGURE 11.17). In populations with a type I survivorship curve, newborns, juveniles, and young adults all have high survival rates; death rates do not begin to increase until old age. Examples of populations with type I survivorship curves include U.S. females (FIGURE 11.18) and Dall mountain sheep (Figure 11.17A). In populations with a type II survivorship curve, individuals have an approximately constant chance of surviving from one age to the next throughout their lives. Some bird species have a type II survivorship curve (Figure 11.17B), as do mud turtles (after their second year), some fishes, and some plant species. Finally, in populations with a type III survivorship curve, individuals die at very high rates when they are young, but those that reach adulthood survive well later in life. Type III survivorship curves—the most common type observed in nature—are typical of species that produce large numbers of young. Examples include giant puffballs, some plants, most insects, and many marine invertebrates, including the acorn barnacle Balanus glandula (Figure 11.17C). In this species, a population size of a million juveniles declines precipitously to 62 individuals after 1 year and to 2 individuals after 8 years.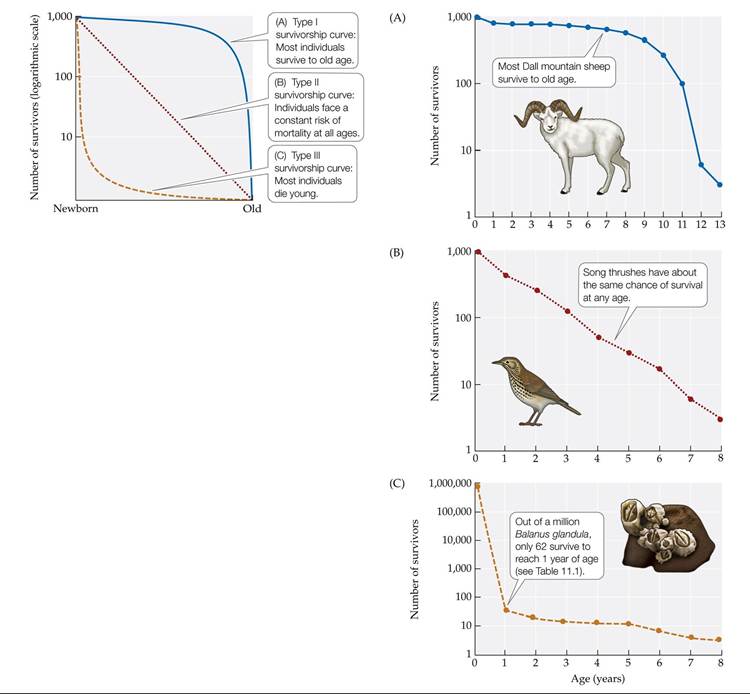
FIGURE 11.17 Three Types of Survivorship Curves Ecologistsrecognizethreegeneral types of survivorship curves. Survivorship curves are given for (A) the Dall mountain sheep, (B) the song thrush, and (C) the acorn barnacle Balanus glandula.
Notice that the number of survivors has been plotted on a logarithmic scale.What percentage of Dall mountain sheep survive to age 11?
(A,B after E. S. Deevey. 1947. Q Rev Biol 22: 283-314; C after J. H. Connell. 1970. Ecol Monogr 40: 4978.) View larger image
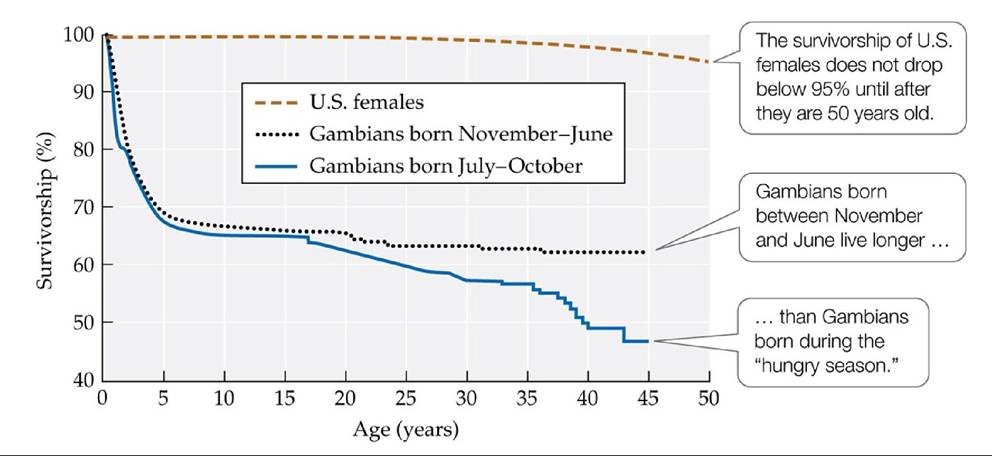
FIGURE 11.18 Survivorship Varies among Human Populations IntheUnitedStates, survivorship (lχ) does not drop greatly until old age. In Gambia, many people die at much younger ages.
The proportion of Gambians born in the hungry season who live to age 45 is roughly the same as the proportion of U.S. females who live to what age (see Table 11.2)?
(U.S. data from E. Arias. 2015. National Vital Statistic Reports 64. National Center for Health Statistics: Hyattsville, MD; Gambia data from S. E. Moore et al. 1997. Nature 388: 434.) View larger image
We have discussed type I to III survivorship curves as if they were constant for each species, but that is not necessarily the case. Survivorship curves can vary among populations of a species, between males and females in a population, and among cohorts of a population that experience different environmental conditions (see Figure 11.18). In fact, by comparing birth and death rates in groups of individuals that experience different conditions, we can assess the effects of those conditions on populations. As we'll see in the next section, we can also use birth and death rates in a life table analysis to predict how the size and composition of a population will change over time.