Extinction and colonization rates often vary among patches
As the impact of Lande's work on the northern spotted owl suggests, the metapopulation approach has become increasingly important in applied ecology. But metapopulations in the field often violate the assumptions of Levins's model.
For example, patches often differ considerably in population size and in the ease with which they can be reached by dispersal. As a result, extinction and colonization rates may vary greatly among patches. Therefore, most ecologists use more complex models (see Hanski 1999) when addressing practical questions in the field.Consider the skipper butterfly Hesperia comma. In the early 1900s, this butterfly was found on grazed calcareous grasslands (i.e., grasslands growing in alkaline soils found on limestone or chalk outcrops) throughout a broad range of the United Kingdom. Starting in the 1950s, however, calcareous grasslands became overgrown because the numbers of cattle and other important grazers were reduced. As a result, H. comma populations began to decline. By the mid-1970s, the butterfly was found in only 10 restricted regions, a very small fraction of its original range.
Things began to pick up for the butterfly in the early 1980s. By this time, habitat conditions had improved because livestock had been reintroduced. Surveying these grasslands in 1982, Chris Thomas and Teresa Jones documented the locations of all patches containing H. comma populations and of all patches that appeared suitable for, but were not occupied by, H. comma. To determine the fate of each occupied and unoccupied patch over time, they surveyed the patches again in 1991 and noted which ones were occupied at that time. Their results highlight two important features of many metapopulations: isolation by distance and the effect of patch area.
Isolation by distance occurs when patches located far from occupied patches are less likely to be colonized than are nearby patches.
In H. comma, distance from occupied patches had a strong effect on whether patches vacant in 1982 were colonized by 1991: few patches separated by more than 2 km from an occupied patch were colonized during that period (FIGURE 9.17). Patch area also affected the chance of colonization: the majority of colonized patches were at least 0.1 ha in size. Patch area may have affected colonization rates directly because small patches may be harder for the butterflies to find than large patches. Alternatively, H. comma might have colonized small patches, but thensuffered extinction in those patches by 1991 due to problems associated with small population size; such patches would appear never to have been colonized because the sites were not sampled between 1982 and 1991.
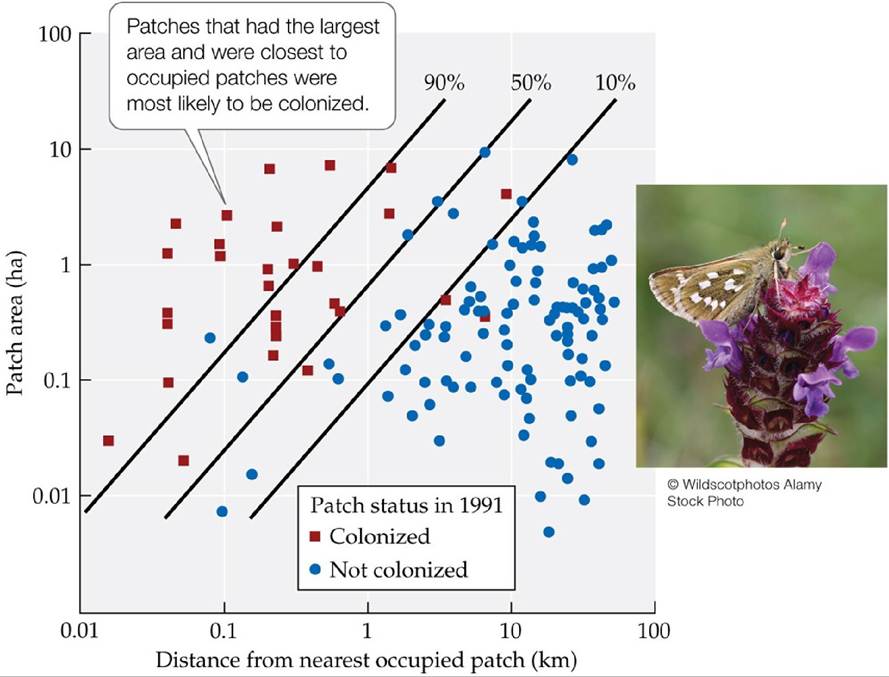
FIGURE 9.17 ColonizationinaButterflyMetapopulation Colonizationofsuitablehabitat from 1982 to 1991 by the skipper butterfly Hesperia comma was influenced by patch area and patch isolation (distance to the nearest occupied patch). Each square or circle represents a patch of suitable habitat that was not occupied by H. comma in 1982. The lines show the combinations of patch area and patch isolation for which there was a 90%, 50%, and 10% chance of colonization (as calculated from a statistical analysis of the data).
Based on these results, estimate the chance of colonization for a 1-ha patch located 1 km away from the nearest occupied patch.
(After C. D. Thomas et al. 1992. Oecologia 92: 563-567; C. D. Thomas and T. M. Jones. 1993. J Anim Ecol 62: 472-481.) View larger image
Among patches occupied in 1982, Thomas and Jones found that the chance of extinction was highest in small patches (most likely because small patches tend to have small population sizes) and in patches that were far from another occupied patch. Isolation by distance can affect the chance of extinction because a patch that is near an occupied patch may receive immigrants repeatedly, which may increase the patch population size and make extinction less likely.
This tendency for high rates of immigration to protect a population from extinction (by reducing the problems associated with small population size) is known as the rescue effect (Brown and Kodric-Brown 1977). In Chapter 24, we discuss in more detail the role of metapopulation dynamics in the conservation of species experiencing habitat fragmentation.A Case Study Revisited
From Kelp Forest to Urchin Barren
When sea urchins graze kelp so heavily that kelp forests are replaced by urchin barrens, what happens next? We might expect that the urchins would starve because they have destroyed their food source. Field studies show that urchin barrens can persist for years on end, however, because urchins can use food sources other than kelp, including benthic diatoms, less preferred algae (including hard, encrusting forms that cover rock surfaces), and detritus. When food is extremely scarce, urchins can reduce their metabolic rate, reabsorb their sex organs (forgoing reproduction but increasing their chances of survival), and absorb dissolved nutrients directly from seawater.
As tough and resilient as urchins are, they are vulnerable to predation by sea otters (Enhydra lutris), which function as impressive urchin-eating machines. Otters need to eat large quantities of food each day because they have a high metabolic rate and they store little energy as fat. Urchins are a favorite food of otters, and since there are 20 to 30 otters per square kilometer around some Aleutian islands, the potential exists for otters to consume enormous quantities of urchins. These facts, coupled with the observation that urchins usually are common only where otters are absent, led investigators to suspect that otters might control the locations of urchins, and hence the locations of kelp forests.
To test this hypothesis, Estes and Duggins (1995) compared sites with and without otters, both in the Aleutian Islands and along the coast of southern Alaska. Confirming the results of previous studies, they found that sites where otters had been present for a long time usually had many kelp and few urchins, whereas sites without otters usually had many urchins and few kelp.
Estes and Duggins also collected data from sites colonized by otters during the course of their study. At sites in southern Alaska, the arrival of otters had a rapid and dramatic effect: within 2 years, urchins virtually disappeared, and kelp densities increased dramatically (FIGURE 9.18A). At Aleutian Islands sites, however, kelp recovered more slowly after the arrival of otters (FIGURE 9.18B). At these sites, otters ate most of the large urchins, reducing urchin biomass by an average of 50%. However, in a twist that did not occur at the southern Alaska sites, the arrival of new urchin larvae (most likely from other sites via ocean currents) provided a steady supply of small urchins. These small urchins slowed the rate at which kelp forests replaced urchin barrens.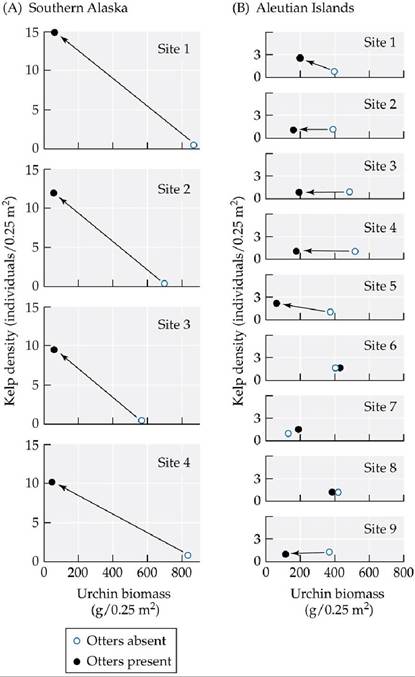
FIGURE 9.18 The Effect of Otters on Urchins and Kelp Plotsofkelpdensity versus sea urchin biomass measured at sites in southern Alaska and in the Aleutian Islands before and 2 years after the return of otters. (A) Two years after otters colonized four sites in southern Alaska, urchin biomass had declined considerably, and kelp density had increased substantially at all sites. (B) Two years after otters colonized nine sites in the Aleutian Islands, sea urchin biomass had declined at six of the sites, but kelp showed clear signs of recovery at only two of the sites. Arrows indicate a decline in urchin biomass and (at some sites) an increase in kelp density in the presence of otters.
For the nine sites in (B), list the six sites where urchin biomass declined; also list the two sites where kelp density increased. (After J. A. Estes and D. O. Duggins. 1995. Ecol Mongr 65: 75-100.) View larger image
Historically, sea otters were abundant throughout the North Pacific, but by 1900 they had been hunted to near extinction for their fur. By 1911, when international treaties protected the sea otter, only about 1,000 otters remained—less than 1% of their early numbers.
Scattered colonies of otters survived and gradually increased in size around some Aleutian islands, causing the observed pattern of kelp forests around some islands, and urchin barrens around others. In the 1990s, however, there was a sudden and unexpected decline in otter populations. Urchins made a comeback, and kelp densities were reduced (FIGURE 9.19A-D). The question then became, What caused the decline of sea otter populations in the 1990s?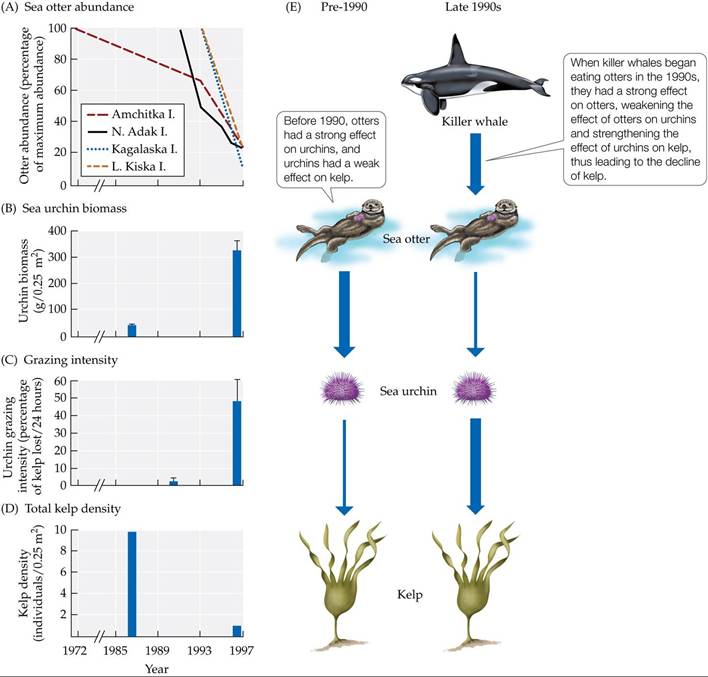
FIGURE 9.19 Killer Whale Predation on Otters May Have Led to Kelp Declines Declines in otter abundance over time (A) are associated with (B) a rise in urchin biomass, (C) an increase in the intensity of urchin grazing on kelp, and (D) a decrease in kelp density. (E) The proposed mechanisms for these changes. Strengths of the effects are indicated by the thicknesses of the arrows. Error bars in (B) and (C) show one standard error of the mean. (After J. A. Estes et al. 1998. Science 282: 5388.) View larger
image
James Estes and his colleagues have suggested that otters declined because of increased predation by the killer whale, Orcinus orca (FIGURE 9.19E). It is not known why killer whales began to eat more otters. Some researchers have argued that this change may have been part of a chain of events that began when commercial whaling drove populations of large whales to low numbers (Springer et al. 2003). According to this hypothesis, once their preferred prey (large whales) became rare, killer whales began to hunt a series of other species (first harbor seals, then fur seals, then sea lions), each of which then also declined in number. Other researchers dispute the connection between commercial whaling and the decline of seals and sea lions, suggesting that seal and sea lion populations declined for other reasons, such as a lack of food due to reduced fish populations in the open ocean (DeMaster et al. 2006). Whatever the cause, it was in the 1990s, when populations of harbor seals, fur seals, and sea lions had all declined to low levels, that killer whales were first seen attacking otters.
Otters and killer whales had been observed in close proximity for decades, but within 10 years of the first known attack, otter populations crashed.Connections in Nature
From Urchins to Ecosystems
Urchins, otters, and perhaps killer whales and people play important roles in determining the distribution of kelp. But does the presence or absence of kelp matter? Do kelp have strong effects on nearshore
ecosystems?
Indeed they do. Kelp forests serve as nurseries for the young of many marine species and as havens from predators for the adults of still more species. Kelp forests are also among the most productive ecosystems in the world, rivaling tropical forests in the amount of new biomass they produce each year (up to 2,000 g of carbon∕m2∕year). Kelps grow from their base, and their tips are constantly “eroded” by wave action and other physical forces. Thus, much of their biomass ends up as floating bits of detritus, which provides food for suspension feeders such as barnacles and mussels that filter food from the water. As a result, barnacles and mussels grow more rapidly and are more abundant in kelp forests than in urchin barrens. Carbon-13 labeling studies (see Ecological Toolkit 5.1) have shown that the tissues kelp produce by photosynthesis provide a food source for a wide range of species (Duggins et al. 1989).
Overall, we can see that the effects of urchins on kelp, and of otters on urchins, do indeed matter: urchins and otters (and killer whales) all interact in ways that alter fundamental aspects of kelp forest ecosystems.