NPP can be estimated by a number of methods
There are several reasons why it is important to be able to measure NPP in an ecosystem. As we have seen, NPP is the ultimate source of energy for all organisms in an ecosystem and thus determines the amount of energy available to support that ecosystem.
It varies tremendously over space and time. Year-to- year variation in NPP provides a metric for examining ecosystem health, because changes in primary productivity can be symptomatic of stresses such as high temperature, drought, or acid rain. Finally, as noted earlier, NPP is intimately associated with the global carbon cycle, and it is therefore an important influence on global climate change (see Chapters 2 and 25). For all these reasons, scientists have put great effort into improving techniques for estimating NPP over the past 3 decades.Terrestrial Ecosystems
Methods for estimating NPP in forest and grassland ecosystems are the best developed because of the economic importance of these ecosystems for wood and forage production as well as the high amount of carbon that they store. Traditional techniques include measuring the increase in plant biomass during the growing season by harvesting plant tissues in experimental plots. In forests, the radial growth of wood must be included in estimates of NPP. In the tropics, plants may continue to grow throughout the year, and tissues that die decompose rapidly, making the use of harvest techniques problematic. Despite these shortcomings, harvest techniques still provide reasonable estimates of aboveground NPP, particularly if corrections are made for tissue loss to herbivory and mortality.
Measuring the allocation of NPP to growth belowground is more difficult because root growth is more dynamic than the growth of leaves and stems, and the soil makes it difficult to observe this dynamic growth pattern. The proportion of NPP in roots exceeds that in aboveground tissues in some ecosystems: in grassland ecosystems, for example, root growth may be twice that of aboveground leaves, stems, and flowers combined.
The finest roots turn over more quickly than shoots; that is, more roots are “born” and die during the growing season than stems and leaves. In addition, roots may exude a large amount of carbon into the soil, and they may transfer carbon to mycorrhizal or bacterial symbionts. Therefore, harvests for measuring root biomass must be more frequent, and additional correction factors must be used when estimating belowground NPP. Proportional relationships correlating aboveground to belowground NPP have been developed for some forest and grassland ecosystems so that measurements of aboveground NPP can be used to estimate whole-ecosystem NPP. The use of minirhizotrons, underground viewing tubes outfitted with video cameras, has led to advances in the understanding of belowground production processes (FIGURE 20.6).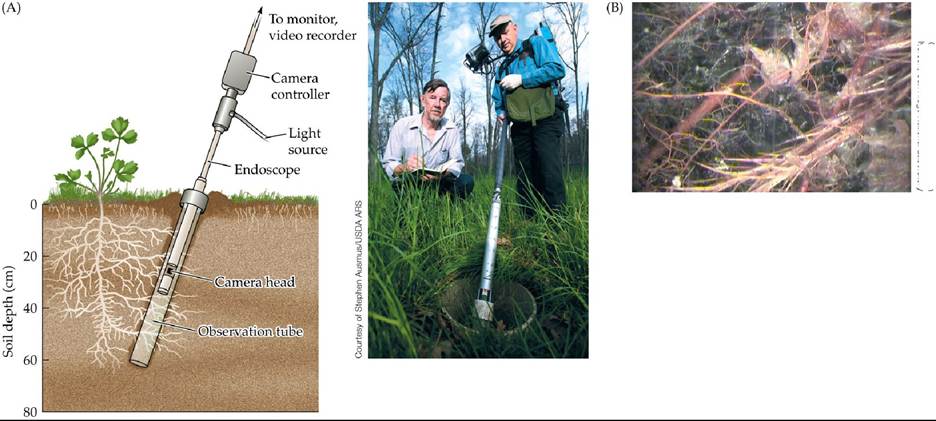
Courtesy of Joanne Childs and Colleen Iversen. Oak Ridge National Laboratory
FIGURE 20.6 A Tool for Viewing Belowground Dynamic (A)Minirhizotronsallow researchers to observe the dynamics of root growth and death belowground. (B) A view of roots from a minirhizotron tube installed in a bog ecosystem in northern Minnesota. Small-diameter roots from ericaceous shrubs can be seen in the foreground against a background of decomposing Sphagnum mosses and peat. View larger image
The labor-intensive and destructive nature of harvest techniques makes them impractical for estimating NPP over large areas or in biologically diverse ecosystems. Several nondestructive techniques have been developed that allow more frequent estimation of NPP over much larger spatial scales, although with lower precision than harvest techniques. Some of these techniques, which include remote sensing and frequent atmospheric CO2 measurements, provide a quantitative index rather than an absolute measure of NPP. Some techniques use a combination of data collection and modeling of plant physiological and climate processes to estimate the actual fluxes of carbon associated with NPP.
The concentration of the photosynthetic pigment chlorophyll in a plant canopy provides a proxy for photosynthetic biomass that can be used to estimate GPP and NPP. Chlorophyll concentrations can be estimated using remote sensing techniques that rely on the reflection of solar radiation (ECOLOGICAL TOOLKIT 20.1). Remote sensing allows NPP to be measured frequently, at spatial scales up to the entire globe, using satellite-based sensors (FIGURE 20.7). Indicators of NPP that are based on chlorophyll concentrations can overestimate NPP if the vegetation is not physiologically active, as in boreal forests in winter, but remote sensing generally provides the best estimate for NPP at regional to global scales.
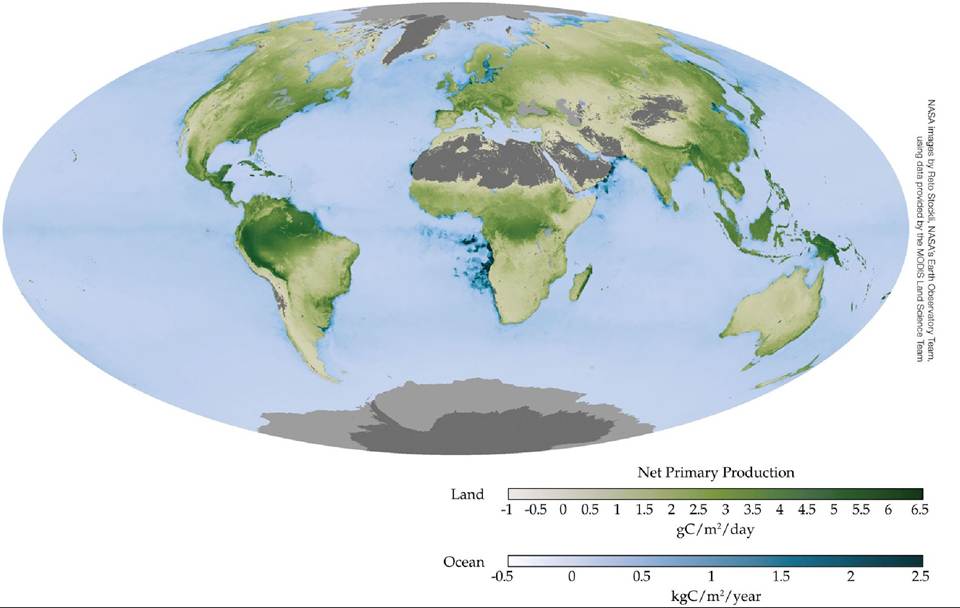
FIGURE 20.7 Remote Sensing of NPP Global NPP estimated using a satellite-based sensor [Moderate Resolution Imaging Spectroradiometer (MODIS)]. Note the latitudinal patterns in NPP corresponding to climate zones.
In addition to zones of upwelling, what other coastal zones have high rates of NPP as indicated in this map?
View larger image
ECOLOGICAL TOOLKIT 20.1
Remote Sensing
When sunlight strikes an object, it is absorbed or scattered in such a way that the amount and quality of the light that reflects off of the object is changed. For example, when sunlight strikes a clear lake, about 5% of the visible light is reflected, while a light-colored sandy soil, such as might be found in a desert, reflects back as much as 40%. The amount of light reflected depends on the wavelengths of the light: different kinds of objects absorb or reflect some wavelengths more than others. The atmosphere scatters more blue wavelengths than red or green, and therefore the sky appears blue to our eyes. The lake, however, appears blue because most of the red and green light is absorbed by the water before it can be scattered back to our eyes. Lakes with high concentrations of phytoplankton appear green because much of the blue light is absorbed by the phytoplankton, leaving only the green light to be scattered back to our eyes.
Remote sensing is a technique that takes advantage of light reflection and absorption to estimate the density and composition of objects on Earth's surface, in its waters, and in its atmosphere. Ecologists use remote sensing to estimate NPP by taking advantage of the unique reflectance pattern of chlorophyll-containing plants, algae, and bacteria (FIGURE A). Because chlorophyll absorbs visible solar radiation in blue and red wavelengths, it has a characteristic spectral signature with greater reflection of green wavelengths. In addition, vegetation absorbs more light of red wavelengths than does bare soil or water.
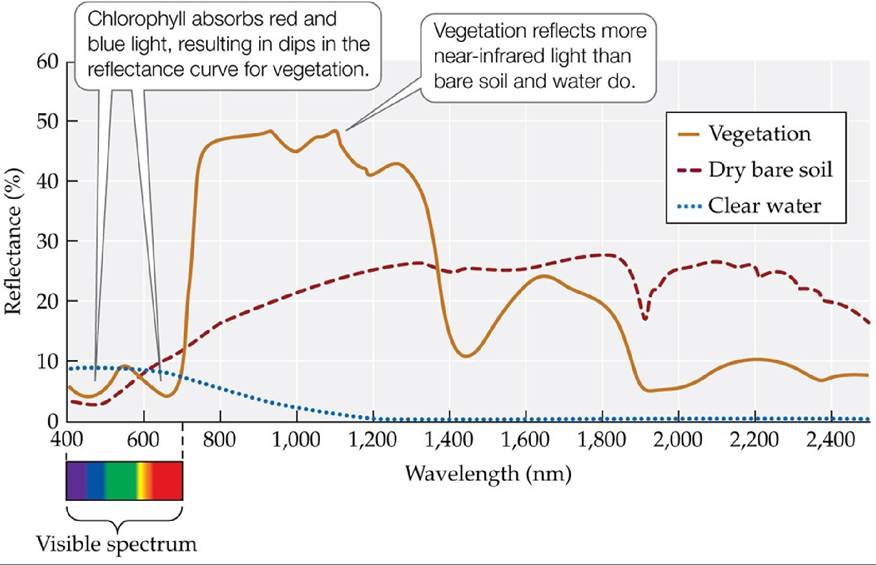
FIGURE A Spectral Signatures of Vegetation, Clear Water, and Bare Soil Note the
low reflectances of blue and red wavelengths for vegetation. (After A. R. Huete. 2004. In Environmental Monitoring and Characterization, J. F. Artiola et al. [Eds.], pp. 183-206. Academic Press: Amsterdam.) View larger image
Ecologists can measure the reflection of specific wavelengths from a land or water surface and estimate NPP using several indices that have been developed. One of the most commonly used indices is the normalized difference vegetation index, or NDVI, which uses differences between visible-light and near-infrared reflectance to estimate the density of chlorophyll:

(20.4)
where NIR is the near-infrared wavelength band (700-1,000 nm) and red is the red wavelength band (600-700 nm). Note that the spectral signature of vegetation in Figure A shows a large difference between reflectance of red and near-infrared wavelengths relative to the spectral signatures of water and soil, which gives vegetation a high NDVI value and water and soil low NDVI values. The NDVI is coupled with estimates of the efficiency of light absorption to estimate photosynthetic CO2 uptake.
Remote sensing of light reflectance from Earth's surface and atmosphere can be done at large spatial scales using satellites (FIGURE B), which transmit their measurements to receiving stations. Depending on the spatial resolution of the surface measurement and the number of wavelengths measured, satellite remote sensing can generate massive amounts of data that need to be processed. Advances in computing power have enhanced the spatial and temporal capabilities of remote sensing, making it a powerful tool for measuring NPP as well as deforestation, desertification, atmospheric pollution, and many other phenomena of interest to ecologists.
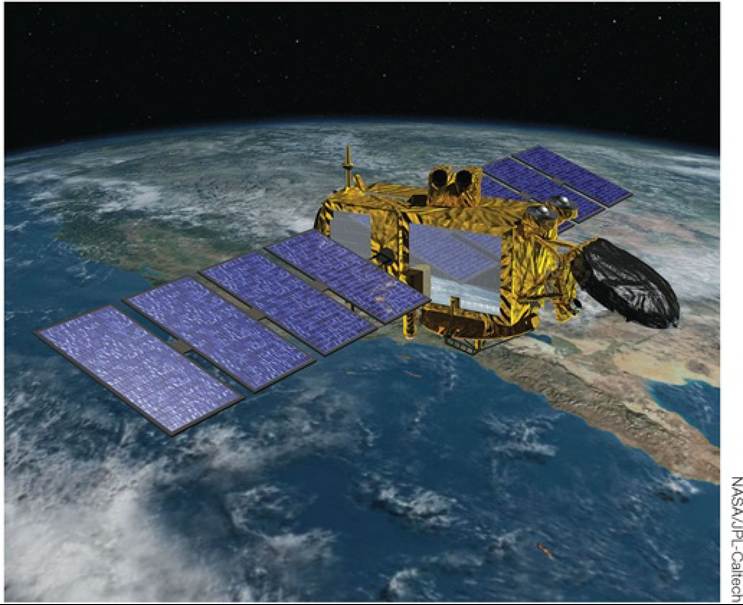
FIGURE B Remote Sensing by Satellite Remote sensing instruments mounted on satellites can measure the reflectance of solar radiation from Earth to provide ecologists with large-scale measurements of NPP and other phenomena. View larger image
NPP can also be estimated from direct measurements of its components: GPP and plant respiration. This approach may involve measuring the change in CO2 concentration in a closed system, which can be created by placing a chamber around stems and leaves, whole plants, or whole stands of plants. For example, Howard Odum estimated NPP for a tropical forest in Puerto Rico by enclosing a stand of trees inside a 200 m2 ? 20 m tall clear plastic “tent” (Odum and Jordan 1970). The emissions of CO2 to the atmosphere in such a closed system are from respiration by the plants and heterotrophs, including microorganisms in the soil and animals in the forest. Uptake of CO2 from the atmosphere results from
photosynthesis. Thus, the net change in CO2 inside the system results from the balance between GPP and total respiratory release by the plants and the heterotrophs. This net exchange of CO2 is called net ecosystem exchange (NEE) (FIGURE 20.8).
Heterotrophic respiration must be subtracted from NEE to obtain NPP; as a result, NEE provides a more refined estimate of ecosystem carbon storage than NPP. Carbon movement into and out of ecosystems, such as carbon lost through leaching from the soil or through disturbances (e.g., fire or deforestation; ANALYZING DATA 20.1), can influence estimates of NEE and NPP.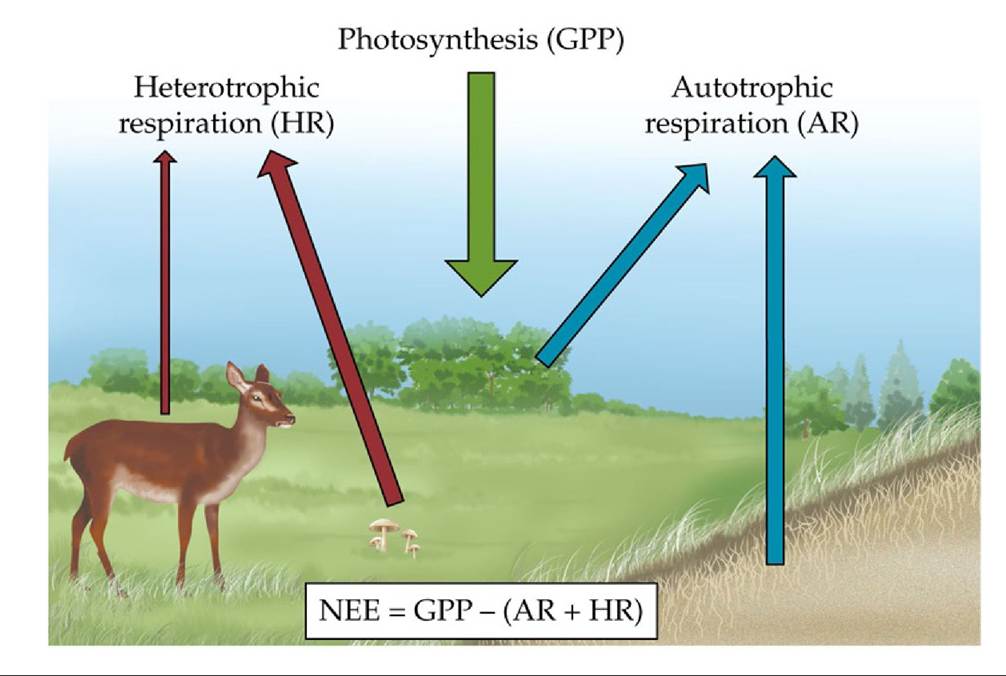
FIGURE 20.8 Components of Net Ecosystem Exchange (NEE) Netecosystemexchange includes all of the components of an ecosystem that either take up CO2 (autotrophs, through photosynthesis) or release CO2 (both autotrophs and heterotrophs). View larger image
ANALYZING DATA 20.1
Does Deforestation InfluenceAtmospheric CO2 Concentrations?
We know that on a yearly basis trees take up large amounts of CO2 from the atmosphere, converting it through photosynthesis to fixed carbon. We also know that occasionally large numbers of trees succumb to fire, insect predation, diseases, and human activities. What effect, if any, might this deforestation have on atmospheric concentrations of CO2? Two studies shed light on this question.
Over the past decade, mountain pine beetles (Dendroctonus ponderosae) killed millions of trees throughout western North America. Kurz et al. (2008)* studied the effects of a massive beetle infestation in British Columbia, Canada. The team measured and estimated NPP and heterotrophic respiration before and after the outbreak. Use their data (below) to answer Questions 1 and 2.
| NPP- | Heterotrophic respiration- | |
| Before outbreak | 440 | 408 |
| After outbreak | 400 | 424 |
a In g CZm2Zyr
1. Prior to the mountain pine beetle outbreak, was the forest taking up more CO2 than it was releasing? In other words, was the forest a sink or a source of CO2 for the atmosphere?
2. Was the forest a sink or a source of atmospheric CO2 following the outbreak? Would you expect this trend in net carbon exchange with the atmosphere to change over the next 100 years?
Trees are also being lost at a high rate from the tropical rainforest biome, in this case because of land use change (see Concept 3.1). The ongoing conversion of tropical rainforest to pasture by humans is altering the NEE of this biome. In a study that compared the NEE of a tropical pasture with that of second-growth tropical rainforest in Panama, Wolf et al. (2011)t obtained the following data, which you can use to answer Questions 3 and 4.
| GPP- | Total respiration- (autotrophic + heterotrophic) | |
| Pasture | 2,345 | 2,606 |
| Second-growth forest | 2,082 | 1,640 |
a In g CZm2Zyr
3. What is the NEE for the tropical pasture? For the second- growth forest?
4. As noted in Table 20.1, today the tropical forest biome accounts for 35% of terrestrial NPP. The NEE of Earth's total land surface accounts for a net uptake of 3 petagrams (3 ? 1,015 grams) of carbon each year. Given these considerations, use the NEE figures you obtained for Question 3 to determine how much less annual global carbon uptake there would be if half of the existing tropical forest were converted to pasture. (Assume that the numbers from the Wolf et al. study represent the average conditions
for undisturbed tropical forest and tropical pasture.)
*Kurz, W. A., and 7 others. 2008. Mountain pine beetle and forest carbon feedback to climate change. Nature 452: 987-990.
tWolf, S., W. Eugster, C. Potvin, B. L. Turner, and N. Buchmann. 2011. Carbon sequestration potential of tropical pasture compared with afforestation in Panama. Global Change Biology 17: 2763-2780.
Another noninvasive approach to estimating NEE uses frequent measurements of CO2 and microclimate at various heights throughout a plant canopy and into the open air above the canopy. The movement of air in these zones is complex and can be modeled as rotating eddies of air, much like the eddies in flowing streams. These eddies can be modeled using high-frequency measurements at different heights. This technique, known as eddy covariance or eddy correlation, takes advantage of the gradient in CO2 concentration between the plant canopy and the atmosphere that develops because of photosynthesis and respiration. During the day, when plants are photosynthetically active, the concentration of CO2 is lower in the plant canopy than in the air above the plant canopy. At night, when photosynthesis shuts down but respiration continues, the CO2 concentration in the canopy is higher than that in the atmosphere. Instrumentbearing towers established in forest, shrubland, and grassland canopies have been used to measure the NEE of CO2 over long periods (FIGURE 20.9). Depending on the tower height, eddy covariance can provide an integrated NEE for up to several square kilometers of the surrounding area. A network of eddy covariance sites across the globe (FLUXNET: fluxnet.org) has been established to help researchers better understand the uptake and fate of carbon in terrestrial ecosystems and how carbon uptake is influenced by climate.
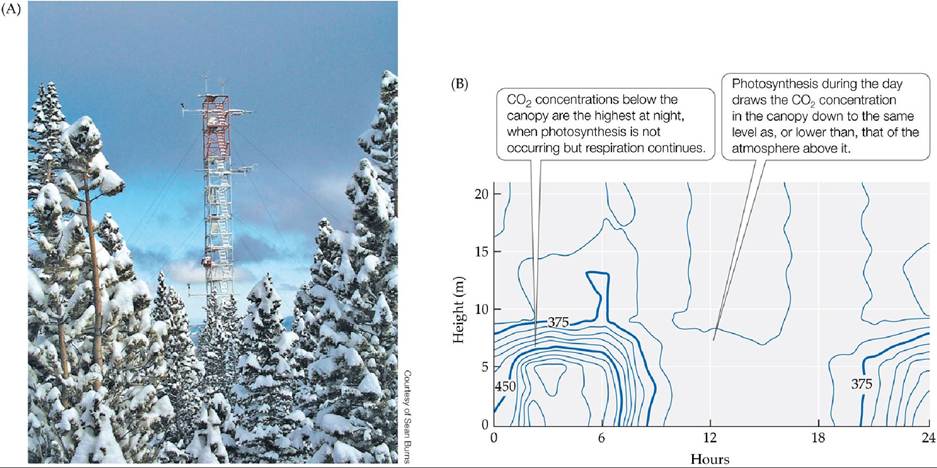
FIGURE 20.9 EddycovarianceEstimatesofNEE (A)Atowerprojectingabovea subalpine forest on Niwot Ridge, Colorado. Instruments attached to the tower measure the microclimate (temperature, wind speed, radiation) and atmospheric CO2 concentrations at frequent intervals. These measurements are used to estimate net ecosystem exchange of CO2. (B) Concentrations of CO2 (in parts per million) from the ground surface to above the canopy in a boreal forest in Siberia, measured over the course of a 24-hour period in the summer. Average canopy height was 16 m.
What would the daily pattern of CO2 concentrations look like during the summer in a community made up primarily of cacti?
(B after D. Y. Hollinger et al. 1998. Agr For Meteorol 90: 291-306.) View larger image
Aquatic Ecosystems
The dominant autotrophs in both freshwater and marine ecosystems are phytoplankton, including algae and cyanobacteria. These organisms have much shorter life spans than terrestrial plants, so the biomass present at any given time is very low compared with NPP; therefore, harvest techniques are not used to estimate NPP for phytoplankton, although they can be used for seagrasses and macroalgae. One approach to estimating NPP involves measuring the rates of photosynthesis and respiration in water samples collected in bottles and incubated at the collection site with light (for photosynthesis) and without light (for respiration). Although there are errors associated with the artificial environment of the bottles, as well as the inclusion of respiration by heterotrophic bacteria and zooplankton, this technique is used widely in freshwater and marine ecosystems.
Remote sensing of chlorophyll concentrations in the oceans using satellite-based instruments provides good estimates of marine NPP (see Figure 20.7). As described for terrestrial remote sensing, indices based on absorption and reflection of light of different wavelengths are used to indicate how much light is being absorbed by chlorophyll, which is then related to NPP by using a light utilization coefficient, a term that incorporates the efficiency of light absorption into photosynthetic CO2 uptake.
As Figure 20.7 shows, there can be as much as a 50-fold difference in NPP between Arctic and tropical ecosystems. In the following section we will investigate the role of abiotic and biotic factors that influence differences in NPP among ecosystems.
More on the topic NPP can be estimated by a number of methods:
- Which biomes and marine biological zones have the highest NPP and, as a consequence, the greatest effect on atmospheric CO2 dynamics?
- NPP changes during ecosystem development
- Methods of measuring and describing competition