Methods of measuring and describing competition
The general principles outlined in the previous section will be translated into explicit formulas and illustrated for some simple models in this section. I begin by giving formulas for very small press perturbations in a neutral parameter.
The formulas assume that species j is the initiator and they use the per capita mortality rate of consumer species j as the neutral parameter. Expression (3.1) below is the negative of the effect of the mortality of species j on the equilibrium population of species i. Measure (3.2) standardizes this relative to the change produced on species j itself. The competitive effect is then the change in recipient species is equilibrium population Ni with a small increase in dj divided by the corresponding change in the population size of the initiator species j. The two measures are:
and
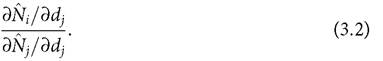
These will be referred to as measures 1 and 2 below. The negative sign in expression (3.1) is present because increased mortality of species j has a negative effect on its
Measuring competition: a consumer-resource framework • 37 own population growth, and interaction signs are usually defined by the impact of positive effects on (or addition of) the initiator. Both measures above represent the response of population size of species i to a very small press perturbation (Bender et al. 1984) in the per capita mortality of species j. The standardization involved in expression (3.2) makes it equivalent to the competition coefficient in the LV model given in Chapter 1. If increased immigration (rather than mortality) is used as the perturbation, the sign of expression (3.1) is reversed, as this represents a positive perturbation to species j.
Using immigration rather than mortality does not change the sign of expression (3.2). For the moment, I will assume that there is at least one stable equilibrium point and that the population densities in the formulas are the densities at such an equilibrium point. The same procedure can be applied to long-term mean densities in systems with sustained fluctuations (see below), although there is generally no closed-form solution giving the temporal course of population size. As a result, the analogues of expressions (3.1) and (3.2) based on mean densities will generally need to be evaluated numerically, using a small but finite change in mortality (or immigration). The responses of population sizes to larger magnitude changes in dj can be used to quantify interspecific effects of such larger perturbations; these measures will not, in general, be identical to the values given by the above formulas.For characterizing the strength of interspecific competition, the second measure above seems preferable to the first in at least two respects. Firstly, as noted above, it is independent of the neutral parameter used, so it produces the same measure if immigration (or another neutral consumer parameter), rather than per capita mortality were used. That is not true of measure (3.1). Secondly, measure (3.2) is consistent with the common method of measuring competition in experimental studies (i.e., measuring the change in a recipient population for a given change in the initiator’s population). In a two-competitor system, measure 2 corresponds to the competition coefficient αij in the traditional parameterization of the Lotka-Volterra model in which intraspecific effects of a consumer on its own per capita growth rate have been scaled to one (as in Chapter 1). Thus, measure 2 is a ratio of inter- to intraspecific effects.
On the other hand, because it is a ratio, measure 2 does not always identify cases where the change in the receiver species’ population (measure 1) is large or small in magnitude.
Measure 2 can be very large in some cases because the effect of a parameter of species j on its own abundance is very small. This makes the denominator of measure 2 small, which can make the ratio very large. Measure 2 produces a positive sign for the interaction in those cases in which both species increase in response to greater mortality of the initiator. These are usually cases when species j is characterized by a generalized ‘hydra effect’ (Abrams and Matsuda 2005; Cortez and Abrams 2016; Abrams 2019); i.e., the equilibrium population of the initiator increases in response to a neutral parameter change that lowers its own per capita growth rate (or the opposite: decreases in density in response to a parameter change that increases per capita growth rate). Such outcomes are not uncommon in situations with asymmetric competition, even in MacArthur’s consumer-resource model (Abrams and Cortez 2015a). Abrams (2009a) and Cortez and Abrams (2016) providea larger number of other theoretical examples. This possibility was not considered in Schoeners earlier (1993) review of indirect effects, where he stated (p. 366) that, ‘In the most precise existing theoretical formulation, an effect is defined as a change in equilibrium population size caused by a change in the input or abundance of another species.' The italics have been added because of the problematic fact that increased input may cause decreased equilibrium abundance of the perturbed species. As noted above, hydra effects (where increased input decreases abundance) occur in a significant fraction of simple models of small groups of interacting species, and such effects can be large in magnitude (Abrams 2002, 2009a; Abrams and Matsuda 2005; Abrams and Cortez 2015a, Cortez and Abrams 2016). In systems with shared resources, hydra effects will often produce positive effects according to measure 2. Very small effects of the parameter on the abundance of the perturbed species can imply that measure 2 is large in magnitude even when measure 1 is relatively small.
Neither expression (3.1) nor (3.2), which are both defined for a particular equilibrium point, provides a full description of an interaction because both change depending on the initial mortality rates. In theoretical studies, this is not a problem, because the values can be determined for any set of mortality rates. Unfortunately, the dependence on the mortality rate makes it difficult to impossible to characterize the ‘strength' of competition by a single number. As I argue below (see also Abrams 2001c), a full quantitative description of the consumer-resource dynamics is essential for understanding the relative change in abundances produced by any given perturbation to one consumer. The dependence of sign and magnitude of relative effects on both initial population sizes and the size of the perturbation makes single measures of competition insufficient for understanding the dynamics of most competitive systems. However, these are not problems with the Lotka-Volterra model, where competitive effects are simply assumed to be independent of the abundances of the competitors, and independent of any neutral parameter.
Even in a two-species system, the outcome of a press perturbation to the per capita mortality rate is usually significantly altered if there are sustained non-equilibrium dynamics in the system. In this case, expressions (3.1) and (3.2) should be reformulated as effects on long-term mean densities, i.e., equilibrium population sizes should be replaced by long-term averages of population size. Effects on long-term mean densities may differ in sign from those defined by the change in the equilibrium point in systems having endogenously driven cycles due to a saturating (type II) functional response in one or both consumers (Armstrong and McGehee 1980; see Box 2.1). This is also the case when sustained environmental fluctuations drive population cycles (e.g., Abrams 2004b). These issues have largely been ignored in the competition literature based on LV equations.
This limitation is in part because of the focus on the 2-species LV model, in which cycles cannot occur without environmental forcing. However, even when the LV model is modified by seasonal variation in a parameter that affects a density-independent component of per capita growth rate (i.e., a neutral parameter), the linear dependence of per capita growth rate on population sizes ensures that the mean population size is equal to the equilibrium in an otherwise equivalent model that lacks environmental variation. This is not the case in models with nonlinear per capita growth rates or in cases when the environmental forcing affects a nonlinear term in the expression for per capita growth rate (see Chapter 8).Changes in non-neutral parameters are likely to be involved in most responses of competitive communities due to climate change (Gilbert et al. 2014; Amarasekare 2015), as well as many of the changes produced by the addition of higher-level predators (Abrams 1995; Suraci et al. 2019). The presence of adaptive phenotypic plasticity (including behaviour) in one or more species means that changes in neutral and nonneutral parameters are often coupled (Abrams 2019). This implies a wider range of potential signs of interactions when changes in non-neutral parameters occur either as a direct response to the environment or as an indirect response to changes in neutral parameters or resource abundances. The absence of resources from many formal definitions of competition (and from the LV equations) has delayed the development of theory for understanding these non-neutral parameters. Thus, it is important that the impact of non-neutral parameters be more fully incorporated into theory of interactions transmitted by resources, i.e., that expressions (3.1) or (3.2) should only be two of many measures of potential interactions transmitted or influenced by shared resources.
Having reviewed a number of complications involved with measures (3.1) and (3.2) in consumer-resource models, it is useful to return to the Lotka-Volterra model, both to illustrate the use of these expressions, and to show their exceptionally simple properties in the case of this particular model.
The normal LV model parameterization (see Chapter 1) is changed so that each species has a single neutral parameter. The inter- and intraspecific competition terms are represented by αij and αii, and dynamics are described by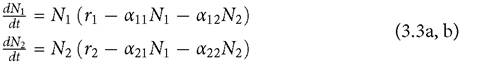
Here Ti (which is still the maximum per capita growth rate) can be understood as the maximum per capita birth minus death rate of species i, and it is a neutral parameter. The αii terms are strengths of intraspecific competition, which were given by 1∕Ki in the traditional parameterization of Chapter 1. The αij terms are strengths of interspecific competition, which were given by αij /Ki in Chapter 1. The general formulas for effects of greater per capita mortality given by measures 1 and 2 above can be represented by examining the effect of a reduced ri; alternatively, one can simply examine a positive change in the ri and change the sign of expression (3.1). The interspecific effect of a small increase in r2 on the equilibrium N1 is given by α12∕(α12α21 - α11α22); this is always negative, as the denominator must be negative for the equilibrium to be stable. The two species will not coexist if this condition on the denominator is not met.
Measure 2 above is given here by the ratio of the effect of r2 on the equilibrium N1 relative to its effect on the equilibrium N2; this quantity is -α12∕α11. This is the same ratio of effects on the two population sizes if N2 were maintained at a slightly higher value by some external interventions (and so was removed as a dynamic variable). In this case, eq. (3.3a) alone determines the abundances. The αij terms do not change with the addition or loss of another competing species in the LV model, although the formulas for the equilibrium abundances do change. In the two-competitor case, the increase in r2 required to bring about extinction of competitor 1 can be linearly extrapolated from the effect of a very small change in r2. There are no abrupt jumps in equilibrium population size with any small perturbation. Thus, the standard theoretical approach for investigating indirect interactions—a press change in a neutral parameter—yields the same measures of interaction strength and conditions for coexistence as would be obtained by manipulating population size directly and holding it at the new density. In addition, the magnitude of the perturbation does not affect the relative population changes of the two species. These claims are true provided that the LV model accurately describes the system. As shown below, this simplifying feature does not characterize most consumer-resource models.
3.2
More on the topic Methods of measuring and describing competition:
- Measuring and describing competition
- Defining and describing competition
- EMERGING TRENDS IN MEASURING ITSG PERFORMANCE
- MEASURING ENVIRONMENTAL VALUE
- Measuring the three characteristics of a GPT
- I now turn from describing and analyzing events to the more challenging task of interpreting and explaining them.
- Methods
- Methodological Considerations for Measuring Ritual and Religion in Ancient Sicily
- Comparison of Culture Methods
- METHODS
- Methods
- METHODS
- In traditional Sami thought, a person’s name was not just a label used to distinguish him or her from others; it also played a crucial role in describing a person’s character.
- BoJ: Center of Unusual Methods
- Early Methods of Inflation Control
- NPP can be estimated by a number of methods