Species diversity is an important measure of community structure
Species diversity is the most commonly used measure of community structure. Even though the term is often used generally to describe the number of species within a community, it has a more precise definition.
Species diversity is a measure that combines the number of species (species richness) and their abundances compared with those of the other species (species evenness) within the community. Species richness is the easiest metric to determine: one simply counts all the species in the community. Species evenness, which tells us about the commonness or rarity of species, requires knowing the abundance of each species relative to those of the other species within the community, a harder value to obtain. (See Ecological Toolkit 9.1 for methods of estimating abundances in terms of number, biomass, or percentage of cover.)The contributions of species richness and species evenness to species diversity can be illustrated using a hypothetical example (FIGURE 16.6). Let's imagine two meadow communities, each containing four species of butterflies. Both communities have the same butterfly species richness, but their species evenness differs. In community A, one species constitutes 85% of the individuals in the community, while the other three species constitute only 5% of the individuals in the community; thus, species evenness is low. In community B, the number of individuals are evenly divided among the four species (25% each), so species evenness is high. In this case, even though each community has the same species richness (four species), community B has the higher species diversity because it has higher species evenness.
id="Picutre 429" class="lazyload" data-src="/files/uch_group80/uch_pgroup312/uch_uch7303/image/image428.jpg">
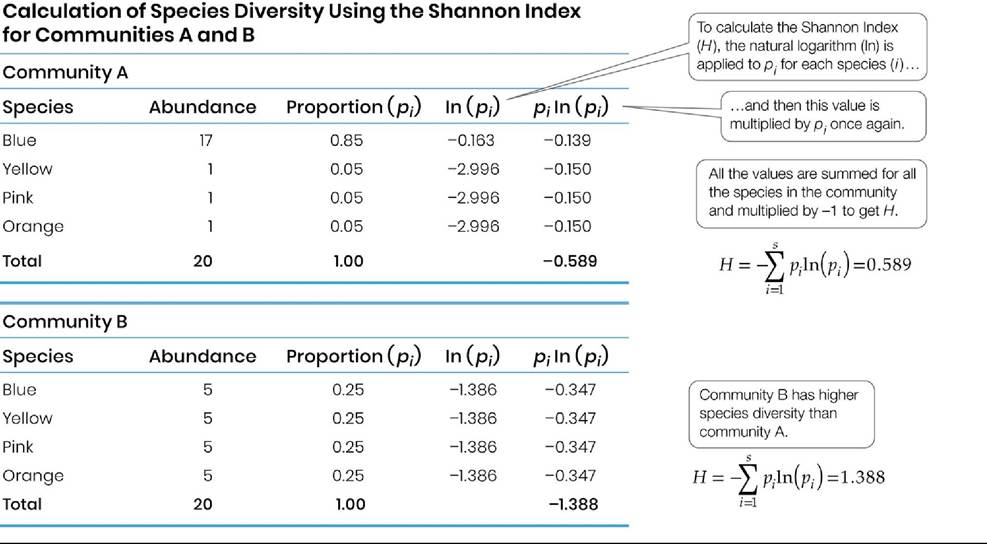
FIGURE 16.6 Species Richness and Species Evenness These two hypothetical butterfly communities have the same number of species (species richness) but different relative abundances (species evenness).
Species diversity, as measured using the Shannon index, is lower in community a (see Table 16.1). View larger imageA number of species diversity indices can be used to describe species diversity quantitatively. By far the most commonly used is the Shannon index, 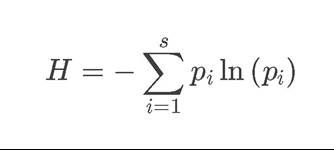
where
H = the Shannon index value
pi = the proportion of individuals found in the ith species
ln = the natural logarithm
s = the number of species in the community
The lowest possible value of H is zero. The higher a community's H value, the greater its species diversity. TABLE 16.1 calculates the Shannon index for the two butterfly communities in Figure 16.6. These calculations show that community A has the lower Shannon index value (H), confirming mathematically that this community has lower species diversity than community B. Given that both communities have the same species richness, the difference in species diversity is driven by the lower species evenness in community A. You can practice calculating the Shannon index in ANALYZING DATA 16.1, which explores how an invasive plant affects community structure in central European grasslands.
TABLE 16.1
ANALYZING DATA 16.1
What Are the Effects of Invasive Species on Species Diversity?
Invasions of non-native species have been implicated in both increases and decreases of species diversity within communities. One study looked at the effects of 13 “neophyte” plant species (i.e., those introduced since 1500) on the species diversity of a variety of plant communities in the Czech Republic in Central Europe (Hejda et al. 2009).* To understand the importance of species invasions to species diversity, the researchers measured species richness and abundance (percent plant cover) in plots with similar site conditions that differed in whether they had been invaded or not (i.e., native) by particular invasive species. They then subtracted the species richness of the invaded plots from that of the native plots, averaged the resulting values, and obtained an average change in species richness (ó-axis) for each species invasion (x-axis).
The results are shown in FIGURE A. The researchers also calculated the Shannon index (H) for each of the plots and conducted the same analysis: they calculated an average change in species diversity (ó-axis) for each invasive species (x-axis). These values are given in FIGURE B. Error bars show one standard error of the mean.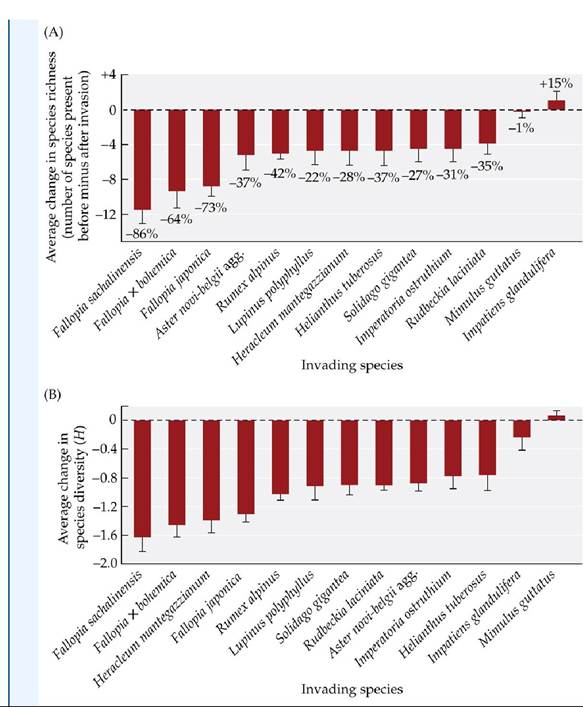
1. Based on the average changes in species richness in Figure A, how many invasive species probably had negative effects on species richness, how many probably had positive effects on species richness, and how many probably had no effect on species richness?
2. Above (or below) each bar in Figure A is the percentage change in species richness for that invader. What do these percentages tell you about the likely direction and strength of the effect of invasive species on native community richness? Compare the rank order of the magnitude of the average change in species richness from Figure A with that of the change in species diversity (H) in Figure B. Does the order differ between the two measures and, if so, why?
*Hejda, M., P. Pysek, and V. Jorosik. 2009. Impact of invasive plants on the species richness, diversity, and composition of invaded communities. Journal of Ecology 97: 393403.
As we mentioned earlier, the term “species diversity” is often used imprecisely to describe the number of species in a community without regard to the relative abundances of species or species diversity indices. For example, one commonly hears the assertion that “species diversity” is higher in tropical communities than in temperate communities, without any accompanying information about the actual relative abundances of species in the two community types. Another term that is often used interchangeably with “species diversity” is “biodiversity.” Technically, biodiversity is a term used to describe the diversity of important ecological entities that span multiple spatial scales, from genes to species to communities (FIGURE 16.7).
Implicit in the term is the interconnectedness of genes, individuals, populations, species, and even community-level components of diversity. As we saw in Chapter 10, the genetic variation among individuals within a population influences that population's viability (its chance of persistence). Population viability, in turn, has important consequences for species persistence, and ultimately for species diversity within communities. Moreover, the number of different kinds of communities in a region is critical to diversity at larger regional and latitudinal scales (see Figure 18.5). We will discuss the importance of spatial scale and biodiversity in chapters to come, but it is worth understanding some of the ways in which the term “diversity” is used, as a starting point for those later discussions.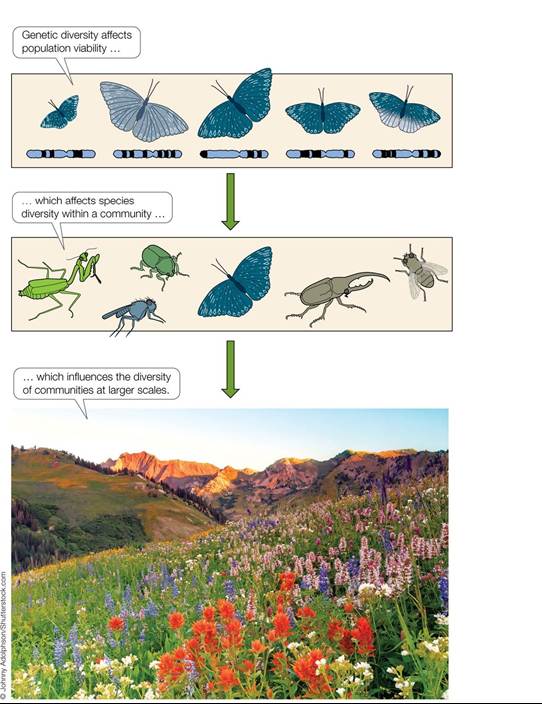
FIGURE 16.7 BiodiversityconsidersMultiplespatiaIScaIes Diversitycanbemeasured at spatial scales that range from genes to species to communities. The term “biodiversity” encompasses diversity at all of these scales. View larger image