Introduction
Richard Baldwin and Beatrice Weder di Mauro
Graduate Institute, Geneva and CEPR
COVID-19 is spreading human suffering worldwide; that is what we should all be focused on. But we are not doctors.
We are economists - and COVID-19 is most definitely spreading economic suffering worldwide. The virus may in fact be as contagious economically as it is medically.Joining the OECD’s dire growth forecast of 2 March 2020, the European Commission said on 4 March 2020 that both Italy and France are at risk of slipping into recession, and the IMF said it sees “more dire” possibilities ahead for the global economy.
This book is an extraordinary effort for extraordinary times. On Thursday 27 February, we emailed a group of leading economists to see if they’d contribute to the effort. The authors responded and the eBook came together literally over the weekend (the deadline for contributions was Monday 2 March 2020). The eBook is a testimony to the power of collaboration in a network that has the size, speed, flexibility, and talent of CEPR.
The key economic questions addressed in the book are: How, and how far and fast, will the economic damage spread? How bad will it get? How long will the damage last? What are the mechanisms of economic contagion? And, above all, what can governments do about it?
Extraordinary times
Just six weeks ago, the world economy seemed well on the way to a nice recovery; trade and political tensions were seen as “not so bad”, growth projections were rosy, and financial markets were cheery. Now all bets are off. As COVID-19 spreads around the globe, it has become clear that it has the potential to derail the world economy.
The size and persistence of the economic impact is unknowable. Like a healthy person who catches the seasonal flu, suffers a nasty but short-lived discomfort, and is quickly back to full power, the crisis could be short and sharp.
Such a ‘V-shaped’ hit seemed likely when COVID-19 was essentially a Chinese problem and China was dealing with it forcefully. Times have changed.While a short-and-sharp crisis is still possible, it’s looking less like the most likely outcome. The disease is spreading rapidly in dozens of countries. Three chapters in the eBook put numbers to this, and we’ll summarise those below, but the bottom line is that while there is too much uncertainty to be certain about outcomes, it is clear that this economic shock could cause lingering pain and perhaps leave deep scars - far larger than the other post-war pandemics (see Box 1 for a list).
The shock hits G7 plus China
This pandemic is different, economically speaking. Previous post-war pandemics (Box 1) hit nations that were - at the time - far less economically dominant. And those pandemics were far smaller; the number of COVID-19 case is already eight or nine times larger than the number of SARS cases. At least as important is one sobering fact: this time, the hardest-hit nations include the G7 plus China.
Medical data changes hourly, but as of 5 March 2020, the ten nations hit hardest by COVID-19 is almost identical to the list of the ten largest economies in the world (Iran and India are the exceptions). The US, China, Japan, Germany, Britain, France, and Italy are all in the top-ten most affected by the disease. While China is by far the hardest hit, the last few days have seen an exponential growth of cases in the G7 economies. Taking just the US, China, Japan, Germany, Britain, France, and Italy, they account for:
• 60% of world supply and demand (GDP)
• 65% of world manufacturing, and
• 41% of world manufacturing exports.
To paraphrase an especially apt quip: when these economies sneeze, the rest of the world will catch a cold.
• These economies - especially China, Korea, Japan, Germany and the US are also at of global value chains, so their woes will produce ‘supply-chain contagion’ in virtually all nations.
Large economies and COVID-19 (updated 29 February 2020)
Table 1
| GDP | Manufacturing | Exports | Manufactured exports | COVID19 cases | COVID-19 deaths | |
| US | 247? | 16% | 8% | 8% | 159 | 11 |
| China | 16% | 29% | 13% | 18% | 80,410 | 2,991 |
| Japan | 6% | 8% | 4% | 5% | 331 | 6 |
| Germany | 5% | 6% | 8% | 10% | 262 | - |
| UK | 3% | 2% | 2% | 3% | 85 | - |
| France | 3% | 2% | 3% | 4% | 285 | 4 |
| India | 3% | 3% | 2% | 2% | 28 | - |
| Italy | 2% | 2% | 3% | 3% | 3,089 | 107 |
| Brazil | 2% | 1% | 1% | 1% | 4 | 4 |
| Canada | 2% | 0% | bgcolor=white>2%2% | 34 | - |
Sources: World BankWorld DataBank, FT COVID dashboard (https://www.ft.com/content/a26fbf7e-48f8-llea-aeb3-955839e06441)
Richard Baldwin and Beatrice Weder di Mauro
This pandemic is different in another way.
Manufacturing sector gets a triple hit
The manufacturing sector is likely to get a triple hit.
1. Direct supply disruptions will hinder production, since the disease is focused on the world’s manufacturing heartland (East Asia) and spreading fast in the other industrial giants - the US and Germany.
2. Supply-chain contagion will amplify the direct supply shocks as manufacturing sectors in less-affected nations find it harder and/or more expensive to acquire the necessary imported industrial inputs from the hard-hit nations, and subsequently from each other.
3. There will be demand disruptions due to (1) macroeconomic drops in aggregate demand (i.e. recessions); and (2) wait-and-see purchase delays by consumers and investment delays by firms.
Manufactured goods, after all, are - on the whole - ‘postpone-able’ and thus more susceptible to ‘sudden stop’ demand shocks, as we saw in the Great Trade Collapse of 2009. Of course, the service sector in all affected countries are hit hard - as restaurants and movie theatres empty out - but it may well be manufacturing that takes the biggest hit.
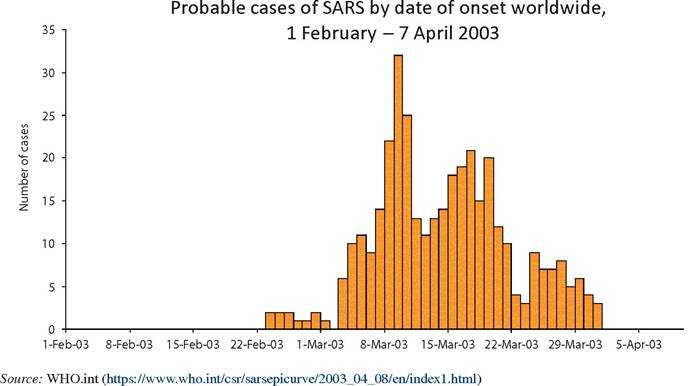
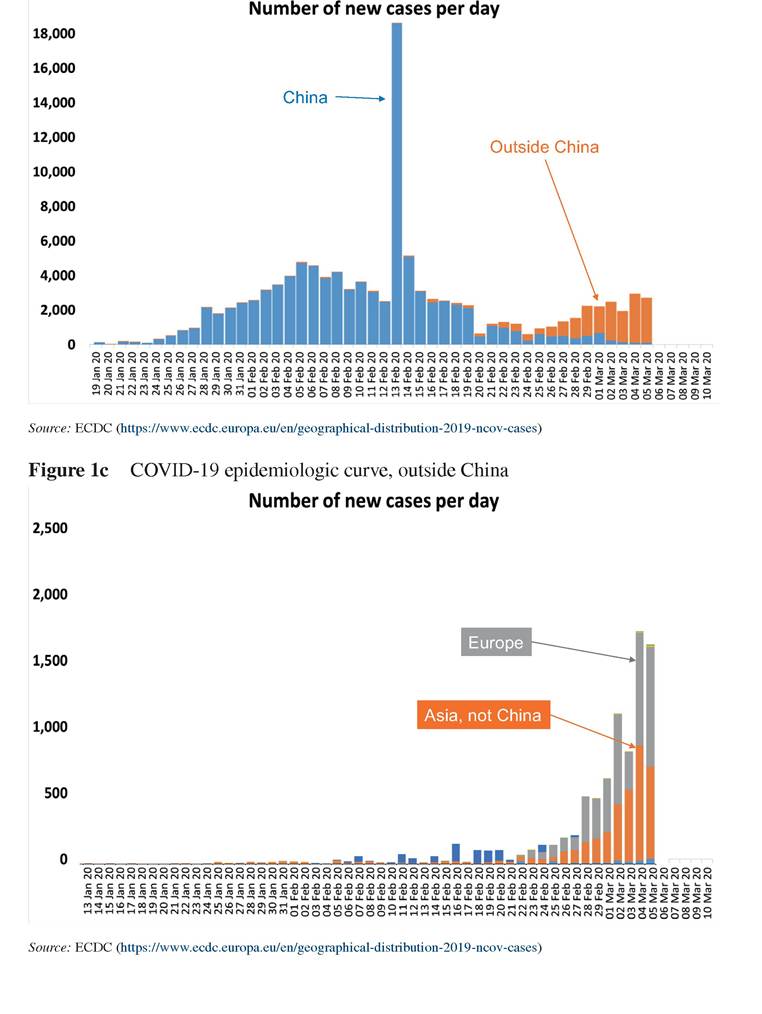
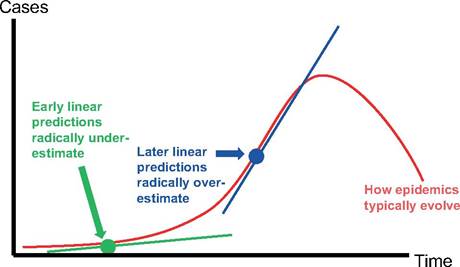
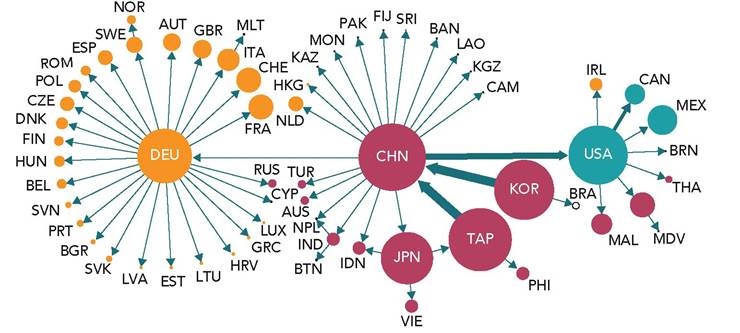
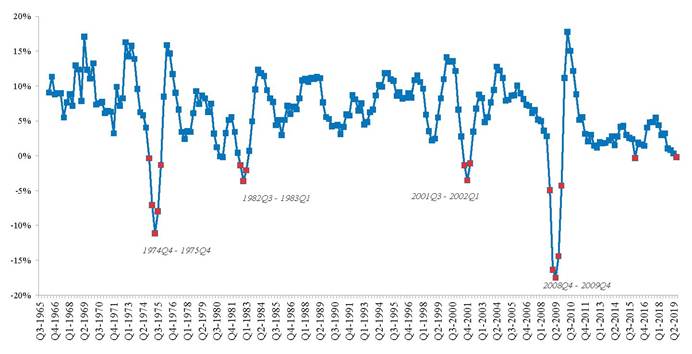
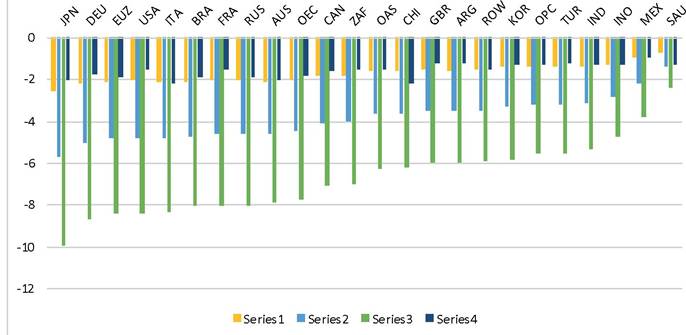
Data are already reflecting these supply shocks. The February 2020 read out on China’s key index of factory activity, the Caixin/Markit Manufacturing Purchasing Managers’ Index (PMI), showed its lowest level on record. “China’s manufacturing economy was impacted by the epidemic last month,” said Zhengsheng Zhong, chief economist at CEBM Group. “The supply and demand sides both weakened, supply chains became stagnant.” While China’s workforce is gradually returning to work, the Purchasing Managers Indices from across East Asia are showed sharp declines in production, especially in South Korea, Japan, Vietnam, and Taiwan.1 [1] Box 1 Recent history of pandemics The 20th century witnessed two pandemics since the historic ‘Spanish Influenza’ of 1918: the ‘Asian flu’ of 1957 and the ‘Hong Kong flu’ of 1968. The 21st century has seen four pandemic outbreaks: N1H1 in 2009 (‘bird flu’), Severe Acute Respiratory Syndrome (SARS) in 2002, Middle East Respiratory Syndrome (MERS) in 2012, and Ebola which peaked in 2013-14. Asian flu (H2N2): The Asian influenza originated in the Chinese province of Yunan at the beginning of 1957. The disease reached Singapore in February 1957 and spread to Hong Kong in April 1957. It then spread in the Southern Hemisphere, reaching India, Australia and Indonesia in May, before arriving in Pakistan, Europe, North America and the Middle East in June. South Africa and South America, New Zealand and the Pacific Islands were affected from July, while Central, West and East Africa, Eastern Europe and the Caribbean were reached in August.[2] This first wave peaked towards the end of 1957 and affected mostly school children, young adults and pregnant women. A second wave arrived in 1958, hitting several regions including in Europe, North America and Japan, with this one tending towards affecting the elderly. The estimated number of deaths is not precise, but the consensus figure is around 1.1 million deaths worldwide.[3] Estimates for the mortality rate (deaths as a share of cases) are likewise imprecise but range between one in 4,000 and less than 0.2%. National death estimates are not widely available, but in the US it was between 80,000 and 110,000; in England and Wales, estimates put it around 6,000.[4] Hong Kong flu (H3N2): The Hong Kong influenza was recorded for the first time in Hong Kong on 13 July 1968; 500,000 Hong Kong residents were infected in the first six months (15% of the population).[5] By the end of July, the outbreak reached Vietnam, Singapore, and started spreading globally, reaching India, the Philippines, Australia, and Europe by September 1968. It entered California via troops returning from the Vietnam War. It ultimate lead to about 33,800 American deaths.[6] The disease reached Japan, Africa and South America by 1969 (Starling 2006). According to the CDC, H3H2 kill about a one million people worldwide, most of them over 65 years old. 2009 Avian flu (N1H1): In 2009, a new pandemic flu emerged - the first in 40 years. The first case was detected in California in April 2009; it was declared over by the World Health Organization (WHO) in July 2010. A detailed timeline is provide by the European Centre for Disease Prevention and Control (ECDC).[7] After the first case was detected in California, it was recognised in Mexico only a few days later. Two days after that, it reached Europe with the first reported cases in Spain and Britain. The WHO Director General announced a world pandemic state on the 11 June 2009, about two months after the first case. The CDC estimates that between 151,700 and 575,400 people died worldwide (0.001-0.007% of the world population). The total number of cases in 2009 was highest in the US, Mexico, Canada, and the UK. The number of deaths was the highest in Mexico and the US. Severe Acute Respiratory Syndrome (SARS): SARS is a viral disease originated by the SARS coronavirus at the end of 2002 in China; WHO was informed about the outbreak in February 2003. By the end of March 2003, 210 suspect and probable cases of SARS were reported around the world, starting from Toronto.[8] Between November 2002 and July 2003, 8,096 cases were reported with 774 of these leading to death. SARS had a high mortality rate of 9.6%, but it was far less contagious than previous pandemics. Most cases were in China (5,327) and Hong Kong (1,755), where the fatality rates were 7% and 17%, respectively; Taiwan and Canada were the next hardest hit with 346 and 251 cases and mortality rates of 11% and 17%, respectively. Middle East Respiratory Syndrome (MERS): MERS is a viral respiratory disease caused by a coronavirus (MERS-CoV) which has been found in dromedary camels in several countries.[9] The first outbreak was identified in Saudi Arabia in 2012 and subsequently spread to 27 countries: Algeria, Austria, Bahrain, China, Egypt, France, Germany, Greece, Iran, Italy, Jordan, Kuwait, Lebanon, Malaysia, the Netherlands, Oman, Philippines, Qatar, Korea, Thailand, Tunisia, Turkey, United Arab Emirates, UK, the US, and Yemen. Ebola Virus Disease (EVD): EVD is a fatal illness in human, with an average fatality rate of around 50% (ranging from 25% to 90% according to the waves of outbreak; see WHO.int for details). The first outbreak was identified in 1976 in in the Democratic Republic of Congo and Sudan, where the mortality rate was 88% and 53%, respectively, with approximately 300 cases in both states. The second wave was in 2014-2016, starting in West Africa, and it was the largest one since its discovery in 1976 both in terms of cases and deaths. This outbreak spread across states starting in Guinea with 3,811 cases and a mortality rate of 67%, then moving to Sierra Leone, with 14,124 cases and a mortality rate of 28%, and Liberia, with 10,675 cases and a mortality rate of 45%. The most recent outbreak of 2018-2019 started in the eastern Democratic Republic of Congo, and as of now there are 54 cases with a mortality rate of 61%. Likely nature of the medical shock We do not have to be epidemiologists to understand the basics of epidemiology. Today, all well-informed economists should have some idea of the dynamics of spreading diseases. Times of fear are also times of rumours and misinformation; knowledge is the antidote. Box 2 outlines the maths of the simple, well-known ‘SIR model’ of epidemics. The maths will be familiar to most economists, but the basic logic can also be rendered using an example. Figure 1 is known as an epidemiologic curve. The sharply rising part of this bell-shaped curve reflects the fact that each infected person infects more than one other person, so the percentage of the population that is infected accelerates at first, but the percentage of the population susceptible to infection remains high. The number of new cases eventually slows as there are fewer people to infect and a constant stream of people become non-infectious (they recover or die). SARS, the disease depicted in the chart, was rather deadly but not very infectious - very unlike the seasonal flu, which is highly infectious but not very deadly. In the US, for example, the CDC reports that during the ongoing flu season (October 2019 - present), over 30 million people have fallen ill from the seasonal flu with over 300,000 hospitalisations. But given the low mortality rate (less than one in a thousand), few have died (the estimate is 18,000 to 46,000 deaths).[10] [11] Figure 1a SARS: Example of a typical evolution on new cases (epidemiologic curve) COVID-19, it seems, is in between SARS and the flu on both dimensions; preliminary medical studies find that COVID-19 is “less deadly but more transmissible than SARS”.11 The epidemiologic curve as of 5 March 2020 for the world is shown in Figure 1b. Here we see a clear twin peak pattern caused by the virus’ international spread. Figure 1c zooms in on the non-China cases, where it is clear that the rest of the world is in an accelerating phase. Figure 1b COVID-19 epidemiologic curve, worldwide Box 2 Simple maths of epidemics Epidemiologist have mathematical models for disease spread that use tools that will be familiar to economists. The most famous is a rough-and-ready model of unhindered transmission called the SIR model (developed in 1927). The first bold assumption is that the population can be classified into three categories: Susceptible to infection, Infectious, and Recovered (and thus immune). SIR is an acronym of these group labels. Making the bold assumption that all infectious and susceptible people are equally likely to meet, the number of interactions is the stock of susceptible people, 5, times the stock of infectious people, I, per period (the number of days during which an infected person remains infectious). If the transmission rate/probability is ‘beta’, the number of new cases is beta times 5 times I. Of course, each new infection makes the infectious group larger and the susceptible group smaller. Additionally, the size of the I group falls as people get better at the rate r (recovered people are neither infectious nor susceptible). Plainly, this dynamic leads to a logistic-like rise in the stock of affected persons as shown in Figures 1a, b and c. How many people get the disease in the long run? Simple maths show that the steady-state stock of never-infected people (i.e. susceptible) is S', where 5’ = exp[(1-Λθ)5'] and R0 is the famous ‘reproduction rate’, i.e. the number of people who catch it from an average infected person.[12] For example, if Ro is two, then eventually 80% of the population is infected in an uncontrolled epidemic. The current estimate for COVID-19 is between two and three;[13] for the seasonal flu the number is about 1.3 (Ro for the flu is low partly due to the existence of a vaccine).[14] Dr Syra Madad, who runs preparedness efforts for NYC Health and Hospitals, said: “This particular virus seems like it is highly transmissible... I think that it is certainly plausible that 40-70% of the world’s population could become infected with coronavirus disease, but a large number of cases are [expected to be] mild.” Public health responses Controlling the epidemic means ‘flattening the epidemiologic curve’. This is done by slowing the rate of infection by, for example, reducing person-to-person contact overall via work and school closures and travel bans (‘social distancing’), and by removing infected people from the population either by curing them or quarantining them. A flatter curve saves lives directly (fewer get ill and so fewer die) and indirectly since it avoids bottlenecks in the healthcare system that typically result in suboptimal treatment. A desire to flatten the curve are exactly why governments around the world are taking what might seem like extreme steps. The harsh reality is that we have no 21st century tools to fight COVID-19. There is no vaccine or treatment. All we have is the methods that were used to control epidemics in the early 20th century. Those, as we shall see, tend to be very economically disruptive. Likely nature of the economic shocks When it comes the economic shocks, it is important to distinguish three sources - two of which are tangible. • First are the purely medical shocks - workers in their sickbeds aren’t producing GDP. • Second is the economic impact of public and private containment measures - things like school and factory closures, travel restrictions, and quarantines. • The third is literally ‘all in our heads’. Belief-based economic shocks Individual behaviour depends upon beliefs, and these are subject to the usual cognitive biases; consider Figure 2. Human brains evolved in a walking-distance world, where future increments could reasonably be predicted by past increments. Using increments to predict increments is ‘straight-lining the future’ (i.e. linear approximation). It is natural, for example, to make guesses on the number of future COVID-19 cases based on the number of new cases that appeared in the recent past. This can lead to grave mistakes. Figure 2 Mistakes from straight lining the future Source: Authors' elaboration. In Figure 1, a linear prediction made during the early days of the epidemiologic curve would radically under-estimate the spread of the disease. A linear projection made later would radically over-estimate the severity of the outcome. It is easy to think that panic could arise when analysts in the media switched from under-estimating to overestimating. • As Michael Leavitt, ex-head of the US department of Health and Human Services, put it: “Everything we do before a pandemic will seem alarmist. Everything we do after will seem inadequate.” The psychological, or beliefs-based elements of the shocks are also founded, in part, on the beliefs and actions of others. When beliefs are based on others’ beliefs, multiple equilibriums are likely. There can be good and bad equilibrium - and very ‘nonlinear dynamics’ in transition. If everyone trusts the authorities to do the right thing, people may not rush out to hoard hand-sanitizer since they believe no one else will. But a mad scramble is likely if many think others will hoard. If beliefs switch from the good to the bad equilibrium, due say to loss of confidence in their government’s ability to contain the spread, the result can be chaotic. Or to put in more directly, beliefs that depend upon others’ beliefs can produce herd behaviour and panic - just as it so often does in economic settings ranging from bank runs to panic buying of toilet paper. The supply-side shocks are more tangible. Supply-side shocks The direct supply-side impact of human reactions to the virus are obvious and abundant. Authorities and firms in several nations have shuttered workplaces and schools. Japan presents clear and early examples. After sporadic reports of COVID-19 infections, many large Japanese companies ordered their employees to work from home in late February. This practice is spreading rapidly. Ford Motor Company banned all travel on 3 March 2020 after two of its workers tested positive, and many firms are following suit. • From an economic perspective, these closures and travel bans reduce productivity directly in a way that is akin to temporary drops in employment. The size of the resulting output contraction may be attenuated today thanks to digital technology and cloud-based collaborative software and databases. These didn’t exist when, for example, the SARS pandemic struck nearly two decades ago. But remote work is not a panacea. Not all tasks can be performed remotely even now. Human presence on site is required, especially to handle tangible goods. One Japanese manufacturer of health care products, Unicharm, decided to order remote working for all its employees, but workers at production factories were excluded from this order so they could meet growing demand for medical masks. Other public health measures aimed and slowing the spread - like school closures - temporarily reduce employment, indirectly, as workers have to stay at home to look after children. Japan closed all schools for a month on 27 February 2020; Italy followed suit on 4 March 2020, and this trend is likely to accelerate since child-to-child infection is a major transmission vector in, say, the seasonal flu. People staying away from work to tend to sick relatives is another indirect, temporary employment reduction. The same type of shock arises from the now common policy of imposing quarantines on the family of infected people, and those they have come in contact with. The severity of these shocks are amplified when they concern health workers. For example, a hospital in the Japanese prefecture with the largest number of COVID-19 patients was forced to stop accepting outpatients due to absent nurses (who stayed home to take care of their children). Data are already reflecting these supply shocks. The February 2020 read out on China’s key index of factory activity, the Caixin/Markit Manufacturing Purchasing Managers’ Index (PMI), showed its lowest level on record. “China’s manufacturing economy was impacted by the epidemic last month,” said Zhengsheng Zhong, chief economist at CEBM Group, a Caixin subsidiary. “The supply and demand sides both weakened, supply chains became stagnant.” While China’s workforce is gradually returning to work, the PMI’s across East Asia are showed sharp declines in production, especially in South Korea, Japan, Vietnam, and Taiwan.[15] Health-shock propagation uncertainty COVID-19 is not the first supply shock the world has seen. The 1970s ‘Oil Shocks’ are the most famous, but very clear and well-studied examples arose in 2011 with the flooding of factories in Thailand and the earthquake in Japan. All of these were quite different. A unique feature of COVID-19's supply shock concerns its propagation pattern. In the case of past supply shocks - like the Thailand floods of 2011 - the impact by factory was almost completely understood within days if not hours; it all depended upon the altitude of the factory. Likewise the supply shock that arose from the Great East Japan Earthquake in 2011 was simple to dimension. Distance to the epicentre was a quite reliable determinant of the damage to factories. By contrast, the spread of the new virus is not necessarily dictated by the geographical distance from Wuhan in China - as the outbreak in northern Italy shows. The routes of airplanes and cruise ships appear to influence the dissemination of the virus in the early phase. • Entangled webs, not concentric circles, are a more appropriate representation of the propagation of the supply shocks in the case of COVID-19. Moreover, since it involves people, and human behaviour is hard to predict, uncertainty about the size and location of the shock is highly uncertain and is likely to remain so for many days, if not weeks. Lastly, the duration of the supply-shock depends upon the virus’s lethality and is thus highly uncertain for reasons having to with the nature of the virus and publichealth policy reactions. In the more extreme scenarios considered by some economic forecasters (extreme in the sense that they involve death rates outside the ranges seen in the last half century), the shock could much more directly and much more permanently reduce employment by reducing the labour supply - due to deaths; the likelihoods of such scenarios involve medical judgements that we are not qualified to make. Supply-chain shocks As of early March 2020, the COVID-19 epidemic was very much centred in China, with over 90% of reported cases located there. The two next hardest hit nations are Japan and Korea. These nations are central to the global supply chains in many manufactured goods. The chapter by Baldwin and Tomiura, which focuses on the trade implications, provides more details, but the basic point is straightforwardly illustrated in Figure 3. Figure 3 Three interconnected hubs in the world’s supply chain for ICT goods Source: Global Value Chain Development Report, 2019, www.WTO.org In the figure, the size of the bubble reflects the size of the country (value of trade), and the thickness of the connecting lines show the relative importance of bilateral flows (small flows are zeroed for clarity).[16] The figure looks at international supply-chain linkages in the information and communication technology (ICT) goods to be concrete. Three features jump out. • China really is the workshop of the world, being central to the entire global network. So manufacturing disruption there will create secondary supply shocks in manufacturing sectors in almost all nations. • There is a strong regional dimension in supply chains, so the fact that China, Korea, and Japan are among the five hardest hit means the supply-chain shock will be especially strongly felt in Asia. Germany is the network hub in Europe. It is also the seventh most-hit nation in the world (as of 5 March 2020). Add in the medical shock to Italy, France, and Britain (respectively the 6th and 13th most affected nations) and it is clear that supply-chain contagion is very likely to be a major source of economic contagion in Europe. Similar points apply to North America. The US is the fifth most affected in terms of deaths (delayed and limited testing in the US mean its death numbers are far ahead of its case numbers compared to the experience of other nations; on official statistics, the US death rate is about twice that of China and Italy). Also noteworthy is the fact that India, the world’s seventh largest economy, is not very involved in supply chains and so may be shielded somewhat from this form of economic contagion. As a point of caution, these network diagrams look very different for different sectors. It is important to not overgeneralise; sector by sector analysis is important. Demand-side shocks When it comes to COVID-19's immediate aggregate demand shock, two aspects are worth distinguishing: practical and psychological. Practical since some consumers are or will be prevented from getting to stores, so their demand disappears from the market. Likewise, some home delivery services are suspended, so goods and consumers are coming together less frequently. Psychological since - as happened in the wake of the Global Crisis - consumers and firms tend to embrace a ‘wait-and-see’ attitude when faced with massive Knightian uncertainty (the unknown-unknowns) of the type that COVID-19 is now presenting to the world. In past crises - like the Great Trade Collapse of 2008-09 - people and firms postponed purchases and delayed investments. This effect can be particularly pernicious since international media and personal communications can unintentionally synchronise such beliefs. Put differently, the wait-and-see shock is contagious via the internet. The demand-side shock need not travel along the traditional trade and financial bilateral connections. This was abundantly demonstrated during the Global Crisis of 2008-09. People and firms from around the world looked on with shock at the financial crisis unfolding in the US. While few nations were directly implicated in the subprime mess, the psychological shock led them to postpone purchases and investments. This turned what started as a North Atlantic financial shock into a massive and synchronised global demand shock. Trade volumes collapsed at the same time in all nations and almost all products at a pace never seen before. It is impossible to know if history will repeat this pattern in reaction to the COVID-19 shock, but it is a possibility. Each of these first-round demand shocks are likely to be subject to Keynesian multiplierlike amplification. For many people and companies around the world, not working means not getting paid - and that puts an additional damper on their demand. Duration of the shocks On the duration of the crisis, we could seek some clues again from past shock experiences. The negative impacts of COVID-19 on domestic demand for non-tradable services will become substantial if it takes a long time to contain the infection. Previous epidemic shocks were short and sharp. Today, the duration is less clear. China exports an enormous amount of industrial goods, so the duration of interruption may depend as much on whether firms can find substitutes for Chinese goods as it does on the speed of the health recovery in China. In the worst case of demand shrinkage aggravated side-by-side by supply disruption, one might even imagine a situation somewhat analogous to the oil shock in the 1970s, when almost all the industrialised countries fell into persistent stagflation. • Governmental reactions create more and longer-lasting disruptions than the virus. As a lesson from history, much of the economic problems from the 1970s oil shock came from the inflation sparked by inappropriate macroeconomics policy responses, not just the actual oil shortage. In a more recent episode, the tariff hike by the Trump administration resulted in reduced imports from China, but US imports from other sources, such as Mexico and Vietnam, largely offset the effects. The channels of COVID-19's economic contagion Globally, economies are connected by cross-border flows of: • goods, • services, • knowhow, • people, • financial capital, • foreign direct investment, • international banking, and • exchange rates. Economies are also connected - but not physically - by beliefs. All these things are also mechanism for the propagation of economic shocks, or economic contagion. Some of these flows within nations are also likely vectors connecting the medical and economic aspects of COVID-19. Consider them in turn, starting with banks - which provides a convenient rallying point for contagion involving financial capital, beliefs, and international banking. Banks and other financial institutions Some of the most spectacular (in a bad way) examples of contagion have involved international banking. Banks were at the heart of the euro area crisis (CEPR 2015). The 2008-09 Global Crisis also started with banks - as have countless others (see Reinhart and Rogoff 2010). This time, banks are unlikely to be a major vector of transmission, as Torsten Beck argues in his chapter in this eBook. After ten years of tightening regulation capital buffers are higher and the banking system are generally seen as safer. He argues that even under an adverse scenario with a 8.3% in GDP over three years, European banks would still be in good shape. Other authors in this eBook, Cecchetti and Schoenholtz in particular, seem more concerned about banks’ vulnerability to a crisis of confidence - the expectations shock discussed above. As they point out, bank runs are, by their very nature, contagious. “The news about a run on a specific bank alerts everyone to the fact that there may be other ‘lemons’ among the universe of banks, turning a run in to a panic.” If people are ill-informed, shocks can cause them act in ways that amplify disturbances. The solution is transparency and honest government communication. Related linkages between medical and economic effects of the virus which are not necessarily international but are likely to be important are defaults or financial distress among firms that are not banks. Almost all businesses borrow as part of ‘business as usual’. They count on incoming revenue to service the debt. If a shock like COVID leads to a sudden stop in revenue, ‘business as usual’ can turn to bankruptcy. This has already happened to the UK airline, Flybe, which had been struggling to meet its debt obligations and went into administration on 5 March 2020, citing the dramatic drop in air travel linked to COVID-19. Nonbank financial sector These firms may be more at risk if confidence and liquidity condition deteriorate. The IMF (2019) has been flagging the fact that due to a extended period of accommodative financial conditions, investors have been searching for yield, and in particular institutional investors with nominal return targets have invested in riskier and more illiquid assets. According to the IMF Global Financial Stability Report of October 2019, risks in nonfinancial companies and nonbank financial institutions in several systemically important countries are at historic heights. If the crisis leads to a sudden stop in lending, these firms could be in trouble. John Cochrane’s chapter in this eBook takes a bold swing at this financial sudden-stop mechanism, asking “What happens if the economy shuts down for a few weeks or months, either by choice or by public-health mandate?” • “Shutting down the economy is not like shutting down a light bulb. It’s more like shutting down a nuclear reactor. You need to do it slowly and carefully or it melts down.” He foresees huge financial problems. Firms have to pay debts and wages. People have to make mortgage payments or pay the rent. “Left alone,” he writes, “there could be a huge wave of bankruptcies, insolvencies, or just plain inability to pay the bills. A modestly long economic shutdown, left alone, could be a financial catastrophe.” Cochrane does not provide estimates - his is a think-piece - but he worries about financial problems as factories may shut down due to lack of demand but will still have to pay their workers and their debt, with the consequence of mass bankruptcies among households and firms. And that’s not to mention medical bankruptcies, which are already an important share of US personal bankruptcies. Concerns over credit are also heightened by the profound change in how the market currently operates. Dealers have retreated from supporting the market over the past decade and there has been a notable rise in credit exchange traded funds, which provide the illusion of liquidity. As seen in 2001 and 2008, and then briefly towards the end of 2018, liquidity in the credit market simply evaporates when a crunch tightens. Trade As discussed above, and in Baldwin and Tomiura’s chapter in this eBook, international trade is surely one of the leading mechanisms through which the virus damages domestic economies and spreads internationally. Trade happens when things are made in one nation and purchased in another. This, quite naturally, makes trade flows susceptible to demand shocks (purchases fall) and supply shocks (production falls). The implications are clear. The supply shock aspects of COVID-19 - factory closures, travel bans, border closings and the like - will reduce exports of the afflicted sectors in afflicted nations. Exports from China, for example, have already been severely hit by the virus according to various media reports; official figures are available only after a several month delay. Japan presents clear examples of this sort of supply shock. After sporadic reports of COVID-19 infections, many large Japanese companies ordered their employees to work from home. Given the serious congestions of rush-hour commuter trains in Japan, there may be a silver lining to these restrictions, but in the short run they surely diminish output. The size of the contraction may be different today from those projected from historical examples, since remote working one such a large scale was not possible when, for example, the SARS pandemic struck nearly two decades ago. That was before smartphones became ubiquitous. But remote work is not a panacea; not all tasks can be performed remotely even now. Human presence on site is required, especially to handle tangible goods. One Japanese famous manufacturer of health care products, Unicharm, decided to order remote working for all employees, but workers at production factories were excluded from this order so they could meet growing demand for medical masks. Supply shocks in one nation, or in one industry within a nation, become a supply shock in other industries and nations when the thing being supplied is an input into the making of something else. This ‘supply-chain contagion’ will surely be an important element of COVID-19's economic legacy. The three hard-hit East Asian manufacturing giants - China, South Korea, and Japan - account for over 25% of US imports, and over 50% of US imports of computer and electronics products. Apparel and footwear companies are particularly vulnerable to East Asian supply disruptions. The Economist magazine pointed to the vulnerability of the electronics industry with its practice of keeping very lean inventory levels and the lack of alternative sources for many electronic components. The optics sector is likewise highly exposed. The heart of the outbreak, Hubei province, is known as China’s ‘optics valley’ since so many firms manufacturing fibre optic components are located there (these are essential inputs for telecoms networks). Something like a quarter of the world’s optical-fibre cables and devices are in the province. Hubei is also the location of highly advanced microchip-fabrication factories (these make the flash memory chips used, for example, in smartphones). The Economist cites analysts who conjecture that the epidemic in Hubei alone could knock 10% off worldwide shipments of smartphones.[17] The automobile sector, especially in East Asia, is already significantly disrupted by ruptures in international supply chains. For example, a shortage of parts coming from China has forced Korean carmaker Hyundai to shut all its car plants in Korea. The Japanese firm Nissan closed a factory in Japan temporarily. The shock has even reached Europe. Fiat-Chrysler has recently warned that it could soon halt production at one of its European factories. Jaguar Land Rover, a UK-based auto company, announced it might to run out of parts from the end of February. To stave this off, it had flown in emergency supplies from China in suitcases.[18] By contrast, in so far as COVID-19 is a demand shock, imports will fall, and they will fall most in the trade partners of the nations that are most severely hit. Given that the hardest-hit nations account for such a large share of world demand, this mechanism of contagion is likely to be important. And it is likely to be amplified by the wait-and-see mechanisms discussed above. Commodity trade and prices Since the beginning of the crisis, Brent oil prices have dropped from about $69 to about $50 per barrel. This is a large negative shock for oil-producing countries in particular in the Middle East, as Arezki and Nguyen argue in their chapter in this eBook. On the other hand, declining oil prices may provide some relief, for instance for the transport industry. Extrapolating the SARS pattern of impact on air travel, IATA estimates that the aviation industry could face a loss of $29 billion in passenger revenues, which would be partly mitigate by lower fuel costs.[19] Travel and migration restrictions In an effort to slow contagion and be seen as proactive, governments may be tempted to go beyond travel restrictions and quarantine requirements and effectively close borders. Face-to-face contact is an essential part of many businesses, so these restrictions will have dilatory economic consequences domestically and for trading partners. In their chapter, Meninno and Wolff warn that closing borders in Europe would severely impact the almost 1% of employed citizens in the Schengen countries - namely, those who commute across international borders. The economic impact of denying them transit may be sizeable. A different view is taken in the historical chapter by Voth. After discussing the draconian travel restrictions imposed on Marseille during the 1720 plague (which involved troops and a two-metre wall), he asks how much mobility a globalised world can and should have in the future, if health shocks of the type we are experiencing become more frequent. Drawing this out, he points to one of the possible long-term negative consequences of the medical shock and thus persistence of the economic shock: controls on the movement of people - which have been gradually rising in many nations - may rise more and spread to more nations. Deglobalisation policy reactions There are mechanisms of immediate transmission, but policy reactions might put in place policies that could hinder the flow of goods, service and especially people. As Weder di Mauro points in her chapter, this could well make the economic effects more persistent. Companies, individuals and governments are experiencing disruptions which may lead to sudden deglobalisation. Companies are learning the lesson that global supply chains can be abruptly broken by a health shock and will adjust accordingly. Financial intermediaries and regulators are likely to incorporate pandemic shocks into their future risk assessments and stress tests. Societies may learn that other countries react with xenophobia and closing borders. Overall, in times of rising nationalism and populism, people’s fears and suspicions of ‘others’ might become a force for disintegration and deglobalisation. Finally, the virus might become endemic - that is to say, a disease that reappears periodically - in which case COVID-19 could become one of humanity’s constant companions, like the seasonal flu and common cold.[20] Exchange rates A classical vector of crisis contagion in financial crises is the exchange rate. For example, the Asian crisis of the late 1990s involved companies and countries that had borrowed in one currency while earning income in another. A sudden exchange rate devaluation of the Thai currency, for example, almost instantly made many Thai companies bankrupt. The dollar value of their income couldn’t cover the dollar cost of the interest and loan repayment obligations. So far, there is no hint of this mechanism in play. Moreover, the lessons of these crisis has lead to significantly less cross-currency borrowing. Capital flows The last classic mechanism of shock transmission is the sudden stop of capital flows. During last decade’s euro area crisis, for instance, the abrupt lending halt within the euro area is what put nations like Ireland and Portugal in a bind. As with the exchange rate mechanism, this one does not seem to be in play during this crisis - or at least not yet. The size of the economic shocks COVID-19 was first seen as a China shock, then as an Asian regional shock. It is now clear that the virus is travelling, and we are facing a global and common shock. The last time the world suffered a global shock was in the aftermath of Lehman’s collapse in September 2008. By the end of 2008, the North Atlantic subprime crisis had blossomed into the Global Crisis - a financial crisis in many G7 nations with large banking sectors, and a trade crisis for the hundred-plus nations without much banking, but with a dependence on exports. Baldwin and Tomiura argue in their chapter that the evidence from that the Global Crisis of 2008-09 provides an outer limit on the range of likely outcomes this time. That crisis produced what came to be known as the Great Trade Collapse. It was, and still is, the steepest fall of world trade in recorded history, and the deepest fall since the Great Depression. The drop was sudden, severe, and synchronised (Figure 4). Moreover, it was not particularly short as global trade growth stayed in negative territory for more than a year. Figure 4 Quarter-on-quarter growth, world imports volume, 1965 to 2019 Q3 Source: Baldwin and Tomiura, elaboration on WTO online data (www.WTO.org). Boone estimates that a base scenario, in which the outbreak is contained to China and a few other countries, could imply a world growth slowdown of about 0.5% in 2020. In the downside scenario, where the spread is spread widely over the northern hemisphere the 2020 world GDP growth would be reduced by 1.5%. Most of the impact is attributed to lower demand, but in this scenario the negative contribution of uncertainty is also significant. Mann discusses the possibility that this crisis is likely to be U-shaped rather than V-shaped, as has been the case for similar epidemics and other recent supply shocks. Her point is that the linkages discuss will affect different nations differently. It may be a V, i.e. short and sharp with full recovery to the old growth path for some sectors and nations, but much more lingering for others. This suggest that in aggregate it could, at least for manufacturing, look more like a U-shape in the global data. For services, the shock will be hard to recover from so it may look more like an ‘L’. Growth drops for a while, and while it will resume eventually, there will be no catch up. People who skip a few restaurant meals, cinema outings, and holidays in the sun are unlikely to double-up on dining, movie-going and holidaymaking to catch up. The shock to tourism, transportation services, and domestic activities generally will not be recovered. Mann predicts that domestic services also will bear the brunt of the virus outbreak. Figure 5 GDP loss in 2020, deviation from baseline Source: Estimates by McKibbin and Fernando, S4-S7, Global Pandemic Scenarios McKibbin and Fernando estimate the impact of different degrees of severity of a China only and a global shock. In their most severe scenario (with very high infection rate) their impact on 2020 growth four time higher than the Boones adverse case. In this scenarios Japan is the country with the highest hit of almost 10% GDP loss followed by Germany and the US with losses of about 8% each. The policy reactions The behaviour of the virus is one thing; governmental reaction is another. As Weder di Mauro puts it: • “The size and persistence of the economic damage will depend on how governments handle this sudden close encounter with nature and with fear.” On the dark side, it could become an economic crisis of global dimensions and a long- lasting reversal of globalisation. On the bright side, it could be the moment when policymakers manage a common crisis response. They might even manage to rebuild some trust and create a cooperative spirit that helps humanity tackle other common threats like climate change. Wyplosz - in a chapter based on decades of experience advising governments during crisis after crisis - suggests that government reactions to COVID-19 will be something like a Rorschach blot test. Except this time, governemnts’ reactions will reveal the nature of their leaders and, more widely, that of societies. They can fail miserably by trying to hide the truth and being seen as acting opportunistically, or they can rise to the challenge and actually rebuild some trust. Wyplosz points that that once the disease has disappeared from the headlines, people will see what is deeply wrong, or reassuringly good, about the systems in their country. Many things go unnoticed because they have been part of the landscape for so long - for example, the dysfunctional aspects of the US healthcare system. If many lives are lost, the failings will be exposed for all to see. He also raises the deeper question of the extent to which policy reactions to COVID-19 are driven by political factors, and which are driven by lower-frequency things like history, culture, ethnic divisions, political regimes, and election laws on one hand, and the price that societies attribute to the value of life on the other. What can government do to reduce the economic pain? In the adverse scenarios, there will be a need for a strong policy response at the macro level to contain the damage. Box 3 catalogues an array of the many possible economic policy responses. Here we elaborate the main ones. • Both monetary policy and fiscal policy action will be called for, and clearly the most effective action would be an internationally coordinated one. Common approaches and announcements from the major central banks would be preferable to emergency actions from single ones. The emergency rate cut by the Federal Reserve has not made the situation easier for central banks that are already at the effective lower bound. All central banks should signal that they stand ready for coordinated interventions and to provide liquidity in case of serious disruption resulting in stress on financial intermediaries. • Given the nature of this shock, small and medium-sized businesses may be among the most exposed to liquidity issues, thus special facilities to keep lending to small businesses may be appropriate. China, Hong Kong and Singapore have decided on substantial fiscal measures to stimulate demand and boost confidence (almost 2% of GDP in the case of Singapore). • Fiscal measures could quickly be deployed as targeted help for people affected by quarantines and income shortfalls - as has already been done in Italy. In Cochrane’s catastrophic vision, more drastic action would be called for. He proposes a financial crisis plan to “flood the country with money in the right spots as insurance would” with judiciously targeted bailouts as the only way to keep businesses and people from going bankrupt. Box 3 Examples of possible policy measures Below is a selection of measures directed at stimulating incomes and confidence and alleviating liquidity crunches. Some of them have already been implemented, mostly in the ground zero of Asia and in Italy. Targeted measures: Healthcare/confidence Pay bonus for health care workers (Singapore) One-month salary donated by political leadership in solidarity (Singapore) Provide a small amount of face masks to all households (and discourage them from using them as long as they are healthy) (Singapore) Targeted fiscal measures: Households Cash payout to every citizen above 18 years of age of more than US$1,000 (Hong Kong) Suspension of payments for electricity in affected areas (Italy) Support for uninsured households for medical expenses Targeted measures: Firms Subsidised short-term employment schemes for (Germany) Accelerated depreciation for firms (Germany) Sector-specific financial support for tourism, accommodation and aviation (Singapore) Broad-based financial help for businesses, including enhanced absentee payroll support for workers (Singapore) Reduction in profit tax and low interest loans for small and medium-sized firms (Hong Kong) Targeted measures: Monetary/banking Targeted liquidity provision bank funding conditioned on bank lending to small (ECB, TLTROs) Liquidity support to banks General Bscal stimulus package, large and coordinated at G20/EU level Emergency tax reductions Suspension of payments of social security Increase spending Relax fiscal criteria for affected countries in the EU General monetary stimulus package, coordinated at G20 Cut rates (Fed, Bank of Canada, etc.) Quantitative Easing Global/regional disaster insurance/ emergency funding US$50 billion emergency lending (IMF) Scale IFC/EBRD facility to fund private sector in countries affected by the virus (World Bank) Scale up the EU Solidarity Fund to include health related disasters (Proposal) Concluding remarks In 2008, world leaders came together to announce a common response to a common crisis. It was not perfect, but arguably it included coordinated fiscal stimulus and financial packages. And it is clear that the image of the G20 cooperating in the face of a clear and present danger to the world economy contributed greatly to dampening the fear-shock that had rocked the world economy. Today’s leaders are facing a similar stress test and they will be measured by their ability to deal with this common threat in an effective fashion. This is particularly true for Europe. Clearly, the right level of response has to be European and coordinated rather than national and idiosyncratic. The petty divisions that are currently plaguing the Union should be put aside to demonstrate the will and the ability to act together and to show solidarity with those that have been stuck. What is needed at this stage is concrete solidarity such as sharing masks, preparing for opening hospitals to patients from other European countries, seconding nurses and doctors. It will require being flexible with the Stability and Growth Pact and preparing for a concerted fiscal boost if needed. In addition, the EU should also consider what common disaster relieve measures could be deployed. Scaling up the EU Solidarity Fund could be one option. The fund was created in 2002 to support EU member states in cases of large disasters, like floods, earthquakes, volcanic eruptions, forest fires, drought and other natural disasters. The fund can be mobilised upon an application from the concerned country provided that the disaster event has a dimension justifying intervention at the European level.[21] In 2018, the EU Solidarity Fund dispensed almost ˆ300 million in relief for Austria, Italy and Romania following natural disasters. Certainly, the disruptions caused by COVID-19 do amount to the scale of a natural disaster event that would justify intervention at the European level. A scaled-up EU Solidarity Fund could step in to provide relief for affected regions and people and beyond immediate relief would send an important signal. Jean Monnet’s famous words that Europe will be forged in crisis might ring true once more. References Cecchetti, S G and K L Schoenholtz (2020), “Bank Runs and Panics: A Primer,” www.moneyandbanking.com, 2 March. CEPR (2015), “Rebooting the Eurozone: Step 1 - agreeing a crisis narrative”, CEPR Policy Insight No.85. Cochrane, J (2020), “Corona virus monetary policy”, blog, 3 March. IMF (2019), Global Financial Stability Report, Washington DC. Potter, C W (2001), “A history of influenza”, Journal of Applied Microbiology 91(4): 572-579. Reinhart, Carmen and Kenneth Rogoff (2010), “Debt and growth revisited,” VoxEU. org, 11 August (or their book, This Time is Different: Eight Centuries of Financial Folly, Princeton University Press, 2009). Starling, A E (2006), Plague, SARS and the Story of Medicine in Hong Kong, Hong Kong University Press. World Health Organization (2003), “Severe acute respiratory syndrome (SARS): Status of the outbreak and lessons for the immediate future”, Geneva World Health Organization (2009), “Pandemic influenza preparedness and response: a WHO guidance document”, Geneva. World Health Organization (2016), “WHO MERS-CoV Global Summary and risk assessment”, Geneva. About the authors Richard Baldwin has been Professor of International Economics at the Graduate Institute in Geneva since 1991 and Editor-in-Chief of VoxEU.org since he founded it in 2007. He was President/Director of CEPR (2014-2018), and a visiting professor at Oxford (2012-2015), and MIT (2003). He has served as Managing Editor of Economic Policy (2000 to 2005), Policy Director of CEPR (2006-2014) and Programme Director of CEPR's International Trade programme (1991 to 2001). Before moving to Switzerland in 1991, he was a Senior Staff Economist for the President’s Council of Economic Advisors in the Bush White House (1990-1991), following trade matters such as the Uruguay Round and NAFTA negotiations, as well as numerous US-Japan trade conflicts. He has been an adviser and consultant to many international organisations and governments. He did his PhD in economics at MIT with Paul Krugman and has published a half dozen articles with him. Before that he earned an MSc at LSE (1980-81), and a BA at UW-Madison (1976-1980). The author of numerous books and articles, his research interests include international trade, WTO, globalisation, regionalism, global value chains, and European integration. Beatrice Weder di Mauro is Professor of International Economics at the Graduate Institute of Geneva and Distinguished Fellow at the INSEAD Emerging Markets Institute, Singapore. Since July 2018, she has served as President of the Centre for Economic Policy Research (CEPR). From 2001 to 2018, she held the Chair of International Macroeconomics at the University of Mainz, Germany, and from 2004 to 2012 she served on the German Council of Economic Experts. She was Assistant Professor at the University of Basel and Economist at the International Monetary Fund. She held visiting positions at Harvard University, the National Bureau of Economic Research and the United Nations University in Tokyo. She has served as consultant to governments, international organizations and central banks (European Commission, International Monetary Fund, World Bank, European Central Bank, Deutsche Bundesbank, OECD, among others). She has published widely in leading academic journals, including the American Economic Review, Journal of International Economics, Brookings Papers on Economic Activity, Journal of Public Economics, Journal of Development Economics and Review of Finance. She is an independent director on the board of Bombardier, UBS and Bosch. She is a senior fellow at the Asian Bureau of Finance and Economics Research (ABFER), a member of the ETH Foundation, the International Advisory Board of Bocconi and a member of the Bellagio Group. 1
More on the topic Introduction:
- Introduction
- Introduction
- Introduction
- INTRODUCTION
- Contents
- Contents
- Contents
- Contents
- Contents
- Contents