MAJOR CONCEPTS OF NETWORK SCIENCE
In order to systematically describe and analyze networked configurations, graph theory and network analysis have developed a proper ‘language’, a coherent body of concepts. One of the key pursuits of network science is the uncovering of stable relationships between network structure and outcomes.
Attributes of a network, such as its density or the centrality of nodes, influence the flows of information and hence may have predictable consequences for outcomes. It is therefore necessary to briefly explain the key concepts used to describe networks.4.3.1 Elementary Concepts
Networks and graphs are sets of nodes (vertices, points) and edges (links). The various concepts are illustrated in Figure 4.2 using a graph designed by Brandes and
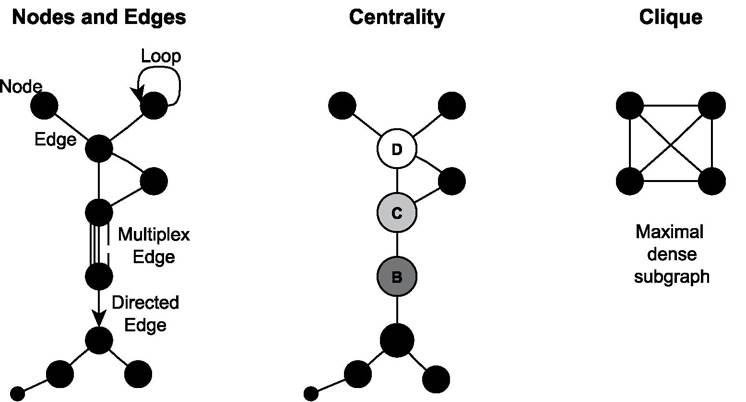
Source: Based on Brandes and Hildenbrand (2014).
Figure 4.2 Elementary concepts of network research
Hildenbrand (2014) for didactic purposes. Edges can be directed (arcs) or undirected, weighted (positive or negative, and strong or weak), or unweighted (binary). A reflexive edge is also called a loop. If a graph contains multiple edges of different quality it is called multiplex.
Nodes are adjacent if they are directly connected by an edge. A node’s degree is the number of edges to which it is related. In-degree measures the number of incoming and out-degree the number of outgoing edges. An isolate node is not adjacent to any other node and has a degree of 0. A walk in a graph is an alternating sequence of nodes and edges, and the length of a walk is the number of edges (including repetitions). A trail in a graph is a walk in which no edge occurs more than once. A Eulerian trail is a walk that contains each edge only once - the formalization of the above-mentioned Konigsberg Bridges Problem. A path is a trail in which no vertex is repeated.
The distance between two nodes in a graph is the length of the shortest walk between them, also called geodesic. A graph is connected if there is a walk between every pair of nodes.Graphs may contain different sets of nodes. A bipartite graph can be partitioned into two sets in such a way that no edge connects two nodes in the same set. In social network analysis such a configuration is also called a two-mode network. Based on these different concepts the topology of graphs and networks can be described in a systematic way. A complete graph is one in which every node is connected to all other nodes, that is, every pair of nodes is connected by an edge (also referred to as a fully connected network). Such a graph has maximal density of 1.0, as density is the number of edges in a graph expressed as a proportion of the maximum possible number of edges. In a complete bipartite graph every node of one set is connected to every node in the other set.
A graph is regular when every node is of the same degree; it is k-regular if every node is of degree k. A k-regular graph of k = 2 is a ring. A 4-regular graph is a hexagram combined with a hexagon. Another well-structured form is a star, which is defined as a connected graph in which only one node has a degree greater than 1. A star graph is a maximally centralized graph where the node with multiple degrees is located at the most central position.
Centrality is a topological concept for the description of relative positions of nodes. In social network analysis there are many different ways to specify node centrality. The most basic one equates centrality with degree. In this perspective, node D in the Brandes and Hildenbrand graph is most central. Another concept is centrality based on closeness developed by Bavelas (1948) where the most central node(s) have the shortest path lengths to all other nodes (node C). Freeman (1977) developed a centrality concept based on betweenness, where such nodes are most central that are most frequently located on geodesic distances between all pairs of nodes (node D).
Connectivity of a graph is described by the average length of the shortest paths between all pairs of nodes in the network.Graphs can also be described with respect to their internal grouping or ‘clustering’. A part of a graph is a subgraph. A clique in an undirected graph is a subgraph in which all nodes of the subgraph are connected to all other nodes of the subgraph. A clique of four, for instance, is a subgraph with four nodes that are all connected (see Figure 4.2). The degree to which subgraphs come close to a clique can be specified by the local clustering coefficient (Watts and Strogatz, 1998). At global network level clustering can be measured on the basis of triplets of nodes, that is, three nodes that are connected by either two (open triplet) or three (closed triplet; clique) undirected ties. Watts and Strogatz’s (1998) global clustering coefficient is the number of closed triplets over the total number of triplets (both open and closed).
At least three levels of analysis and various concepts that are related to these levels can be distinguished in network studies. Density, centralization and clustering concepts describe characteristics of global networks, that is, macro structures of graphs. Subgraphs, cliques and components describe the meso structure of a graph. Centrality describes the individual positions of nodes, that is, the micro structure. Almost all these concepts have been the basis of social network analysis for decades. However, some are recent innovations for which the network scientists from mathematics and physics (Strogatz, 2001; Barabasi and Frangos, 2002; Watts, 2004; Newman, 2012) have to be credited. One of their main contributions was the discovery of specific forces and mechanisms behind network evolution and network formation.
4.3.2 Network Formation and Evolution
Against this theoretical background, from the perspective of a general network theory, network science raises the question: what forces are shaping network development and creating specific network structures? Are there general principles and mechanisms that can be found in networks of any kind? A major finding of network science is that empirical networks are neither regular nor random.
Most exhibit small-world features (Watts, 2004) in the sense that densely connected subgraphs are interlinked by a few edges, creating the typical feature of organized complexity that Simon (1962) had already noticed. In a small world network a few hub-nodes connect multiple clustered subgraphs so that geodesics in the global networks are shortened. Experiments have shown that (almost) every person on the planet is linked to everybody else in the world by relatively few edges. The eminent task of network scientists was then to use computer simulation to show how such networks grow out of local interactions rather than global design.A key mechanism for network growth is ‘preferential attachment’. In creating new links, nodes prefer to connect to other nodes with high degrees. Based on a simple example in which a network starts from scratch and grows in each sequence by a new node establishing two additional links, Barabasi and Frangos (2002, p. 86) state this dynamic more formally:
The probability that [the new node] will choose a given node is proportional to the number of links the node has. That is, given the choice between two nodes, one with twice as many links as the other, it is twice as likely that the new node will connect to the more connected node.
Such a rich-get-richer mechanism has been known for more than 2000 years. Merton (1968) called it ‘the Matthew effect’, after a passage in the Bible: ‘For unto every one that hath shall be given, and he shall have abundance: but from him that hath not shall be taken away even that which he hath’ (Matthew 25:29, King James Version). In economics these types of interdependency are discussed as network effects and externalities. Their implications for market structures have been discussed for the telecommunications sector (Katz and Shapiro, 1985) and more recently for information industries (Noam, 2009).
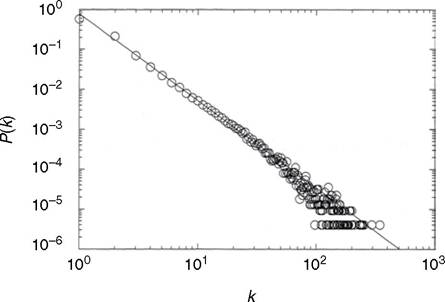
Source: Pastor-Satorras and Vespignani (2007, p.
45).Figure 4.3 Power-law distribution: probability P(k) that any given vertex has degree k
Network scientists attribute this outcome to the pervasive presence of ‘power laws’. When these are in play, networks develop a hierarchical structure: a few nodes have many links, and many nodes exhibit few links. The overall degree distribution follows an exponential decay curve. If the distribution pattern is presented in logarithmic scales (log-log plots) it becomes linear, as Figure 4.3 shows. In economics such patterns are familiar from the distribution of incomes (Pareto law) or city sizes (Zipf law or rank-size property) (Reed, 2001).
This pattern also is called ‘scale-free,’ denoting ‘invariance under rescaling’ (Mitchell, 2009). Many network scientists claim that all or most networks display similar distributions (many nodes with few links, few hub-nodes with many links), governed by a power law, regardless of the scale in which they are presented (Barabasi and Frangos, 2002). Preferential attachment and power laws would thus be a universal dynamic governing all networks. Clauset et al. (2009) present dozens of datasets on different items such as words in novels, interaction links in cells, telephone calls, numbers of customers affected in electricity blackouts, numbers of adherents of religious groups, co-authorships or citations in science, and so on. The most prominent examples are related to the Internet, for example, where nodes are websites and edges are directed URL hyperlinks, or IP addresses and Internet connections, and so on. This topic will be treated in more detail in the next section, where network science is applied to the topology of the Internet. Clauset et al. (2009, p. 689) conclude that the ‘study of power laws spans many disciplines, including physics, biology, engineering, computer science, the earth sciences, economics, political science, sociology, and statistics’.
At a general level, however, it is still a matter of debate as to whether this is really an iron and universal law (e.g., see the skeptical statements by Mitchell, 2009).
Willinger et al. (2010) go so far to call the universality of the scale-free feature in the Internet a myth. One reason is that many factors influence network evolution, not only preferential attachment. Another strong mechanism is homophily, denoting the tendency of nodes to create connections to other nodes with similar attributes, as expressed in the proverb ‘birds of a feather flock together’ (McPherson et al., 2001; Monge and Contractor, 2003). There is a range of other motives for nodes to be connected to other nodes, which are not always relational but may also depend on intrinsic characteristics of nodes or legal rules. In political life, for instance, there are institutional rules establishing that some political actors (nodes) are only allowed to communicate with particular other classes of actors. Leifeld and Schneider (2012) test multiple driving forces of network formation.4.4