Oligopoly in theory and practice
In this chapter we first record the growth of market domination by the few, using the most recent statistics on the size distribution of firms, on concentration ratios, and on advertising expenditures.
We then consider attempts to explain and predict behaviour in oligopoly markets, closely relating theory to actual practice. Attempts to explain firm behaviour when there is no collusion have involved various reaction curve models (including kinked demand), and more recently game theory. However, collusion can and does take place, sometimes formally, as in cartels, or more often tacitly, under various types of price leadership.
The definition and measurement of oligopoly
Oligopoly may be defined as an industry in which there are few firms and many buyers. However, this definition begs two important questions. First, how many is ‘few’? Broadly speaking, the number of firms should be sufficiently small for there to be ‘conscious interdependence’, with each firm aware that its future prospects depend not only on its own policies, but also on those of its rivals. Second, what is an industry? In theory, an industry is defined as a group of firms whose products are close substitutes for one another (i.e. the products have high and positive cross-elasticities of demand).1 In practice, precise calculations of cross-elasticities of demand are impossible to make, and an industry is defined either by approximate similarity of output (such as the confectionery industry) or by similarity of the major input (such as the rubber industry, which makes a wide variety of goods from shoe soles to tyres).
Bearing in mind these problems of precise definition, the rise of oligopoly can be charted in a variety of ways.
Table 6.1 Company shares of the UK market by sector/product 2009/10.
Percentage share of the UK market
| Sector/ Product group | Three largest companies | Five largest companies |
| Tobacco | 91 | 98 |
| Chocolate | ||
| confectionery | 78 | 87 |
| Electrical retailers | 75 | 82 |
| Tour operators | 68 | 75 |
| Coffee shops | 65 | 74 |
| DIY | 57 | 63 |
| White goods | 57 | 78 |
| Motor Insurance | 51 | 63 |
| Bottled water | 48 | 58 |
| Women's fragrancies | 48 | 71 |
| Vacuum cleaners | 45 | 57 |
| Branded watches | 28 | 38 |
| Footwear retailing | 22 | 26 |
Source: Mintel International Group Ltd (2010), Mintel Reports (various) and other sources.
Concentration ratios
Perhaps the most usual method of measuring the degree of oligopoly is through concentration ratios.
These show the proportion of output or employment in a given industry or product group which is accounted for by the dominant firms operating in those areas. The oldest concentration ratio used in the UK within manufacturing was the 100-firm ratio which measures the share of the 100 largest private firms in total manufacturing net output. This ratio increased from 16.0% in 1909 to 41.7% in 1975, before falling back to 32% by 2010, indicating the progressive concentration of economic power within UK manufacturing over the first three-quarters of the twentieth century, followed by a fall in such domination over the past 35 years.The more normal way of measuring concentration ratios is to calculate the proportion of output or employment contributed by the three, four or five largest firms in that industry or product group.
Table 6.1 provides details of the three- and five- firm concentration ratios in various sector and product groups. As one would expect, the cigarette sector in 2009/10 is dominated by Imperial Tobacco, Gallaher and Rothmans UK while the chocolate confectionery sector is similarly controlled by Cadbury, Trebor Bassett, Masterfoods (Mars) and Nestle. However, high concentration ratios are also to be found in DIY retailing, with B&Q and Homebase being the main players in the market, while in motor insurance, companies such as the RBS Group, Aviva and Zurich Financial Services are dominant. Some of the product groups which show less concentrated control include bottled water (Volvic, Evian and Highland Spring) and luxury watches (Rolex, Omega, Gucci, Cartier, etc.). These are markets where there is arguably product space for smaller specialized niche producers.
Often consumers are not aware that a few firms dominate certain markets because each company produces a variety of models or brands that appear on the surface to be unrelated to each other, as for example with Diageo plc which produces brands such as Smirnoff vodka, Bell’s whisky and Gordon’s gin, and controls 20% of the UK spirit market.
It is often useful to examine product groups if we wish to see the true extent of market domination by a few firms.Advertising expenditure
Data on advertising provide a useful, if indirect, method for gauging both the rise of oligopoly markets and the tendency towards product differentiation. Advertising is essentially aimed at binding consumers to particular brands for reasons other than price. Estimates in the US of branded, processed foods put their prices almost 9% higher than ‘private label’ equivalents - similar products packaged under the retailer’s own name - due solely to more extensive media advertising.2
One way of understanding the impact of advertising on oligopolistic markets is to study the total advertising expenditure of the top 15 companies, as listed in Table 6.2. For example, the two companies (COI is a governmental department) which dominated UK advertising in 2009 were Unilever and Procter & Gamble. The figures shown here include the advertising expenditure of all the major subsidiaries of the two groups operating in a wide range of sectors from food and household goods to health, beauty and cosmetics. The list of top advertisers in Table 6.2 reflects competitive activity in their product/sectors of operation. For example, in the market for concentrated liquids used for clothes washing, Proctor & Gamble brought out its Ariel ‘Excel Gel’ format in late 2008 in order to compete with Unilever’s successful launch of Persil ‘Small and Mighty’ concentrated gel which was launched in 2007. In the stain remover market, Proctor & Gamble introduced its new Ariel stain remover in March 2010 to compete with Reckitt Benckiser’s dominant ‘Vanish’ stain remover which controlled 79% of the market. The list of top advertisers is also dominated by four grocery supermarket chains. Here we see that Tesco, Asda, Morrison and Sainsbury’s together spent an impressive £324m or about a quarter of the total advertising expenditure of the top 15 companies, as they vied with each other for customers.
In contrast, the top four car companies (not shown) only spent £136m on advertising due to the effects of the recession on the marketing budgets of these companies.The companies noted above all advertise their branded products intensively in order to ‘bind’ the consumer to the product for reasons other than price.
Table 6.2 Top 15 advertising companies in the UK, 2009.
Advertising expenditure
| Rank | Company | (£m) |
| 1 | COI | 207.90 |
| 2 | Proctor & Gamble | 154.98 |
| 3 | Unilever UK | 129.06 |
| 4 | British Sky Broadcasting | 108.85 |
| 5 | Tesco | 104.56 |
| 6 | Asda Stores | 98.66 |
| 7 | DFS Furniture | 93.81 |
| 8 | Reckitt Benckiser (UK) | 84.44 |
| 9 | Kelloggs Co of GB | 80.13 |
| 10 | L’Oreal Paris | 73.54 |
| 11 | Nestle | 63.53 |
| 12 | Wm Morrison Supermarkets | 61.60 |
| 13 | Sainsbury’s Supermarkets | 59.12 |
| 14 | GlaxoSmithKline | 58.43 |
| 15 | Orange | 54.15 |
Note: COI is advertising by the Central Office of Communication.
Source: Modified from Marketing (2010b) Top 100 Advertisers, 24 March.
Where successful, such advertising may help shift the demand curve outwards, raising market share, while simultaneously causing the demand curve to pivot and become steeper. Demand then becomes less price elastic, creating new opportunities for raising both price and revenue.
Oligopoly in theory and practice
The central task of market theory is to predict how firms will set prices and output. In perfect competition and pure monopoly we can make definite predictions. In perfect competition it can be shown that in the long run price will be equal to the lowest possible average costs of the firm - what Adam Smith called ‘the natural price’. In pure monopoly the firm seeking to maximize profits will restrict output and raise prices until marginal revenue exactly equals marginal cost.
In oligopoly, where there are few firms in the market, and where there is product differentiation, there can be no such precision. Where the number of firms is sufficiently small for each firm to be aware of the pricing policy of its rivals, it will have to try to anticipate its rivals’ reactions to its own pricing decision. Further, where products are differentiated, the firm will have to estimate the degree of brand loyalty customers have for its products - the greater that loyalty, the smaller the effect of price changes on consumer demand. This constant need to anticipate the reaction of both rivals and consumers creates a high degree of uncertainty in oligopoly markets.
Despite this uncertainty, the importance of the oligopoly-type of market structure in modern economies has encouraged the quest for theories to explain and predict firm behaviour. Although little progress seems to have been made in devising a general theory of oligopoly behaviour, some progress has been made in understanding the behaviour of particular firms in particular oligopoly situations. We might usefully review a number of such theories, keeping a close eye on firm practice.
Non-collusive oligopoly
First, we consider situations in which each firm decides upon its strategy without any formal or even tacit collusion between rivals. There are essentially three approaches the firm can adopt to handle interdependence when oligopoly is non-collusive.
1 The firm could assume that whatever it decides to do, its rivals will not react, i.e. they will ignore its strategies. This assumption may reasonably be valid for day-to-day, routine decisions, but is hardly realistic for major initiatives. The Cournot duopoly model is, however, of this type. Each firm simply observes what the other does, and then adopts a strategy that maximizes its own profits. It makes no attempt to evaluate potential reactions by the rival firm to its own profit-maximizing strategy.
2 The firm could assume that rivals will react to its own strategies, and use past experience to assess the form that reaction might take. This ‘learning’ process underlies the reaction-curve model of Stackleberg. It also underlies the kinked-demand model (see below), with firms learning that rivals do not match price increases, but certainly do match any price reductions.
3 Instead of using past experience to assess future reactions by rivals, the firm itself could try to identify the best possible move the opposition could make to each of its own strategies. The firm could then plan counter-measures if the rival reacts in this (for the rival) optimal way. As we see below, this is the essence of game theory.
Approaches 2 and 3 might lead us to expect a considerable amount of price movement, as rivals incessantly formulate strategy and counter-strategy. In practice, however, the oligopolistic industries experience short bursts of price-changing activity (often linked to price warfare), together with longer periods of relatively stable or rigid prices. We briefly review these two types of situation, noting the relevance of kinked-demand theory to stable prices, and conclude our discussion of non-collusive behaviour with an outline of game theory.
Price warfare
Price-cutting is a well-attested strategy for oligopoly firms, for both raising and defending market share. This can, of course, lead to a competitive downward spiral in firm prices, resembling a ‘price war’. Examples of this abound. We will see, in Chapter 9, how price warfare developed amongst petrol retailers. In 1996, for example, stagnant demand for petrol due to increasing taxes, and more fuel-efficient cars coupled with competition from supermarkets, led the UK’s largest petrol retailer, Esso, to announce aggressive price cuts to maintain its dominant position. Shell, BP and Conoco (Jet) responded by matching or undercutting Esso’s price cuts. The catalyst for the new strategy was that Esso’s share of the petrol market had fallen to around 17% as compared to the supermarkets’ share of 25%.
In 1996, the cross-channel transport business saw a fierce outbreak of price warfare. Of the 35 million passengers using the cross-channel route, 35% went by Eurotunnel, 32% by P&O European Ferries and 20% by Stena Line. Between 1993 and 1996, peak season cross-channel fares fell by 60% as the ferries tried to resist the challenge of the Channel Tunnel. For example, the standard brochure fares for a crossing in the summer of 1996 involving a car and four passengers were heavily discounted on the shorter Dover/Calais (ferries) and the Folkestone/Calais (Le Shuttle) routes. Actual ferry prices were cut to around 40% of the standard return price while Le Shuttle prices were cut to 80% of their normal fares. Most of the operators were charging around £100 for a return fare involving a car and four passengers. In order to use its ships to capacity, P&O’s policy was to match any rival company’s discount. The presence of price warfare is also endemic in the financial sector as illustrated by the price competition between Visa and Europay, the two payments card groupings, over the fees they charge to their member banks in Europe for using their product. After a four-year cost-cutting programme prior to 1998, Europay (which runs the Eurocard debit card scheme and Mastercard) decided to undercut Visa’s fees by 20% in early 2000. Visa’s response was to announce a programme aimed at undercutting Europay by 25% between 2000 and 2001.
One of the most dynamic areas for oligopolistic price warfare activity in more recent times occurred in the games console market during the period 200102 when Sony (Playstation 2), Microsoft (Microsoft XBox) and Nintendo (GameCube) fought for market share. In November 2001 Sony decreased the price of its Playstation 2, a move which led Microsoft to decrease the price of its new Microsoft XBox from £300 to £199 in April 2002. Nintendo followed in May 2002 with a discounted price of £129 for its new GameCube console. By October 2002, the most aggressive aspect of the console price war seemed to be over as the protagonists concentrated on the next generation of consoles due in 2005. The new generation arrived on the scene between 2005 and 2006 when Microsoft’s Xbox360, Sony’s PS3 and Nintendo’s Wii were launched. After an initial period when the companies typically distinguish themselves through product differentiation strategies, they usually resort to price warfare as they compete for increased market share, in this case perhaps up to around 2014 when a further generation of games consoles may emerge. An example of such price warfare happened in August 2009 when Microsoft decreased the price of its Xbox 360 Elite gaming machine from $399 to $299, and the price of its Xbox Pro from $299 to $249. This was in part a reaction to Sony’s introduction of the new PlayStation 3 Slim (PS3) gigabyte hard drive at a relatively low price of $299 - a drop of $100 for the PS3 which had found itself trailing behind its competitors, the Xbox 360 and Nintendo’s Wii. Similarly in October 2010 Waitrose reduced the price of 1000 own-brand items to counter the discounted price of Tesco ownbrand products.
Price decreases are made possible not only by the economies of scale achieved in the production of consoles, but also by companies cross-subsidizing their consoles in order to drive up software sales (e.g. in 2003 Microsoft was known to be losing £60 on each XBox sold).
Clearly in oligopolistic markets, where only a few firms dominate, a price-cutting strategy by one is likely to be followed by others. After short bursts of price warfare, the market may settle down into prolonged periods of price stability, although the fact that firms no longer compete in price may not mean an absence of competition. In periods of price stability, non-price competition often becomes more intense, with advertising, packaging and other promotional activities now used to raise or defend market share. For example, in the food retailing business, advertising is a well-known form of nonprice competition. In 2009 Tesco spent £104.6m on advertising, Sainsbury’s £59.1m and Asda £98.7m. Coupled with this overall advertising strategy, there have been other efforts at product differentiation, such as the ‘green grocer’ campaigns to promote environmentally friendly products. Similarly, the loyalty cards introduced by Tesco (Clubcard), and Sainsbury (Reward card) were designed to reinforce brand loyalty and make customers less price sensitive. In economic terms, this was designed to make demand curves less elastic, giving the supermarkets more opportunity to raise prices at a later date if necessary.
Non-price competition may take forms other than advertising and quality considerations. In the mid- 1990s when price competition was intense in the travel industry, there were still signs that companies were using other non-price methods to increase market share. For example, Thomson’s industrial strategy of vertical integration towards the market (owning Lunn Poly and Britannia Airways) was strengthened further in 1994 by its purchase of the Country Holidays Group which gave it a major interest in the UK holiday lettings industry. Vertical integration was also involved in the acquisition by Thomas Cook in 1998 of the US Carlson group (owner of Caledonian Airways and the tour operator ‘Inspirations’). Between 2001 and 2002 both Thomson and Thomas Cook experienced further integration when each was taken over by a German-owned leisure group in
a period of fierce competition in the European holidays industry. Such takeover strategies are an important ‘non-price’ method by which firms in oligopolistic industries continue to compete with one another.
In the game console industry, some of the nonprice types of competition had already been ‘inbuilt’ in the original product differentiation between the consoles. Microsoft Xbox had the best on-line service; Playstation had more multimedia capacity and played Blu-ray discs; and the Wii’s product range placed paramount importance on the social gamer. By 2010, all three console manufacturers were aiming for both the core gaming audience and the family audience. Hence the emergence of ‘warfare’, not in terms of prices but in terms of non-price factors, i.e. ‘add-ons’ such as Move for Sony Playstation 3 and Kinect for Microsoft’s Xbox 360.
Price stability
That price in oligopoly will tend to have periods of stability is, in fact, predicted by economic theory.
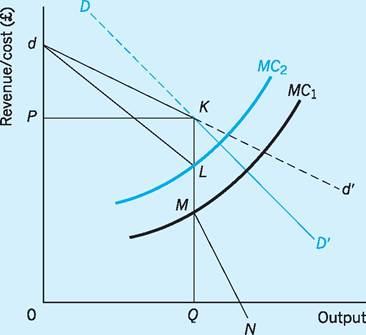
Fig. 6.1 Kinked demand curve and price stability. Notes: d-d' = Demand curve when rivals do not follow price changes.
D-D' = Demand curve when rivals do follow price changes.
dKD' = Kinked demand curve.
dLMN = Associated marginal revenue curve.
Kinked demand
In 1939 Hall and Hitch in the UK and Sweezy in the USA proposed a theory to explain why prices often remain stable in oligopoly markets, even when costs rise. A central feature of that theory was the existence of a kinked-demand curve.
To illustrate this we take an oligopolistic market which sells similar but not identical products, i.e. there is some measure of product differentiation. If one firm raises its price, it will then lose some, though not all, of its custom to rivals. Similarly, if the firm reduces its price it will attract some, though not all, of its rivals’ custom. How much custom is lost or gained will depend partly on whether the rivals follow the initial price change.
Extensive interviews with managers of firms in oligopoly markets led Hall and Hitch to conclude that most firms have learned a common lesson from past experience of how rivals react. Namely, that if the firm were to raise its price above the current level (P in Fig. 6.1), its rivals would not follow, content to let the firm lose sales to them. The firm will then expect its demand curve to be relatively elastic (dK) for price rises. However, if the firm were to reduce its price, rivals would follow to protect their market share, so that the firm gains few extra sales. The firm will then expect its demand curve to be relatively inelastic (KD') for price reductions. Overall the firm will believe that its demand curve is kinked at the current price P, as in Fig. 6.1.
One can intuitively see why this belief will lead to price stickiness, since the firm will rapidly lose market share if it raises price, and gain little from reducing price. A kinked-demand (average revenue) curve of the form dKD' will have a discontinuity (L-M) in its associated marginal revenue curve below the kink point K.3 The marginal cost curve could then vary between MC1 and MC2 without causing the firm to alter its profit-maximizing price P (or its output Q).
A number of industries have exhibited price stability, despite rising costs. The UK confectionery industry in the 1980s, dominated by Mars, Nestle Rowntree (which absorbed Rowntree Mackintosh in 1988) and Cadbury Schweppes, was a good example of this tendency. During some periods in the 1980s, price wars were often avoided, though competition between these companies still continued in other forms. For example, in the mid-1980s non-price competition took the form of product weight. In one such period, Mars raised the weight of Mars bars by 10%, Cadbury raised the weight of its Fruit & Nut by 14% and Rowntree Mackintosh raised the weight of Cabana by 15% and increased the chocolate content of KitKat by 5%. In all of these cases the firms accepted rises in their costs, i.e. more ingredients per bar, without changing price.
Similarly in the 1990s, competition in the UK snacks market increased as the three major companies, KP Foods, Smiths and Walkers (owned by the US company, PepsiCo) and Golden Wonder (the Dalgety subsidiary), looked for new ways of competing. KP foods introduced its new crisp-like snack called ‘Frisp’ and spent £4.4m on marketing it in the first three months alone. To prevent being squeezed out by its two big rivals, Golden Wonder planned to launch a few new products in the middle of 1990 and in the meantime increased the packet size of all its crisps and snacks from 28 grams to 30 grams without raising prices. In 2010 Mars, the chocolate manufacturer, spent over ˆ10m over five years to produce lower saturated fat versions of its Mars bars, Snickers and Milky Way brands. This cost was absorbed without significant changes to prices as the company tried to remain competitive by developing its healthconscious image.
In terms of our kinked oligopoly model, the companies noted above preferred to accept the higher costs of non-price competition (which can be illustrated by the upward shift in the MC curve), rather than engage in price warfare, in order to gain market share. The reason for this is that companies sometimes believe they have a better idea of the costs and benefits involved in non-price competition as compared to the unknown risks of getting involved in price competition. When a company becomes involved in price competition, gains and losses are more difficult to assess because they depend on the reactions of competitors to the initial company’s pricing strategy.
Despite the usefulness of the kinked oligopoly model as a descriptive tool in the understanding of oligopoly behaviour, it still faces a number of problems.
1 The theory does not explain how oligopolists actually set an initial price, but merely why a price, once set, might be stable. Kinked demand is not a theory of price determination.
2 The observed stickiness of prices may have little to do with the rival-firm reaction patterns of kinked- demand theory. It is, for instance, administratively expensive to change prices too often.
3 The assertion, implicit in kinked-demand theory, that prices are more ‘sticky’ under oligopoly than under other market forms, has not received strong support from empirical studies (Wagner 1981). For instance, Stigler, in a sample of 100 firms across 21 industries in the USA, had concluded as early as the 1940s that oligopoly prices hardly merited the description ‘sticky’. Domberger, in a survey of 21 UK industries, found that the more oligopolistic the market, the more variable was price (Domberger 1980).
4 The precise nature of any kink in the demand curve may depend on the economic conditions prevailing at the time. For example, a study of 73 small owner-managed firms in Scotland found that price increases were more likely to be followed during booms, whilst falls were more likely to be followed during times of recession (Bhaskar et al. 1991).
Game theory
One of the more recent attempts to assess non- collusive behaviour by oligopolists has involved game theory. The intention is to go beyond the rather general reaction patterns of earlier theory, to more explicit assessments of strategy and counter-strategy. We might usefully illustrate the principles involved by a simple two-firm (duopoly) game, involving market share. By its very nature, a market share game must be ‘zero sum’, in that any gain by one ‘player’ must be offset exactly by the loss of the other(s).
Suppose Firm A is considering two possible strategies to raise its market share, a 20% price cut or a 10% increase in advertising expenditure. Whatever initial strategy A adopts, it anticipates that its rival, Firm B, will react by using either a price cut or extra advertising to defend its market share. Firm A now evaluates the market share it can expect for each initial strategy and each possible counter-strategy by B. The outcomes expected by A are summarized in the payoff matrix of Table 6.3.
If A cuts price, and B responds with a price cut, A receives 60% of the market. However, if B responds with extra advertising, A receives 70% of the market.
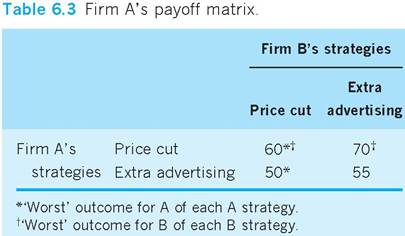
The ‘worst’ outcome for A (60% of the market) will occur if B responds with a price cut. If A adopts the strategy of extra advertising, then the ‘worst’ outcome for A (50% of the market) will again occur if B responds with a price cut. If A expects B to play the game astutely, i.e. choose the counter-strategy best for itself (worst for A), then A will choose the pricecut strategy as this gives it 60% of the market rather than 50%. If A plays the game in this way, selecting the best of the ‘worst possible’ outcomes for each initial strategy, it is said to be adopting a ‘maxi-min approach’ to the game.
If B adopts the same maxi-min approach as A, and has made the same evaluation of outcomes as A, it also will adopt a price-cut strategy. For instance, if B adopts a price-cut strategy, its ‘worst’ outcome would occur if A responds with a price cut - B then gets 40% of the market (100% minus 60%), rather than 50% if A responds with extra advertising. If B adopts extra advertising, its ‘worst’ outcome would again occur if A responds with a price cut - B then receives 30%. The best of the ‘worst possible’ outcomes for B occurs if B adopts a price cut, which gives it 40% of the market rather than 30%.
In this particular game we have a stable equilibrium, without any resort to collusion. Both firms initially cut price, then accept the respective market shares which fulfil their maxi-min targets - 60% to A, 40% to B. There could then follow the price stability which we have seen to be a feature of some oligopoly situations. In some games the optimal strategy for each firm may not even have been an initial price cut, but rather non-price competition (such as advertising). Game theory can predict both price stability and extensive non-price competition.
The problem with game theory is that it can equally predict unstable solutions, with extensive price as well as non-price competition. An unstable solution might follow if each firm, faced with the pay-off matrix of Table 6.3, adopts entirely different strategies. Firm B might not use the maxi-min approach of A, but take more risk.4 Instead of the price cut it might adopt the ‘extra advertising’ strategy, hoping to induce an advertising response from Firm A and gain 45% of the market, but risk getting only 30% if A responds with a price cut. Suppose this is what happens. Firm A now receives 70% of the market, but B only receives 30%, which is below its initial expectation of 45%. This may provoke B into alternative strategy formulation, setting off a further chain reaction. The game may then fail to settle down quickly, if at all, to a stable solution, i.e. one in which each firm receives a market share which meets its overall expectation. An unstable solution might also follow if each firm evaluates the payoff matrix differently from the other. Even if they then adopt the same approach to the game, one firm at least will be ‘disappointed’, possibly provoking action and counteraction.
If we could tell before the event which oligopoly situations would be stable, and which unstable, then the many possible outcomes of game theory would be considerably narrowed. At present this is beyond the state of the art. However, game theory has been useful in making more explicit the interdependence of oligopoly situations.
Developments in game theory
A number of other ideas are widely presented in game theory approaches:
■ Dominant strategy. In this approach, the firm seeks to do the best it can (in terms of the objectives set) irrespective of the possible actions/ reactions of any rival(s).
■ Nash equilibrium. This occurs when each firm is doing the best that it can in terms of its own objective(s), given the strategies chosen by the other firms in the market.
■ Prisoner’s dilemma. This is an outcome where the equilibrium for the game involves both firms doing worse than they would have done had they colluded, and is sometimes called a ‘cartel game’ because the obvious implication is that the firms would be better off by colluding.
There are different types of game to which these ideas might be applied.
One-shot game
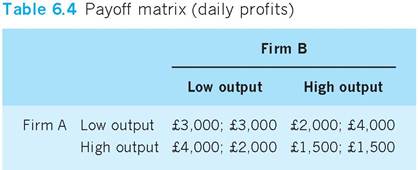
The suggestion here is that the decision to be made by each firm is ‘once for all’. We can illustrate this type of game using Table 6.4, which is a payoff matrix that expresses the net gains for each of two firms in terms of daily profit, the first value being that for Firm A and the second value that for Firm B. The single policy variable shown here is output level, which can be set high or low, with the payoff dependent on the rival’s reaction. Clearly this is a non-zero sum game since the total daily profit for each combination of policies varies rather than remains constant (for example, total profit is £3,000 in the bottom right quadrant but £6,000 elsewhere).
Suppose, initially, that we treat this situation as a one-shot game.
■ ‘High output’ would be the dominant strategy for each firm, giving both Firm A and Firm B £4,000 in daily profit should the other firm select ‘low output’. However, if both firms follow this dominant strategy and select ‘high output’, they each receive only £1,500 daily profit.
■ If each firm follows a maxi-min decision rule, then Firm A selects ‘low output’ as the best of the worst possible outcomes (£2,000 > £1,500), as does Firm B (£2,000 > £1,500). The combination (low output, low output) will then be a Nash equilibrium, with each firm satisfied that it is doing the best that it can in terms of its own objective, given the strategy chosen by the other firm (each actually receives £3,000).
■ If each firm follows a mini-max decision rule, you should be able to show that both Firm A and Firm B will still select ‘low output’ as the worst of the best possible outcomes (£3,000 < £4,000 for each firm). The combination (low output/low output) remains a Nash equilibrium.
Even if one firm follows a maxi-min and the other a mini-max decision rule, the combination (low output/low output) will remain a Nash equilibrium in this particular game. We could reasonably describe this output combination (low/low) as a stable, Nash- type equilibrium.
Repeated game
However, should we view the pay-off matrix in Table 6.4 as part of a repeated game, then the situation so far described might be subject to considerable change. We might expect the respective firms to alter the strategies they pursue and the game to have a different outcome.
Suppose the firms initially establish the low output/low output ‘solution’ to the game, whether as the result of a ‘Nash equilibrium’ or by some form of agreement between the firms. Unlike the one-shot game, a firm in a repeated game can modify its strategy from one period to the next, and can also respond to any changes in strategy by the other firm.
■ Cheating. If Table 6.4 is now viewed as the payoff matrix for a repeated game, there would seem to be a possible incentive for either firm to depart from its initial ‘low output’ policy in the next period. Had the initial ‘low output’ policy been mutually agreed by the two firms in an attempt to avoid the mutually damaging high output/high output combination should each firm have followed its ‘dominant strategy’, we might regard such a departure as cheating on an agreement. By unexpectedly switching to high output, either firm could benefit by raising daily profit (from £3,000 to £4,000), though the loss of profit (from £3,000 to £2,000) by the other firm might provoke an eventual retaliation in some future time period, resulting in the mutually damaging high output/ high output combination.
■ Tit-for -tat strategy. Whether or not any ‘cheating’ is likely to benefit a firm will depend on a number of factors, not least the rapidity with which any rival responds to a breach of the agreement: the more rapid the response of the rival, the smaller any net benefits from cheating will be. Suppose, in our example, it takes the other firm five days to respond with higher output: then on each of these days the cheating firm gains a first-mover advantage (see p. 116) of an extra £1,000 in profit from breaching the agreement as compared with upholding the agreement. If the response of the rival were to be more rapid, say, in three days, then only £3,000 rather than £5,000 benefit would accrue as a first-mover advantage. Of course, once the rival has responded, both firms are damaged in Table 6.4 compared with the pre-cheating situation, losing £1,500 profit per day from the high output/high output combination. This may, of course, induce both firms to restore the initial agreement.
If it becomes known that rivals are likely to respond rapidly to any cheating on agreements (or even departures from Nash-type equilibriums) by adopting tit-for-tat strategies, then this may itself deter attempts by either firm to cheat. Provided that each firm believes the rival is sufficiently well informed to be aware of any change in its strategy, it will anticipate a tit-for-tat response that will ensure that any benefits from cheating are of shorter duration. When factored into the decision-making process, the anticipation of a lower profit stream may deter any attempt by either firm to cheat.
Sequential games
In the games considered so far, each firm has been able to make decisions at the same time (i.e. simultaneously). However, in a sequential game the moves and counter-moves take place in a defined order: one firm makes a move and only then does the rival decide how to react to that move. Table 6.5 is a payoff matrix showing net gains as profit per period for each of two firms. The individual payoffs depend on the price (low or high) selected by one firm and the price response of the rival, in this non-zero sum game.
The dominant strategy for both Firm A and Firm B is to set a low price (£3,000 profit), but if they both follow this strategy the outcome is mutually damaging (£1,000 profit each). You should be able to see that a maxi-min decision rule followed by each firm would lead to a low price/low price outcome in which the expectations of each firm are fulfilled given that they have adopted this decision rule.
Table 6.5 Payoff matrix (profit per period) 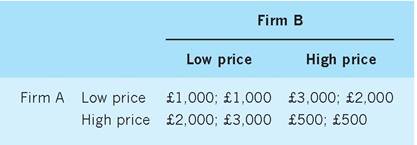
First-mover advantages
If decisions can only be taken in sequence, an important issue is whether the firm making the first move can secure any advantage!
■ Suppose Firm A is in a position to move first. It can choose ‘low price’, forcing Firm B to choose between ‘low price’ (£1,000) and ‘high price’ (£2,000). Firm A might now anticipate that Firm B will attempt to maximize its own return given the constrained situation (via A’s First move) in which B finds itself. In this case Firm B selects ‘high price’, and Firm A receives £3,000 profit per period. The first move by A has given a net profit advantage to A of £2,000 (£3,000-£1,000) as compared to the previous low price/low price outcome.
■ Suppose Firm B is in a position to move first. It can now choose ‘low price’ in the expectation that Firm A will respond with ‘high price’ (£2,000 > £1,000) as Firm A now seeks to maximize its own return given the constrained situation (via B’s first move) in which it finds itself. In this case, Firm B receives a payoff of £3,000 profit per period and a net profit advantage of £2,000 via the first move.
Clearly this game does contain first-mover advantages, which lie in first anticipating the likely responses of the rival and then channelling those responses in a particular direction as a result of making the first move.
Here we have used game theory in a situation in which the firms did not collude. Game theory can also show (in games which are not zero sum) that collusion between firms may sometimes improve the position of all. It is to such collusive behaviour that we now turn.
Collusive oligopoly
When oligopoly is non-collusive, the firm uses guesswork and calculation to handle the uncertainty of its rivals’ reactions. Another way of handling that uncertainty in markets which are interdependent is by some form of central co-ordination; in other words, collusion. At least two features of collusive oligopoly are worth emphasizing: first, the objectives that are sought through collusion; and second, the methods that are used to promote collusion - these may be formal, as in a cartel, or informal, via tacit agreement.
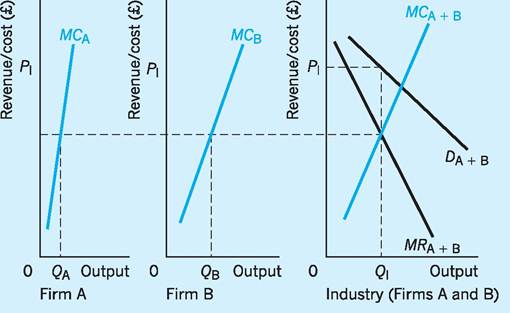
Fig. 6.2 Joint profit maximization in duopoly.
Objectives of collusion
Joint profit maximization
The firms may seek to coordinate their price, output and other policies to achieve maximum profits for the industry as a whole. In the extreme case the firms may act together as a monopoly, aggregating their marginal costs and equating these with marginal revenue for the whole market. If achieved, the result would be to maximize joint profits, with a unique industry price and output (PiQi), as in Fig. 6.2.
A major problem is, of course, how to achieve the close coordination required. We consider this further below, but we might note from Fig. 6.2 that coordination is required both to establish the profitmaximizing solution for the industry PiQi, and to enforce it once established. For instance, some agreement must be reached on sharing the output Qi between the colluding firms. One solution is to equate marginal revenue for whole output with marginal cost in each separate market,5 with Firm A producing Qa and Firm B producing Qb. Whatever the agreement, it must remain in force - since if any firm produces above its quota, this will raise industry output, depress price and move the industry away from the joint profit-maximizing solution.
Deterrence of new entrants - limit-pricing
Firms may seek to coordinate policies, to maximize not so much short-run profit but rather some longer- run notion of profit (see Chapter 3). A major threat to long-run profit is the potential entrance of new firms into the industry. Economists such as Andrews and Bain have therefore suggested that oligopolistic firms may collude with the objectives of setting price below the level which maximizes joint profits, in order to deter new entrants. The ‘limit price’ can be defined as the highest price which the established firms believe they can charge without inducing entry. its precise value will depend upon the nature and extent of the ‘barriers to entry’ for any particular industry. The greater the barriers to entry, the higher the ‘limit price’ will be.
Substantial economies of scale are a ‘barrier to entry’, in that a new firm will usually be smaller than established firms, and will therefore be at a cost disadvantage. Product differentiation itself, reinforced by extensive advertising, is also a barrier - since product loyalty, once captured, is difficult and expensive for new entrants to dislodge. Other barriers might include legally enforced patents to new technologies in the hands of established firms, and even inelastic market demands. This latter is a barrier in that the less elastic the market demand for the product, the greater will be the price fall from any extra supply contributed by new entrants.
The principle of ‘limit-pricing’ can be illustrated from Fig. 6.3. Let us make the analysis easier by supposing that each established firm has an identical average cost (AC) curve, and sells an identical output, Qf, at the joint profit-maximizing price Pi set for the industry. Suppose a new firm, with an identical cost
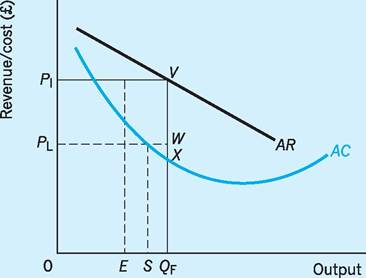
Fig. 6.3 Limit-pricing as a barrier to entry.
profile, is considering entering the industry, and is capable of selling E units in the first instance. Despite the initial cost disadvantage the new firm believes it can survive. One way of preventing the survival of the new firm, perhaps even deterring its entry, would be for the colluding established firms to reduce the industry price to Pl. Although this would reduce their own excess profits in the short run (by VW per unit) the new entrant would make a loss selling E at price Pl, since price would be less than average cost at that output. It would have needed to produce as much as output S immediately at the price Pl, even to have just covered its average costs.
The greater the barriers to the entry of new firms, the higher the ‘limit price’, Pl, can be, i.e. the closer Pl can be to Pi. The most favourable situation for established firms would be if barriers were so great that Pl were at, or above, Pi. In other words, established firms could set the joint profit-maximizing price without inducing entry.
An example of the occurrence of high barriers to entry and relatively high limit prices could be seen in the French market for natural spring water during the early 1990s. In 1992 the French market for such bottled water was dominated by three companies, Nestle, Perrier and BSN, and the barriers to entry into the industry were high. For example, the transport costs of bringing non-French water to the market were substantial and persuading French retailers to stock new brands was difficult. Advertising costs were also heavy, helping create strong brand loyalties in France for the products of the three companies. Finally, the fact that the companies held 82% of the market share by volume constituted an additional problem for prospective new entrants (EC 1994). As a result, these companies were able to increase their prices substantially during the period, thus keeping their limit prices high and maximizing their joint profits.
Occasionally a limit-pricing policy is explicitly adopted, as in the early 1960s when the three major petrol wholesalers, Shell/BP, Esso and Regent, were threatened with new entrants. In 1963 Shell announced a price reduction ‘to make the UK market less attractive to newcomers and potential newcomers’. Again, in 1973 the Monopolies and Mergers Commission (MMC) found evidence of limit-pricing by Kellogg, concluding that ‘when fixing its prices, therefore, Kellogg has as an objective the preservation of its share of the market against potential competitors’.
An obvious constraint to limit-pricing is that prices cannot be set below X in Fig. 6.3, the level at which the established firms begin to make excess profits (normal profit included in average cost), at least not for any length of time. The established firms may therefore resort to non-price competition to reinforce barriers against new entrants. For instance, the petrol companies sought extensive ‘solus’ agreements, giving discounts to retailers dealing exclusively with them, and sought to buy up retail outlets directly. In the detergent industry, Unilever, by introducing new brands, have increased product differentiation and raised barriers to entry. As much as 58% of their turnover comes from new brands introduced in the past 20 years. Extensive advertising (as shown by Table 6.2) is yet another way of increasing barriers to entry into a market or industry. Advertising can be used to increase brand loyalty, thus making it difficult for new firms with a new product to enter a market. Increased advertising can be used by firms already in the industry not only to keep other firms out, but also to drive out existing firms which have newly entered the industry.
To investigate this latter proposition, a study was undertaken into the behaviour of 42 companies operating in various consumer goods markets, such as electric shavers, deodorants, washing-up liquids and kettles, over the period 1975 to 1981. The study investigated the advertising strategy of companies already in these oligopolistic markets after new firms with new products had managed to enter those markets (Cubbin and Domberger 1988). The results of the study showed that increased advertising was used as a weapon in an attempt to drive out new entrants in 38% of markets studied, and that the response of the firms already in the market to the new entrants depended on the structure of the oligopoly and the nature of the market. For example, in a tightly competitive oligopoly situation, where a dominant firm controlled more than 30% of the market, it was more likely that the new entrant would be exposed to increased advertising competition than in a looser oligopoly where there was no clear dominance by one firm. Similarly, increased advertising competition was more likely to face new entrants in static markets, i.e. those in which demand is not growing. This is partly because growing markets tend to be dominated by new consumers with less attachment to the products of existing firms. Advertising in this situation is therefore a less certain weapon for driving out a new entrant, as compared to a market in which demand is static.
We now turn briefly to the methods which firms have actually used to promote collusion in oligopolistic markets.
Methods of collusion
Formal collusion - cartels
Formal collusion often takes the form of a cartel - in other words, the establishment of some central body with responsibility for setting the industry price and output which most nearly meets some agreed objective. Usually it also has the responsibility for sharing that total output between the members. Cartels are against the law in most countries, including the UK. However, in the UK the Cement Makers’ Federation was an exception. Up to 1987 it still held monthly meetings in which deliveries, prices and market shares were discussed. The three main companies sharing the market were Blue Circle (60%), Rio Tinto Zinc (22%) and Rugby Portland (18%), with their common price calculated on a formula which averaged the costs of different producers. The Restrictive Practices Court permitted the cartel to continue on the basis that a common price agreement enables cement capacity to be controlled in an orderly way. Nevertheless, increased concentration of the cement industry in the last few years raised the possibility of intervention by the MMC (now the Competition Commission) and this, together with international competition from cheap European imports (especially from Greece), caused the cartel to be abandoned in 1987. However, cartel-type collusion still persists in the UK cement industry. In 2000, the three largest UK producers of ordinary Portland cement (OPC), i.e. Blue Circle plc, Castle Cement Ltd and the Rugby Group, refused to supply bulk OPC to customers such as ready-mix concrete producers who had intended to resell it in bags to builders’ merchants. This was because they themselves sold OPC in bag form to customers. In September 2000 the Office of Fair Trading (OFT) found that such a policy was anti-competitive and told the companies to desist from such supply-fixing cartel behaviour.
An example of a price-fixing cartel operating in the UK was discovered and prohibited by the OFT in 1999. Vitafoam Ltd of Rochdale, Carpenter plc of Glossop, and Recticel Ltd of Alfreton had met to agree on price rises of 8% for foam rubber and 4% for reconstituted foam which they supplied to the upholstery business. Cartel members agreed that the price rises announced by Vitafoam, the market leader, would be matched immediately by similar announcements from Carpenter and Recticel. Another example of a price-fixing cartel operating in the UK was brought to light in April 2005 when 10 roofing contractors in north-east England were found guilty of fixing prices, sharing markets and paying off their potential competitors. The contractors were found to have colluded together and allocated the contract to one of them before they tendered their price for the job to customers. For example, in one instance the company Rock Asphalte Limited was found to have been allocated the contract as a result of collusion between the roofing contractors which then ‘compensated’ others in the group for placing a higher tender price than itself. The money to pay for such ‘compensation’ came by charging the customer an excessive amount for the work done. In February 2006 the OFT fined the roofing contractors a total of £1.6m for their part in the collusive tendering. Similarly, in 2009 the OFT imposed fines of £39.3m on six recruitment agencies known as the ‘Construction Recruitment Forum’. The companies concerned were Warwick Associates, Beresford Blake Thomas, CDI AndersElite, Eden Brown, Fusion People, Hays Specialist Recruitment, Henry Recruitment and Hill McGlynn Associates, all of whom operated in the UK employment recruitment business. The six companies had met between 2004 and 2006 to fix target fee rates which they would charge construction companies for sending them potential recruits. This
practice of price-fixing was seen to be restricting or distorting competition and a fine was imposed.
Various cartels operate internationally. The most famous is OPEC, in which many but not all (the UK is not a member) oil-exporting countries meet regularly to agree on prices and set production quotas. Whilst OPEC worked successfully in the mid-1970s in raising oil prices, in the worldwide economic slump of the early 1980s coordination proved increasingly difficult. As demand for oil fell, exporters were faced with the necessity of cutting production quotas to maintain prices; and some, such as Iran and Nigeria with major internal economic problems, were unwilling to do this, preferring to cut prices and seek higher market share. Of course, the Iraqi pressure on OPEC countries to curtail production and raise prices, and the subsequent Kuwait invasion, contributed to higher oil prices in the early 1990s. However, by 1992/93, the continued fall in demand for oil under worldwide recessionary conditions, allied to some additional oil supplies (e.g. from the Gulf States), revived the disagreements between those cartel members in favour of price cuts and those in favour of tighter quotas. In more recent times, OPEC’s ability to enforce the cartel led to a cut in the supply of oil available to industrial countries in March 1999. This resulted in a trebling of the price of a barrel of crude oil from $10 to $34 by March 2000.
The International Air Transport Association (IATA) is the cartel of international airlines, and has sought to set prices for each route. During the 1970s it was seriously weakened by price-cutting competition from non-member airlines, such as Laker Airways. It was further weakened by worldwide recession in the late 1980s and early 1990s, with lower incomes causing demand for air travel, with its high-income elasticity, to fall dramatically. To fill seats, the member airlines began to compete amongst themselves in terms of price, often via a complex system of discounts. The experiences of OPEC and IATA suggest that cartels are vulnerable both to price-cutting amongst members when demand for the product declines, and to competition from non-members.
Another example of an international cartel was brought to light by investigations during 1990 into the activity of the International Telegraph and Telephone Consultative Committee (CCITT), a Geneva-based ‘club’ consisting of the main international telephone companies of the major industrial countries (Financial Times 1990). Major international telephone companies such as AT&T (USA), British Telecom (UK), Deutsche Bundespost (Germany), France Telecom (France), Telecom Canada (Canada) and KDD (Japan) belong to the group. The CCITT had a book of ‘recommendations’ for its member companies which included two important features. First, it suggested a complicated method of sharing the revenues received from international telephone calls. When international phone calls are made from the UK to Japan, for example, BT receives the money for the call but it has to pay KDD in Japan for delivering the call to its final destination in that country. The particular method used to calculate the distribution of the revenue received for the call between the various international telephone companies tended to penalize any company that attempted to cut its telephone prices. This in turn made it difficult for both existing and new companies to decrease prices because their profits would also fall. Second, it suggested that members of the group should not lease too much of their international telephone circuits to other private companies, since this could increase potential competition.
The effect of the first ‘rule’ was to provide high profit margins for telephone companies because prices were kept artificially high by the peculiar revenue-sharing scheme. Meanwhile, new technological advances had decreased the real costs per minute of using a transatlantic cable from $2.53 in 1956 to $0.04 in 1988. While costs had fallen drastically, the price charged for a peak call from the US to the UK and Italy remained at $2 and $4 per minute respectively! As a result, profit margins on international calls (i.e. profits divided by revenue) of some of the top earners were as follows: Japan 75%, Canada 68%, USA 63%, Britain 58%, West Germany 48%, and France 43%. British Telecom earned a profit of between £600m and £800m on its international business during the 1988/89 financial year, depending on the accounting definitions used. The second ‘rule’ made it difficult for new companies to enter this market because most of the international cables were built by members of the CCITT and new operators had to get permission from these companies in order to lease cable space from them. If they were not allowed more space on international cables, then new companies had to use satellite links which were more expensive and of lower quality than cable links.
Tacit collusion - price leadership
Although cartels are illegal in most countries, various forms of tacit collusion undoubtedly occur. In 1776, Adam Smith wrote in his Wealth of Nations that entrepreneurs rarely meet together without conspiring to raise prices at the expense of the consumer. Today the most usual method of tacit collusion is price leadership, where one firm sets a price which the others follow.
1. Dominant-firm leadership. Frequently the price leader is the dominant firm. In the late 1960s Brooke Bond controlled 43% of the market for tea, well ahead of the second largest firm Typhoo with only 18% of the market. Brooke Bond’s price rises were soon matched by those of other firms, bringing the industry to the attention of the Prices and Incomes Board in 1970. Sealink, with 34% of the cross-channel ferry market, seems to have been the price leader in ferry travel to the Continent in the 1980s. In the car industry, Ford has frequently acted as the dominant market leader by being first with its price increases. In 1990, companies that bought fleet cars from Ford, Rover, Vauxhall and Peugeot Talbot, accused the big car manufacturers of operating a price cartel led by Ford. By initiating two separate price rises (amounting to a total of 8.5% by the middle of 1990), Ford was seen as the dominant leader of a ‘cartel’ by the fleet car buyers. We have already noted that Vitafoam acted as a dominant price leader for reconstituted foam in the upholstery business in the UK in 1999. Worries about dominant price leadership in banking also emerged in 2005 when the big four Irish banks, Bank of Ireland, First Trust Bank, National Bank and the Ulster Bank, were accused of tacit collusion. In this case, the other three banks appeared to follow the lead of the National Bank when changing the prices of their products and services (OFT 2005).
2. Barometric-firm leadership. In some cases the price leader is a small firm, recognized by others to have a close knowledge of prevailing market conditions. The firm acts as a ‘barometer’ to others of changing market conditions, and its prices are closely followed. In the mid-1970s Williams and Glyn’s, a relatively small commercial bank, took the lead in reducing bank charges in response to rising interest rates. Maunder also found this sort of price leadership in the glass bottle and sanitary ware markets of the 1960s and early 1970s (Maunder 1972). Since the mid-1970s there have been signs that the ‘minor’ petrol wholesalers have had an increasing influence on petrol prices (see Chapter 9). Again the barometric form of price leadership can be seen in the North American newsprint industry where some 30 firms produce most of the newsprint. In a major study, Booth et al. (1991) found a tendency for a leader to emerge which then acts as an ‘anchor’ for the calculations of other firms in the industry and as a ‘trigger’ for any price adjustment within the group when cost or demand conditions change.
3. Collusive-price leadership. This is a more complicated form of price leadership; essentially it is an informal cartel in which prices change almost simultaneously. The parallel pricing which occurred in the wholesale petrol market (noted in Chapter 9) until the mid-1970s suggested this sort of tacit group collusion. In practice it is often difficult to distinguish collusive-price leadership from types in which firms follow price leaders very quickly. The French market for spring water, referred to earlier in the chapter, is one where both the setting of parallel prices and price leadership were present. Between 1987 and 1992 the prices of bottled water sold by Nestle, Perrier and BSN rose in almost a simultaneous or parallel way, with Perrier being the price leader. Although the three companies did not have a collusive price arrangement, their behaviour was reminiscent of a close ‘tacit’ form of oligopolistic interdependence. This type of tacit collusion was also thought to be present in the case of the Irish banks noted previously. For example, it was known that bank prices were not directly cost derived and so the upward movement of prices was not necessarily due to differences in costs. Between 1999 and 2004 there was some evidence that price changes tended to follow, in a parallel fashion, the lead given by the National Bank either in the same quarter or in succeeding quarters (Competition Commission 2007).
I Conclusion
That oligopoly has become a progressively more important form of market structure in the UK is clear from the data, particularly from concentration ratios. Interdependence is a key feature of such markets, which makes the outcome of any strategy by a firm uncertain, depending to a large extent on how the rivals react. Price competition may be a particularly hazardous strategy, perhaps leading to a ‘price war’. In any case, to the extent that kinked-demand theory is valid, the profit-maximizing price may not change even for wide variations in cost. For both these reasons there may be extensive periods of price stability. Even so, there may still be close competition between firms for market share, though this will be mainly of the non-price variety - advertising, packaging, new brands, etc. Non-price competition, by increasing product differentiation, real or imagined, may benefit firms not only by raising market share, but by providing greater future control over price - extra brand loyalty making demand curves less price-elastic.
The uncertainty of rival reactions, whether price or non-price, can be mitigated by guesswork, based on past experience (reaction curves), or by trying to evaluate the rivals’ optimal counter-strategy (game theory). Collusion between firms may be a still more secure way of reducing uncertainty and avoiding mutual damage. This could be arranged formally, as in cartels, or informally by some form of tacit collusion (information agreements, price leadership, etc.). Although we may be no nearer a general model of oligopoly behaviour, we have made some progress in predicting how firms react under particular circumstances at particular times.
Key points
■ Concentration ratios for both product and industry groups have risen over time, implying a more oligopolistic market structure.
■ ‘Recognized interdependence between the few’ is a key feature of oligopoly markets.
■ Where firms develop their own strategies independently we speak of ‘non-collusive behaviour’.
■ Even in this case firms will seek to anticipate how their rivals might react to any strategy they might adopt.
■ Past experience might be a guide to rival reactions, as in the ‘kinked demand’ model. Firms learn that rivals match price cuts but not price rises. The model predicts price stability.
■ Even where there is little price competition, there may be extensive non-price competition.
■ ‘Game’ simulations may be used to predict the outcomes of different combinations of action/reaction. Games may or may not have stable equilibria depending on the strategies each firm adopts.
■ To avoid uncertainty, collusion may occur, whether formal (cartels) or informal (tacit).
■ Informal collusion may include various types of price leadership models as well as agreements of various kinds.
■ To be successful firms must abide by the rules of collusive agreements, e.g. producing no more than their allocated quotas.
Now try the self-check questions for this chapter on the Companion Website. You will also find useful links to relevant websites.
Notes
1 Cross-elasticity of demand is defined as the percentage change in the quantity demanded of X, divided by the percentage change in the price of Y. If X and Y are close substitutes, then a small fall in the price of Y will lead to a substantial decrease in demand for X. This gives a high positive value for the quotient.
2 See, for instance, Jump (1982), which suggested that brand loyalty permitted prices to be 9% higher for branded processed foods in the US than for supermarket own-brand equivalents.
3 This is because each demand curve, dd' and DD' respectively, will have its own separate marginal revenue curve, bisecting the horizontal between the vertical axis and the demand curve in question.
4 The maxi-min approach is a rather conservative strategy in that it assumes that the rival reacts to your strategy in the worst possible way for you.
5 A distribution of the joint profit-maximizing output such that aggregate MR = MC in each separate market is often called the ‘ideal’ distribution. From Fig. 6.2 we can see that there is no other distribution which will raise total profits for the industry. For instance, one extra unit produced by Firm B will add more to cost than is saved by one fewer unit produced by Firm A (i.e. MCb > MCa). Whether the firms will acquiesce in such a share-out is quite another matter.
References and further reading
Bhaskar, V., Machin, S. and Reid, G. (1991) Testing a model of the kinked demand curve, Journal of Industrial Economics, 39(3): 241-54. Booth, D. I., Kanetkar, V., Vertinsky, I. and Whistler, D. (1991) An empirical model of capacity expansion and pricing in an oligopoly with barometric price leadership: a case study of the newsprint industry of North America, Journal of Industrial Economics, 39(3): 255-76. Competition Commission (2007) Cross-border Personal Banking in Ireland, 18 May, London. Competition Commission (2009) Personal Current Account Banking Services in Northern Ireland; Market Investigation, 15 May, London. Coyne, K. and Horn, J. (2009) Predicting your competitor’s reaction, Harvard Business Review, April, 1-8.
Cubbin, J. and Domberger, S. (1988) Advertising and post-entry oligopoly behaviour, Journal of Industrial Economics, 37(December): 123-40. Davies, S. and Lyons, D. (1996) Industrial Organisation in the EU, Oxford, Clarendon Press.
Dixon, H. (1990) Reconnecting charges with costs, Financial Times 3 April.
Domberger, S. (1980) Mergers, market structure and the rate of price adjustment, in Cowling, K. et al. (eds), Mergers and Economic Performance, Cambridge, Cambridge University Press, Ch. 13. Economic Trends (2005) Input-Output: Concentration Ratios for Businesses by Industry in 2003, 624(November): 52-62.
EC (1994) European Economy, No. 57, Part C, Brussels, European Commission.
Ferreira, N., Kar, J. and Trigeorgis, L. (2009) Option games, Harvard Business Review, March, 101-107.
Financial Times (1990) Reconnecting charges with costs, 3 April.
Jump, N. (1982) Corporate strategy in mature markets, Barclays Bank Review, 57(4): 84-9. Marketing (2010a) Top 100 Advertisers, 15 March. Marketing (2010b) Top 100 Advertisers, 24 March. Maunder, P. (1972) Price leadership: an appraisal of its character in some British industries, Business Economist, 4(Autumn): 132-40
Mintel International Group Ltd (2010), Mintel Reports (various).
OFT (2005) The OFT’s Reasons for Making a Reference to the Competition Commission, May (OFT 787), London, Office of Fair Trading. Wagner, L. (ed.) (1981) Readings in Applied Micro-economics (2nd edn), Oxford, Oxford University Press.