The multinational corporation
This chapter focuses on the ‘globalization’ of business and the growing importance of the multinational corporation. Aided by a host of ‘enabling technologies’, notably inexpensive air travel and microchip-based communications systems, the world’s largest companies have become truly global in scope.
From Beijing to London to Tierra del Fuego, today’s teenagers universally drink Coca-Cola, eat McDonald’s hamburgers and wear Levi jeans. Their parents drive cars produced by a handful of global auto makers, filling them up with petrol refined by an even smaller number of worldwide oil companies. This chapter reviews the changing pattern of production by multinational corporations, going on to consider the reasons for the increasing globalization of business. It then considers the implications of this phenomenon for the UK and other host economies.The context in which the multinational corporation operates is further explored in other chapters, including Chapter 24 (Globalization), Chapter 27 (EU) and Chapter 28 (BRIC economies), as well as Chapter 30 (Managing the global economy).
I What is a multinational corporation?
The terms ‘multinational’, ‘transnational’ and ‘international’ corporation (or enterprise) are often used interchangeably. A multinational may be defined as a company which owns or controls production or service facilities in more than one country. In other words, a multinational is not simply a company which trades internationally by exporting its products (or by licensing overseas producers); it actually owns (via a wholly or partly owned subsidiary) or controls (via a branch plant, joint venture or minority shareholding) productive facilities in countries outside its home country. Such overseas productive facilities may be acquired by taking over existing locally owned capacity (e.g. Coca-Cola’s acquisition of parts of Cadbury Schweppes in the UK) or by investing directly in new (or ‘greenfield site’) plant and equipment (e.g.
Nissan’s plant in Washington or Toyota’s car factory in Derby).From a statistical point of view, there are two main methods of ranking the world’s top multinationals: first, according to the amount of foreign assets they control, and second, in terms of a ‘transnationality index’. Table 7.1 ranks the top 10 multinationals according to the value of foreign assets they control. We can see that two of the top 10 companies are from the US, three from the UK, two from France and one each from Japan, Germany and Luxembourg. They are primarily based in the telecommunications, petroleum, energy and motor vehicle sectors. However, Table 7.1 also provides each company’s transnationality index and its transnationality ranking. The transnationality index takes a more comprehensive view of a company’s global activity and is calculated as the average of the following ratios: foreign assets/total assets; foreign sales/total sales; and foreign employment/total employment. For example, we can see that the largest multinational company is General Electric in terms of the foreign assets it owns. However, its transnationality index of 52% means that it is ranked only 75th in terms of this criterion. The reason for this is that even though it has large investments overseas in absolute value, in percentage terms most of its assets, sales and employment are still located in the US. This is in contrast with Exxon Corporation where over 68% of its overall activity is based abroad.
If we wanted to find the companies which operate mostly outside their home country, then we would have to look at the top 10 multinationals in terms of the transnationality index. These are shown in Table 7.2 and here we see the dominance of European Union (EU) companies in sectors such as food/bever- ages, chemicals, telecommunications and extractive industries. The companies with the highest transnationality index are often from the smaller countries,
Table 7.1 World's top 10 non-financial multinationals ranked by foreign assets, 2008.
Rankings
| Foreign assets | Transnationality index | Company | Country | Industry | Transnationality index (%) |
| 1 | 75 | General Electric | US | Electric/electronics | 52 |
| 2 | 32 | Royal/Dutch Shell | UK | Petroleum | 73 |
| 3 | 6 | Vodafone | UK | Telecommunications | 89 |
| 4 | 20 | British Petroleum | UK | Petroleum | 81 |
| 5 | 74 | Toyota Motor | Japan | Motor vehicles | 53 |
| 6 | 42 | ExxonMobil | US | Petroleum | 68 |
| 7 | 27 | Total SA | France | Petroleum | 75 |
| 8 | 67 | E.ON AG | Germany | Electri city/gas/water | 56 |
| 9 | 90 | Electricite De France | France | Electri city/gas/water | 42 |
| 10 | 10 | ArcelorMittal | Luxembourg | Metals/metal products | 87 |
Source: Modified from UNCTAD (2010) World Investment Report 2010, Annex, Table 26.
Table 7.2 World's top 10 non-financial multinationals ranked by transnationality index, 2008.
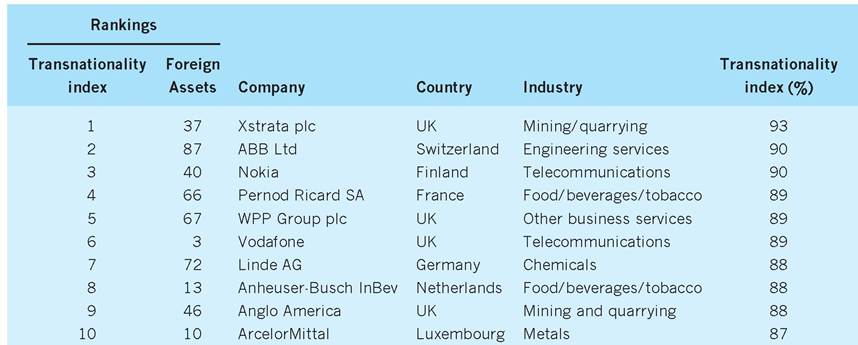
Source: Modified from UNCTAD (2010) World Investment Report2010, Annex, Table 26.
as a more restricted domestic market induces them to operate abroad if they are to maximize their growth in terms of revenue or profits.
Technical definitions of multinationals, however, fail to convey the true scope and diversity of global business, which covers everything from the thousands of medium-sized firms which have overseas operations to the truly gigantic multinationals like IBM, General Motors and Ford. Some multinationals are vertically integrated, with different stages of the same productive process taking place in different countries (e.g. British Petroleum). Others are horizontally integrated, performing the same basic production operations in each of the countries in which they operate (e.g. Marks & Spencer). Many multinationals are household names, marketing global brands (e.g. Rothmans International, IBM, British Airways). Others are holding companies for a portfolio of international companies (e.g. Diageo) or specialize in capital goods that have little name-recognition in the high street (e.g. BTR).
How important are the multinationals?
One way of assessing the importance of multinationals in an economy can be gauged by a survey of the relevance of US multinationals in their own economy. For example, US multinationals in 2010 accounted for 23% of US private sector GDP and 41% of US gains in productivity since 1990. In addition, the higher than normal productivity growth which US multinationals show over other domestic US companies appears to have contributed 75% of US real GDP gains since 2000. Finally, US multinational companies account for nearly half of the nation’s exports and a third of the nation’s imports (McKinsey Global Institute 2010). Because of these ownership-specific advantages (see p.
137), US companies are able through foreign direct investment (FDI) to transfer their output and productivity benefits to foreign countries such as the UK.In 2009 the United Nations Division on Transnational Corporations and Investment estimated that there were 82,053 multinationals at that time, collectively controlling a total of 807,363 foreign affiliates. Table 7.3 provides an overview of multinational activity. It shows that in 2009 the sales of multinationals’ foreign affiliates exceeded global exports and amounted to over 50% of world Gross Domestic Product (GDP). In terms of importance in research and development (R&D), the aggregate spending of the world’s eight largest multinationals on R&D in 2009 was larger than the R&D investments of all individual countries, except for the US and Japan (OECD 2010). Ranked by either turnover or GDP, half of the world’s largest economic ‘units’ are multinationals,
Table 7.3 Multinational activity in a global context.
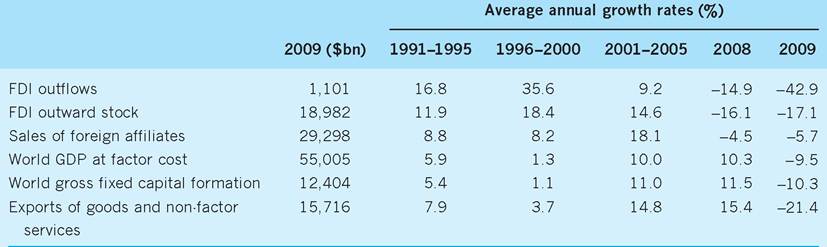
Source: Modified from UNCTAD (2010) World Investment Report 2010, Table 1.5.
rather than countries. Only 15 nation states have a GDP which exceeds the turnover of Exxon, Toyota or General Motors.
Historically, the bulk of multinational activity was concentrated in the developed world. Indeed, as recently as the mid-1980s, half of all multinational production took place in only five countries - the US, Canada, the UK, Germany and the Netherlands. This pattern is now changing rapidly. The rapid industrialization and economic growth in the newly industrializing nations of the world has led to a sharp increase in multinational investment in Asia and (to a lesser extent) Latin America. Some of these countries, notably the ‘four tigers’ (Taiwan, South Korea, Hong Kong and Singapore), now have per capita GDP levels which exceed those of most European nations and their indigenous companies are now beginning to establish production facilities in the ‘old world’.
The old bipolar world (dominated by North America and Europe) is now giving way to a tripolar economy, comprising the ‘triad’ of North America, the EU and East and South-East Asia. These three regions account for approximately 75% of the world’s exports and 60% of manufacturing output and the majority of multinational activity, although such activity in the Middle East and Africa is also growing.It is estimated that in the next 10 years, world GDP will nearly double from its present level of $55,000bn to $90,000bn, with the share of the developing world rising from one-third to one-half over the same period. Table 7.4 shows the changing pattern of FDI by which domestic companies acquire control over productive facilities overseas. After the problems of the early 1990s, inflows of foreign investment rose strongly in the developed countries before experiencing a setback in the early years of the new millennium and again after the financial crisis of 2007/08. The trend in the developing countries was similar but at relatively lower absolute values.
Table 7.4 also reflects the reintegration of the former centrally planned economies of central and eastern Europe into the world economy. Although the total volume of inward foreign investment is still relatively low (central and eastern Europe attracted only 5.7% of total global inflows in the period 2007-09), inflows have increased strongly since the transition process began in 1989. In this region, 60% of the inflows are associated with the privatization of former state-owned enterprises (compared with 8% in the other developing countries). Unsurprisingly, countries that have pushed ahead with market reform, and privatization in particular, have attracted the bulk of the foreign investment, both by creating international confidence in their future economic and political stability and by providing the opportunities for foreign companies to buy local production and distribution facilities. Poland and the Czech Republic, for example, have been highly successful in attracting multinationals such as Ford, Volkswagen and Philip Morris. Countries which have resisted or delayed market reform, notably many of the states of the former Soviet Union, have, in contrast, found foreign companies less willing to risk large-scale inward investment.
Table 7.4 Inflows of foreign direct investment ($bn).
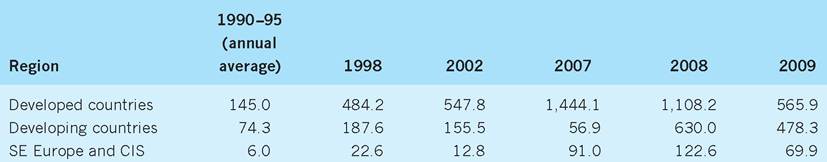
Note: CIS - Commonwealth of Independent States (formerly Soviet states).
Sources: Modified from UNCTAD (2010) World Investment Report 2010, Annex Table 1; UNCTAD (2005) World Investment Report 2005, Annex Table B2.
I Multinationals and the UK economy
Multinationals play a central role in the UK economy. Table 7.5 gives one indication of their importance. It lists the top 25 UK corporations ranked by revenue, most of them being well-known multinational companies. In the non-financial sector, Royal Dutch/Shell and BP boast production and distribution facilities in over 100 countries and have a transnationality index of 73% and 81%, respectively. Similarly, companies such as Vodafone, the mobile communications giant, GlaxoSmithKline in pharmaceuticals and Tesco, the retailer of food and other products, are major players on the international scene. It should also be remembered that the UK has some large companies in the financial sector, such as the Lloyds banking group and Aviva, the insurance company, both of which are in the top 100 global companies in terms of revenue.
The UK still ranks as a major home to multinationals, reflecting its colonial past and the vast assets it has accumulated. Although Table 7.6 suggests that the number of home-based multinationals is smaller than in the other countries represented, the value of their contribution to multinational activity is greater, as can be seen in Table 7.7. Outward foreign investment from Britain has remained high ever since the Second World War, with UK home-based multinationals responsible for over 19% of all FDI outflows from the five major economies over the time period in Table 7.7. Moreover, despite the UK’s increasingly close economic and political ties with other member states of the EU, the bulk of outward foreign direct investment still goes to the US where UK multinationals retain a pre-eminent position in terms of the value of US assets controlled.
As a host country, the UK is also an important destination for inward direct investment by foreign multinationals (see Table 7.6). Of the Financial Times top 500 companies operating in the UK, 313 are foreign-owned, with Germany (87), France (77), Switzerland (28) and the Netherlands (17) being the most important European nations. Just as UK multinationals dominate FDI in the US, however, so US multinationals account for the lion’s share of FDI in the UK; and led by Nissan, Sony, Toyota and Honda, Japanese and Korean multinationals have also increased their stake in the UK economy. By 2010 some 120 major Japanese companies had set up in the UK. Over 30% of all Japanese foreign direct investment in the EU to date has been in the UK.
The UK economy is thus particularly affected by the globalization of business, being simultaneously home of, and host to, a large number of multinationals producing a rapidly growing proportion of its output. Multinational companies (both UK companies and foreign companies in the UK) account for an estimated 30% of GDP in the UK and almost half of all manufacturing employment. Most activity is concentrated in capital-intensive, high technology sectors - computers, automobiles, electronics, pharmaceuticals and chemicals. One-third of UK exports and imports by value are estimated to be intra-firm (within firm) transactions, as multinationals import and export the intermediate products which tie together production processes which are vertically integrated across national frontiers.
Table 7.5 The UK's top 25 companies by revenue.
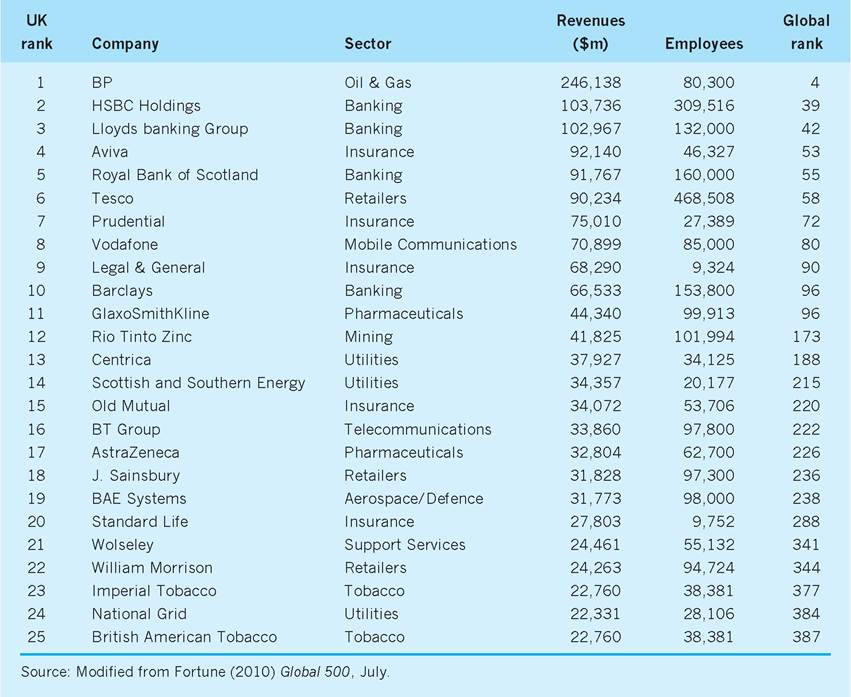
Table 7.6 Home and host to multinationals.
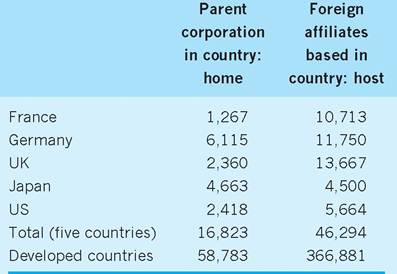
Source: Modified from UNCTAD (2009) World Investment Report2009, Annex, Table A.1.8.
Interestingly, it is not only the transfer of technology from FDI via multinationals which is important, but also the use made of such technological transfer to increase productivity in the UK. For example, US multinationals operating new plants in the UK appear to be more effective in the use of IT than both their domestic UK counterparts and other non-US multinationals operating in the UK. These higher IT productivity benefits also occurred when US multinationals took over UK companies, whereas UK companies taken over by non-US multinationals did not show such benefits. These differences may be due to the ways in which US firms are organized which allow them to use new technologies more efficiently (Bloom et al. 2007). Whatever the cause, it can be seen that FDI by foreign multinationals in the form of technological transfer can bring benefits to the UK.
Table 7.7 Outflows from five main home economies for multinationals ($bn).
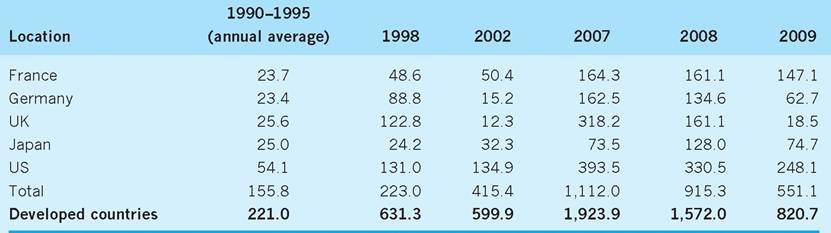
Sources: Modified from UNCTAD (2010) World Investment Report, Annex, Table 1; UNCTAD (2005) World Investment Report 2005, Annex, Table B.1.
Why do companies become multinational?
Multinationals are very heterogeneous in nature. Most large companies are multinational, but there are many medium-sized companies which also have overseas operations. This heterogeneity makes it difficult to generalize about the reasons why firms become multinational. Nevertheless, there is broad agreement amongst economists that the primary motivation for multinational activity is to seek higher or more secure profits in the long term - for example, by strengthening the company’s market position.
Ultimately, any such consideration of the motives for establishing overseas operations must focus on one or other side of the profit and loss account; that is, becoming multinational is driven either by a desire to cut costs or, alternatively, by the prospect of greater revenues. One way of categorizing these two motives is to distinguish between multinationals which are cost-oriented and those which are market- oriented.
■ Cost-oriented multinationals - those which internationalize their operations by vertical integration; e.g. integrating backwards in search of cheaper or more secure inputs into the productive process. Oil companies such as Exxon, Shell and BP were early examples of this approach. In order to secure control of strategic raw materials in oil fields around the world, they established overseas extraction operations in the early years of the twentieth century with the aim of shipping crude oil back to their home markets for refining and sale. More recently, many US and European companies have integrated forwards by establishing assembly facilities in South East Asia, especially China, in order to take account of the relative abundance of cheap, high quality labour (see Table 7.8). Companies such as America’s ITT ship semi-manufactured components to the region, where they are assembled by local labour into finished products which are then re-exported back to the home market. Such home countries are sometimes termed ‘production platforms’, which underscores their role as providers of a low-cost input into a global, vertically integrated production process.
■ Market-oriented multinationals - those whose internationalization is motivated by the promise of new markets and greater sales; i.e. the internationalization process takes the form of horizontal (rather than vertical) integration into new geographic markets, with companies gradually switching from exporting (or licensing) to establishing first a sales outlet and finally full production facilities overseas (see Fig. 7.1).
Figure 7.2 shows the spectacular divergence in economic performance between the world’s major economies which is expected over the next 10 years. It shows that in 1992, in terms of market size, the global economy was dominated by rich industrial countries like the US, Japan, Germany, France, Italy and the UK. However, by the year 2020, China will be the world’s largest market, with India, Indonesia, South
Table 7.8 Hourly compensation costs in manufacturing 2008 ($ per hour).
| Country | Total labour costs ($ per hour) | Total direct pay (% of total) | Other labour costs (e.g. social insurance and labour taxes) % of total |
| India | 0.9 | - | - |
| China | 1.4 | - | - |
| Philippines | 1.7 | 91.4 | 8.6 |
| Mexico | 4.0 | 73.7 | 26.3 |
| Brazil | 8.3 | 67.9 | 32.1 |
| Taiwan | 8.7 | 85.3 | 14.7 |
| Hungary | 9.6 | 73.0 | 27.0 |
| Argentina | 9.9 | 82.6 | 17.4 |
| Poland | 10.1 | 84.5 | 15.5 |
| Czech Republic | 12.2 | 73.4 | 26.6 |
| Portugal | 12.3 | 79.8 | 20.2 |
| Korea | 16.3 | 82.3 | 17.7 |
| Singapore | 18.8 | 86.0 | 14.0 |
| Greece | 19.6 | 72.4 | 27.6 |
| Spain | 27.7 | 74.1 | 25.9 |
| Japan | 27.8 | 82.2 | 17.8 |
| US | 32.3 | 76.8 | 23.2 |
| Italy | 35.8 | 69.6 | 30.4 |
| UK | 35.8 | 79.0 | 21.0 |
| France | 42.9 | 67.6 | 32.4 |
| Ireland | 44.8 | 84.7 | 15.3 |
| Germany | 48.2 | 78.1 | 21.9 |
| Euro Area | 43.3 | 75.1 | 24.9 |
| East Asia (excl. Japan) | 13.3 | 84.8 | 15.2 |
| Source: Modified from US BLS (2010) International Labor Statistics. | |||
Korea, Thailand and Taiwan all moving into the ‘top 10’. Therefore it is increasingly likely that market- oriented companies will be drawn to these areas.
Extending the product life cycle
A more subtle variation on this theme is that firms may internationalize in order to extend the ‘product life cycle’ of their products. The underlying thesis is that products have a finite economic life, going through four stages or phases (see Fig. 7.3). In the introduction phase, the product is slow to win over consumers, who are unfamiliar with the innovation; many products fail at this stage. But for those which are successful, sales gradually build up in the following growth phase, as the product becomes established. At some point, the product reaches maturity - there are few new users to win over and most sales are on a replacement basis; the product becomes standardized and competition becomes cut-throat. Finally, either because a new substitute challenges the product or because consumer tastes simply move on, the product moves into a period of decline, with sales steadily falling. The Sony Walkman provides a useful illustration of this cycle. It was first introduced to a sceptical Japanese market, where it was initially derided as a ‘portable cassette player with no speakers and no facility to record tapes’. Gradually, it became established, stimulating a raft of ‘me-too’
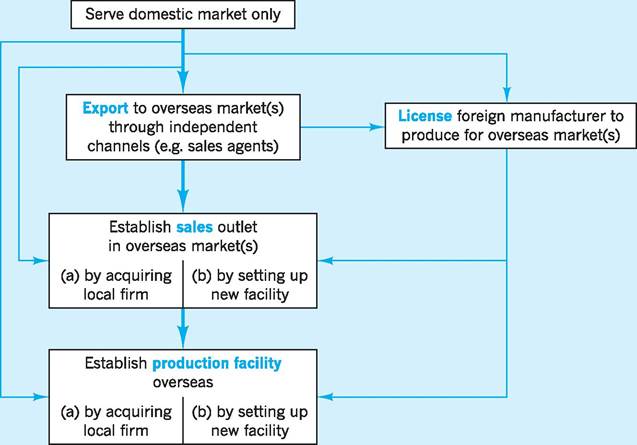
Fig. 7.1 Evolution of a market-oriented multinational.
53" class="lazyload" data-src="/files/uch_group77/uch_pgroup315/uch_uch7347/image/image049.jpg">
Fig. 7.2 Growth of the global economy, 1992-2020. Source: Based on World Bank estimates.
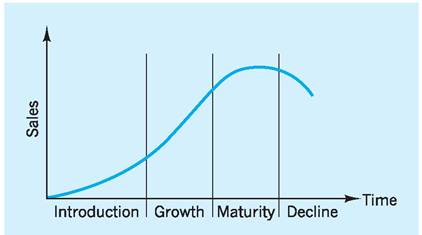
Fig. 7.3 Product life cycle.
copies by other companies until the market became saturated. These products were subsequently superseded by new formats, including portable CD players and minidisc players, which have now given way to the current generation of portable media players.
The link between the product life cycle and internationalization stems from the fact that a product may be at different stages of its life cycle in different geographic markets, giving rise to changing configurations of supply and demand which variously favour local production, and/or exporting, and/or importing from cheaper overseas suppliers.
Consider Fig. 7.4, which illustrates one possible scenario for a US manufacturer. In Phase I (introduction), production is concentrated in the US, with the innovating companies exporting to other countries.
As the US market matures and production techniques become standardized, production starts up in the expanding, lower-cost European market; these new lower-cost producers are able to initially displace imports into Europe from the US (in Phase II) and then increasingly challenge US competitors for a share of developing country markets (in Phase III) and finally the US market itself (in Phase IV). In due course, however, the technology spreads to the developing world, whose producers are gradually able to take on and out-compete the now higher-cost European companies, first in their own markets (Phase IV) and ultimately in the US market as well (Phase V). In this way, the product life-cycle drives production out of the innovating country to lower-cost producers overseas.
Advances in enabling technologies
While cost orientation and market orientation clearly provide important motives for investing and producing overseas, the acceleration in the pace of globalization is also intimately tied up with advances in enabling technologies which have reduced the costs of doing business across national frontiers. These include:
1 improved communications, including cheap air travel, satellite telephone and fax facilities, computers and IT-based communications systems such as the Internet;
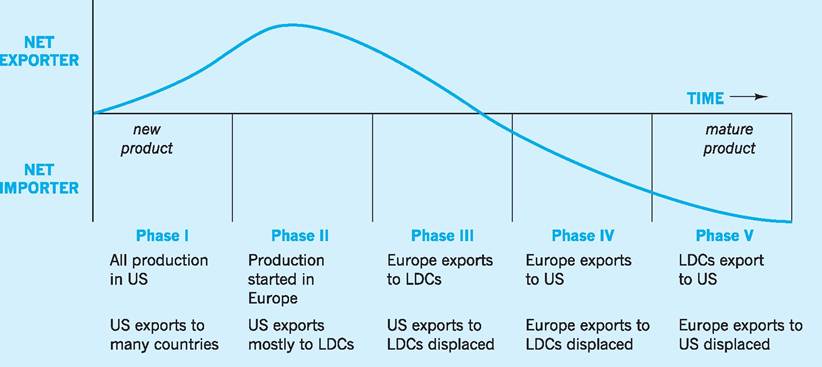
Fig. 7.4 Stages/phases in the product life cycle and the switch from domestic to overseas production.
2 the globalization of consumer markets, through television, video and popular music which make it cheaper for established producers to penetrate new markets in developing countries; and
3 new organizational technologies, e.g. the rise of the divisional corporate structure based on product or geographic divisions or matrices. This makes managing complex global companies more feasible.
Benefits of producing overseas compared to exporting
One way of exploring the decision by a domestic company to internationalize its production is to consider the advantages of producing at home vis-a-vis overseas.
Consider a market-oriented company first. By exporting, the company can concentrate production in a single plant at home, reaping the advantages of lower production costs which flow from economies of scale and avoiding the costs of managing an overseas facility. By producing overseas, however, the company can avoid the costs of transporting its products and incurring tariffs. All other things being equal, the greater the scope for economies of scale and the higher the costs of managing offshore facilities, the more likely a firm will be to forego internationalization in favour of a large domestic plant; conversely, the smaller the scope for economies of scale and the higher the transports costs and tariffs faced when exporting, the greater the incentive to invest directly in overseas capacity.
Figure 7.5(a) illustrates these basic principles graphically. It shows the demand (average revenue) and marginal revenue schedules it faces in its overseas market. For simplicity, the marginal cost of production, whether at home or abroad, is assumed to be constant at C1 (with a given fixed cost, this implies that average total costs decline as production increases). The marginal cost of supplying the overseas market from a domestic production platform is C2, where C2 - C1 is equal to the unit costs of transport and tariffs. The firm faces fixed production costs of F1 if it produces at home and F2 if it produces abroad, where F2 is assumed to be greater than F1,
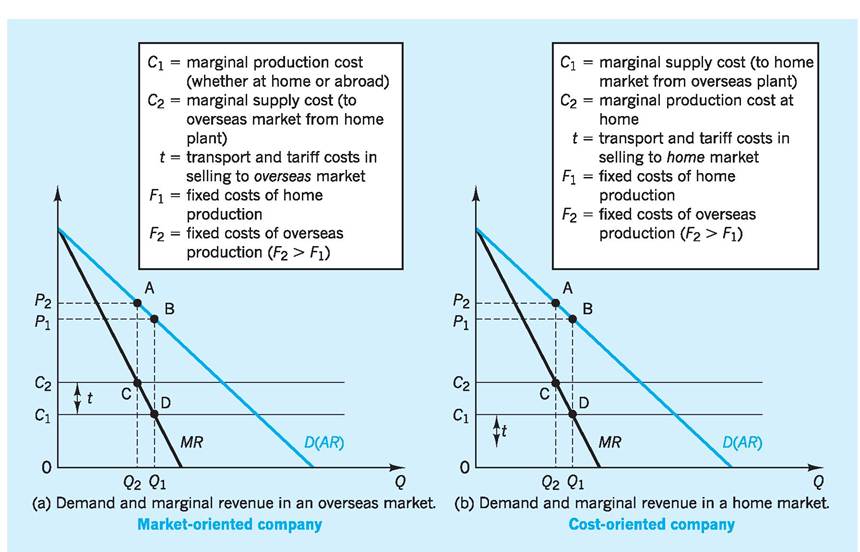
Fig. 7.5 Demand and marginal revenue depending on company and market.
given the higher costs of managing an overseas production facility. Consider the firm’s options.
■ If the firm exports to the overseas market, it will set C2 equal to marginal revenue, charging a price P2 and earning profit equal to P2ACC2 - F1.
■ If the firm establishes an overseas production facility, then it will set C1 equal to marginal revenue, charging a price P1 and earning profit equal to P1BDC1 — F2.
Clearly, the firm’s decision rule is:
1 if P2ACC2 — F1 > P1BDC1 — F2, then produce at home and export to overseas market;
2 if P1BDC1 — F2 > P2ACC2 — F1, then produce overseas.
All other things being equal, the higher the transport costs and/or tariffs levied on exports to the overseas market (i.e. C2 compared to C1), the greater will be the relative attractiveness of overseas production vis- d-vis exporting; similarly, all other things being equal, the lower the relative fixed costs of producing overseas (i.e. F2 compared to F1), the more attractive will be overseas production. The gap F2 — F1 will be reduced by advances in enabling technologies which, as we have noted, cut the costs of doing business across national frontiers.
Hence, the decision for a market-oriented firm to locate overseas rather than export hinges critically on the transport and tariff costs of serving overseas markets and the relative fixed costs of production. The greater the former, and the smaller any gap as regards the latter (F2 > F1), the more favourable the situation is to multinational activity.
The same diagram can also be reinterpreted to illustrate the decision facing a cost-oriented multinational. In this case (Fig. 7.5(b)), the demand and marginal revenue schedules are drawn for the home market. C2 is now the company’s marginal cost of producing at home for its domestic market, while C1 represents the marginal cost of supplying the home market from an overseas production platform and shipping back to the home market. Despite the costs of transport and tariffs, it is assumed here that overseas production is subject to lower supply costs, for example because of lower labour costs.
■ If the firm produces at home, it sets marginal production cost C2 equal to marginal revenue, charging a price P2 and earning profit P2ACC2 — F1.
■ If the firm produces abroad, it sets marginal supply cost C1 equal to marginal revenue, charging a price P1 and earning profit P1BDC1 — F2.
Its decision rules are now:
1 if P2ACC2 — F1 > P1BDC1 — F2, then produce at home;
2 if P1BDC1 — F2 > P2ACC2 — F1, then produce overseas and export to the home market.
All other things being equal, the lower the relative marginal costs of supplying from overseas (i.e. C1 compared to C2), the greater will be the relative attractiveness of overseas production vis-d-vis domestic production; similarly, all other things being equal, the lower the relative fixed costs of producing overseas (i.e. F2 compared to F1) the more attractive will be overseas production.
Hence, the decision for a cost-oriented firm to serve its home market from an offshore production facility rather than producing at home hinges on the relative variable costs of overseas production and relative fixed costs. The greater the (variable) cost discrepancy in favour of overseas supply, and the smaller any gap as regards overseas fixed costs compared to domestic fixed costs (i.e. F2 compared to F1), the more favourable the situation is to multinational activity.
It should be remembered that labour cost (an important variable cost) can be an important determinant of production location even within major industrialized countries. For example in 2010, the US Department of Labor calculated that the hourly compensation costs of manufacturing workers in the UK were $35.8 as compared to the US ($32.3), France ($42.9), Japan ($27.8) and Germany ($48.2). The 1,500 German subsidiaries operating in the UK see the relatively low labour costs in the UK as giving them an attractive production advantage which they can exploit by exporting their UK-produced goods back to Germany and to other European countries.
Location and internalization
The above explanations of internationalization are, however, only partial. They fail to explain why cost- oriented companies do not simply import the inputs they need from independent producers in low-cost countries rather than integrating backwards; similarly,
| Types of international production | (O) Ownership advantages (the ‘why’ of MNE activity) | (L) Location advantages (the ‘where’ of production) | (I) Internalization (the ‘how’ of involvement) | Strategic goals of MNEs | Illustration of types of activity that favour MNEs |
| Natural resource seeking | Capital, technology, access to markets; complementary assets; size and negotiating strengths | Possession of natural resources and related transport and communications infrastructure; tax and other incentives | To ensure stability of supplies at right price; control markets | To gain privileged access to resources vis-a-vis competitors | (a) Oil, copper, bauxite, bananas, pineapples, cocoa, hotels (b) Export processing, labour intensive products or processes |
| Market seeking | Capital, technology, information, management and organizational skills; surplus R&D and other capacity; economies of scale; ability to generate brand loyalty | Material and labour costs; market size and characteristics; government policy (e.g. with respect to regulations and to import controls, investment incentives, etc.) | Wish to reduce transaction or information costs, buyer ignorance, or uncertainty, etc; to protect property rights | To protect existing markets, counteract behaviour of competitors; to preclude rivals or potential rivals from gaining new markets | Computers, pharmaceuticals, motor vehicles, cigarettes, processed foods, airline services |
| Efficiency seeking (a) of products (b) of processes | As above, but also access to markets; economies of scope, geographical diversification, and international sourcing of inputs | (a) Economies of product specialization and concentration (b) Low labour costs; incentives to local production by host governments | (a) As for second category plus gains from economies of common governance (b) The economies of vertical integration | As part of regional or global product rationalization and/or to gain advantages of process specialization | (a) Motor vehicles, electrical appliances, business services, some R&D (b) Consumer electronics, textiles and clothing, cameras, pharmaceuticals |
| Strategic asset seeking | Any of first three that offer opportunities for synergy with existing assets | Any of first three that offer technology, markets and other assets in which firm is deficient | Economies of common governance; improved competitive or strategic advantage; to reduce or spread risks | To strengthen global innovatory or production competitiveness; to gain new product lines or markets | Industries that record a high ratio of fixed to overhead costs and which offer substantial economies of scale or synergy |
| Textile and distribution (import and export) | Market access; products to distribute | Source of inputs and local markets; need to be near customers; after-sales servicing, etc. | Need to protect quality of inputs; need to ensure sales outlets and to avoid under-performance or misrepresentation by foreign agents | Either as entry to new markets or as part of regional or global marketing strategy | A variety of goods, particularly those requiring contact with subcontractors and final consumers |
| Support services | Experience of clients in home countries | Availability of markets, particularly those of ‘lead’ clients | Various (see above categories) | As part of regional or global product or geographical diversification | (a) Accounting, advertising, banking, producer goods (b) Where spatial linkages are essential (e.g. airlines and shipping) |
| Source: Adapted from Dunning (1993). | |||||
136 CHAPTER 7 THE MULTINATIONAL CORPORATION
they do not explain why market-oriented companies should operate their own production facilities in foreign markets rather than licensing local manufacturers to produce their products. A full explanation needs to account for both ‘location’ (i.e. why a good is produced in two or more countries rather than simply one) and ‘internalization’ (i.e. why production in different locations is done by the same firm rather than different firms).
Dunning (1993) attempted to synthesize different theoretical perspectives on multinationals with the evidence provided by case studies. He concluded that companies will only become involved in overseas investment and production when the following conditions are all satisfied:
1 companies possess an ‘ownership-specific’ advantage over firms in the host country (e.g. assets which are internal to the firm, including organization structure, human capital, financial resources, size and market power);
2 these advantages are best exploited by the firm itself, rather than selling them to foreign firms. In other words, due to market imperfections (e.g. uncertainty), multinationals choose to bypass the market and ‘internalize’ the use of ownership specific advantages via vertical and horizontal integration (such internalization reduces transactions costs in the presence of market imperfections); and 3 it must be more profitable for the multinational to exploit its ownership-specific advantages in an overseas market than in its domestic market, i.e. there must additionally exist ‘location-specific’ factors which favour overseas production (e.g. special economic or political factors, attractive markets in terms of size, growth or structure, low ‘psychic’ or ‘cultural’ distance, etc.).
The decisions of multinationals to produce abroad are, therefore, determined by a mixture of motives - ownership-specific, internalization and locationspecific factors - as noted above. These are also summarized in a more effective way in Table 7.9.
Honda case study
However, to understand the complexity of motives which underlie multinational activity it may be helpful to consider an actual example, namely Honda Europe. Figure 7.6 shows the Honda motorcycle network in Europe together with its outside supply links. Honda is very much a multinational company with a transnationality index of over 50%. It began by exporting motorcycles to Europe, but this was quickly followed by its first European overseas affiliate in 1962. This affiliate, Honda Benelux NV (Belgium), was set up in order to establish strong bonds with European customers as well as to provide a ‘learning’ opportunity before Honda brought its automobile production to Europe. Figure 7.6 shows that, by the late 1990s, Honda’s operations had widened significantly, with its affiliates in Germany acting as its main European regional headquarters. Honda Deutschland GmbH coordinates the production and marketing side, while Honda R & D Europe is engaged in research, engineering and designing for all the affiliates in Europe.
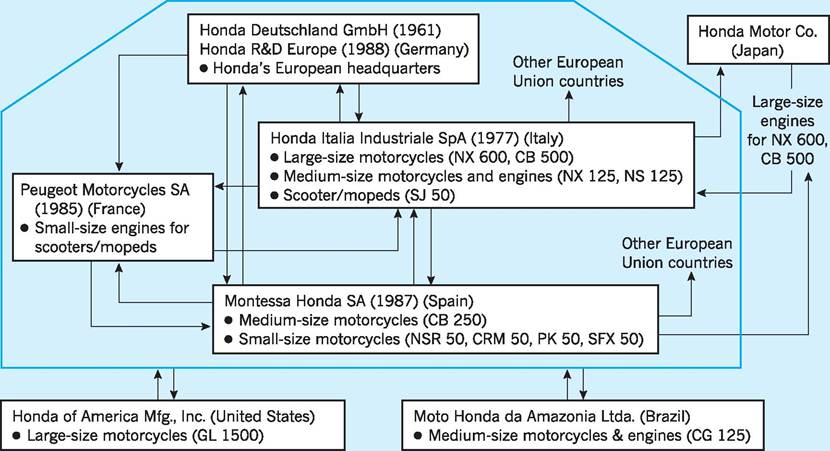
Fig. 7.6 Honda: EU motorcycle networks and supply links.
Source: Various (2010) and UNCTAD (1996), World Investment Report, p. 102.
Honda’s key assembly affiliates are Honda Industriale SpA (Italy) which is wholly owned, and Montessa Honda SA (Spain) which is majority owned (88%). These companies were originally designed to concentrate on the assembly of specific types of motorcycle model appropriate to the different European locations in order to benefit from various economies of scale. At the same time, each assembler exported its own model to the other Honda locations in Europe in order to gain economies in joint production and marketing; in other words any given model is produced in one location, but a full range of models is offered for sale in all locations. Finally, in the international context, Honda’s European models are also exported to its subsidiaries in the US, Brazil and Japan, while its European network imports large and mediumsized motorcycles from its US and Brazil affiliates.
As far as motorcycle parts are concerned, engines and key parts were initially supplied from Japan. However, in 1985 Honda acquired a 25% stake in Peugeot Motorcycles SA and began producing small engines in France for scooters and mopeds. These engines were then supplied to its Italian and Spanish assemblers of scooters and mopeds. Following this, medium-sized engines began to be produced in Honda Italia Industriale, both for its own models and for Montessa Honda, while the latter began producing frames and other parts locally. By 2010, Honda Europe as a whole (cars, motorcycles and power equipment) had a turnover of 698 million euros with eight logistic centres located in Europe to integrate all their parts businesses. These centres have a total of 705,000 different parts to manage and some 35,000 orders are processed every day. As far as the motorcycle division (which is shown in Fig. 7.6) is concerned, Honda Europe delivers 133,100 motorcycles per year with dealers being supplied with the motorcycle they want within 48 hours. The complex linkages outlined in Fig. 7.6 have been shown to be organizationally very successful.
This study of Honda illustrates the complex set of motives underlying multinational activity which were discussed earlier. The traditional technical economies of scale were exploited to reduce average costs as were the more market-based advantages from producing within the EU with its 460 million consumers. In addition, the improved communications within the EU and the rise of more sophisticated corporate structures enabled Honda to integrate operations both horizontally, through affiliate specialization in particular models, and vertically, through specialization of affiliates in the production of parts. Honda was able to capitalize on its well-known ownershipspecific advantages of excellent quality engineering and sound business skills, and to combine this with an intelligent strategy for locating production within the largest consumer market in the world. The Honda experience also helps to illustrate the nature of multinational inter-firm activity within a sophisticated market dominated by product differentiation.
The impact of multinationals on the UK economy
The UK is unusually exposed to the influence of multinationals. As noted above, the UK is an important home country of multinationals, with the majority of its top companies operating overseas subsidiaries. By 2009, official records show that the UK was the home for 2,360 parent corporations which operated internationally. Since the register does not give a complete picture of the involvement of smaller companies, we can take this to be an underestimate of the total number, although it provides a useful guideline as to the number of medium to large UK multinational companies. However, we can supplement this data by using the flows of foreign direct investment from the UK as a measure of the UK’s multinational involvement in the world’s economy. Here we find that during the 2007-09 period the UK accounted for 19% of total EU outflows of FDI, ahead all EU countries except France.
Table 7.10 The ten largest foreign takeovers of UK companies between 2000 and 2010 (£bn).
| Acquired company | Sector | Acquiring company | Sector | Acquirer’s nationality | Value (£bn) | Date |
| O2 | Mobile communications | Telefonica | Telecommunications | Spain | 18.0 | 2005 |
| Cadbury | Confectionery | Kraft Foods | Food | US | 11.5 | 2010 |
| Alliance Boots | Pharmacy/Health | KKR | Private Equity | US | 11.1 | 2007 |
| BAA | Airport Management | Ferrovial | Infrastructure | Spain | 10.0 | 2006 |
| Powergen | Electrical Generation | E.ON | Management Electrical Generation | Germany | 9.6 | 2002 |
| ICI | Chemicals | Akzo Nobel NV | Paints/Chemicals | Netherlands | 8.0 | 2008 |
| Thames Water | Water/Sewerage | RWE | Energy | Germany | 4.8 | 2001 |
| Corus | Metals | Tata Steel | Metals | India | 4.3 | 2006 |
| Jaguar/ | Automobiles | bgcolor=white>TataConglomerate | India | 1.1 | 2008 | |
| Land Rover Pilkington | Glass | Nippon Sheet Glass | Glass | Japan | 1.8 | 2006 |
| Sources: Various. |
The UK is also a major host country for foreign multinationals. Table 7.10 gives an indication of this reality by identifying the ten largest foreign takeovers of UK companies between 2000 and 2010.
A snapshot of the involvement of foreign multinational in the UK is evidenced by statistics from the UK Trade and Investment (UKTI) which showed that for the year April 2009 to March 2010 there were some 1,619 projects undertaken in the UK involving foreign multinationals (Department for Business, Innovation and Skills 2010). They created some 53,358 new jobs and safeguarded a further 40,000 jobs, i.e. 93,000 jobs in all. The US continued to be the main source of inward investment into the UK with Japan being the main Asian investor, although India (4th largest investor) and China (6th) were becoming more active investors. In Europe, France with 99 projects and Germany with 90 projects created altogether some 13,000 jobs in the UK during the period shown.
Of all the 1,619 projects initiated in the UK by foreign multinationals between April 2009 and March 2010, some 44% were in the service sector, 17% in R&D, 17% in setting up headquarters in the UK and 15% in manufacturing. These figures show the continued importance for the UK of learning from leading foreign competitors and the increasing importance of the service sector in the globalization process.
What are the implications for the UK economy of such openness to multinationals? Advocates of multinationals argue that the economy benefits from their activities, with outward and inward foreign direct investment accelerating industrial restructuring and ensuring the most efficient allocation of resources. On the other hand, critics argue that outward FDI by UK-owned multinationals denies the economy sorely-needed investment and jobs, while the influx of foreign multinationals undermines the nation’s economic sovereignty.
An economic cost-benefit appraisal of multinational activity
It is clear that there are strongly contrasting views of multinationals. However, such divergent views are often coloured by implicit assumptions about the nature of the multinationals involved and, as noted in the introduction, international companies are so heterogeneous in their nature that generalizations are both difficult and potentially dangerous. For example, the precise balance of economic costs and benefits that a foreign multinational imposes on the UK economy depends upon:
■ how the multinational establishes itself in the UK (e.g. via a greenfield site investment or the takeover of locally owned productive assets, etc.);
■ whether funds used for the investment are raised locally or ‘imported’;
■ the function of the multinational (e.g. whether it is cost- or market-oriented); and
■ characteristics of host and parent economies (e.g. the extent to which there is ‘culture dissonance’).
These costs and benefits can be explored in more detail under six main headings. Consider each in turn.
Foreign direct investment (FDI) and economic welfare
Direct investment by a foreign multinational is widely regarded as an unambiguous improvement in economic welfare. Figures 7.7(a) and (b) illustrate the potential economic gains from cross-border investment by multinationals in search of the highest marginal rate of return on capital. These figures show the marginal product of capital in both the home country (MPKh) and overseas (MPKf) respectively. Initially, in the absence of multinational activity, capital is relatively less abundant in the home country and with a capital stock, K1, the marginal product of capital is B. GDP is given by the area under the curve, 0ACK1, of which 0BCK1 is the reward to capital and BAC is the reward to labour. Similarly, in the overseas sector, the capital stock is K4, giving rise to a marginal product of capital equal to J and a GDP of 0GLK4, of which OJLK4 is the reward to capital and JGL the reward to labour.
Given this disparity between the marginal productivity of capital in different countries, profitmaximizing multinationals will reallocate capital from overseas to the home country, increasing the capital stock from K1 to K2, while reducing it overseas from K4 to K3. GDP in the home country will rise to OAFK2, an increase of K1CFK2. GDP overseas will fall to OGIK3, a reduction of K3ILK4. However, remember that a proportion of GDP is a reward to capital and, in the case of multinational investment in the home country, this profit will be repatriated overseas. Hence, for the home country, the net gain from the inward investment is only EFC (the reward to labour), with K1EFK2 being repatriated by the foreign multinationals. Conversely, overseas, the loss of GDP (K3ILK4) is offset by the repatriated profit K1EFK2. Since K1K2 (the increase in the capital stock in the home country) is equal to K3K4 (the decrease in the capital stock overseas), and D (new marginal product of capital at home) is equal to H (new marginal product of capital overseas), then area K1EFK2 must exceed area K3ILK4. Thus, the home country benefits as a result of the multinational activity (by the amount of the value-added by its domestic labour force) and overseas producers gain (because the reward from the extra production generated by the use of their capital exceeds its opportunity cost in the overseas market).
This conventional analysis of the impact of multinational investment implicitly assumes, however, that
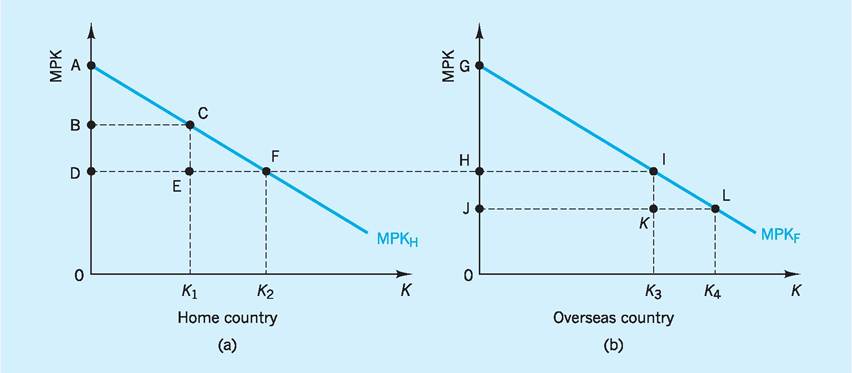
Fig. 7.7 Marginal product of capital, home and overseas.
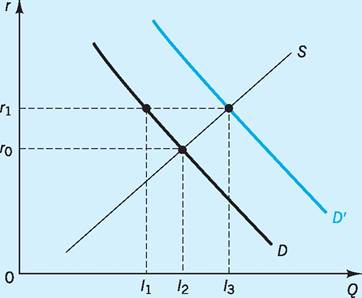
Fig. 7.8 Investment financed from overseas versus investment financed locally.
the investment constitutes a reallocation of productive capital from overseas to the host country. In practice, this assumption may be violated in two ways.
First, multinationals frequently finance overseas investment either from the retained profits earned by their existing productive or sales operations in the target country or by raising the capital on the local capital market. In both cases, the multinational’s investment may simply displace domestic investment that would otherwise have taken place. Figure 7.8 illustrates this dilemma.
An investment financed by a capital inflow from the parent multinational overseas bypasses the domestic market for loanable funds, leaving the balance of domestic savings and investment unchanged at I2, with rate of interest r0. However, raising funds locally to finance the investment increases the demand for loanable funds (from D to D'), leading to a rise in interest rates (from r0 to r1) and the crowding out of domestic investment (which falls from I2 to I1).
Second, multinational investment more frequently involves the takeover of existing assets, rather than greenfield site investment in new plant and equipment. Table 7.10 gives an indication of this reality by identifying the ten largest foreign takeovers of UK companies between 2000 and 2010. In this case, the total capital stock of the host country is unaffected by the FDI, with the ownership of existing assets simply being transferred from local investors to the foreign multinational.
Technology transfer
It is widely held that multinational activity by more efficient foreign multinationals promotes technology transfer to the benefit of domestic companies. For example, a study of foreign-owned establishments in the UK during the 1990s found that they adopted new technologies earlier than their indigenous UK counterparts (te Velde 2003). Another survey compared the performance of UK-based (non-exporting) companies taken over by UK multinationals, with similar UK companies taken over by foreign multinationals. It seemed that productivity in those UK firms taken over by foreign multinationals was much higher after the takeover than for those firms taken over by UK multinationals. The gap between the productivity performances of the two groups was much greater for high-technology sectors, indicating that foreign multinationals have an even more dominant effect at the high-technology end of production (Girma 2003).
On a practical level, when Nissan established a car plant in north-east England, it demanded much higher standards of UK component suppliers than the incumbent national producers such as Ford and Rover. Nissan’s engineers assisted these supplying companies to upgrade their production processes in order to meet their requirements. The result was the creation of a strong positive externality: the international competitiveness of the UK car supply industry was strengthened and, as a direct consequence, the quality of the inputs to domestic auto makers improved.
This so-called ‘technology transfer’ is clearly maximized by such ‘direct linkages’ with domestic suppliers, which occurs when incoming multinationals such as Sony, Nissan, Honda and Toyota work closely with domestic suppliers to raise the standard of UK-produced inputs. There are, however, also positive indirect ‘demonstration effects’ which may promote technology transfer. At its simplest, these relate to attempts by less efficient local producers to imitate the superior processes and organization advantages of the foreign interlopers.
Some attempts have been made to measure the ‘spillover’ benefits of foreign multinationals on UK industry. For example, one study of UK manufacturing between 1974 and 1995 found that foreign ownership of companies via FDI creates more intraindustry benefits (i.e. positive effect on suppliers, direct linkages, etc.) than inter-industry benefits (i.e. demonstration-type or motivational effects on domestic industry) (Harris and Robinson 2004).
There are, however, clear limitations to technology transfer. Most obviously, one of the most powerful drivers for foreign investment is the advantage to a multinational of internalizing an ownership-specific advantage. Such considerations militate against the notion that a foreign multinational will willingly share the technologically based sources of its competitive advantage over local rivals. Moreover, in the case of Japanese multinationals, their historical advantage was built upon close relationships with Japanese suppliers. For example, the big four Japanese motorcycle companies (Honda, Yamaha, Suzuki and Kawasaki) rely heavily on a very limited number of domestic suppliers (e.g. Bridgestone for tyres, Nippon Denso for electronic components, etc.). Early dissatisfaction with UK suppliers with regard to quality and reliability of deliveries has led to a number of these Japanese suppliers following their major customers into the European market, thereby reducing the potential scope for technology transfer via linkages with local suppliers.
A final problem relates to the issue of cultural dissonance. The psychic distance between US and UK companies is relatively small. Both share a broadly common culture, a common language and a reasonably high level of mutual understanding. The success of multinationals from, say, Japan or other parts of East and South-East Asia is built on a very different set of social and cultural values, which are not easily transferable to the UK setting. Companies such as Sony, Nissan and Honda have all reported difficulties in establishing Japanese-style work practices, which many economists regard as an integral part of that country’s corporate success. The operation of ‘just-intime’ (or ‘kanban’) production processes and ‘quality circles’ relies on employee loyalty to his or her company, which in Japan is reinforced by life-time employment and a shared set of values which emphasizes collectivism. Such techniques are much less easily transposed to western cultures with their stress on individualism and self-determination.
Balance of payments
As noted above, the positive balance of payments impact of multinational activity depends, in the first instance at least, on whether the funds are imported (a capital inflow) or raised locally. Even if the capital is imported, however, the ultimate balance of payments effect may still be negative. At its simplest, multinationals invest in productive facilities overseas because they believe that the net present value of the profits they will be able to repatriate exceeds the capital investment they will make. It follows that, if a multinational invests rationally, the initial capital inflow must be at least matched by the net present value of future outflows on current account (i.e. net payments of interest, profit and dividend abroad). In crude money terms, the total value of the repatriated returns to capital will dwarf the original investment made.
Moreover, the speed with which an initial capital inflow is reversed by outflows on the current account depends critically on the function of the multinational. In the case of a market-oriented company intent on ‘jumping tariffs’, the multinational may attempt to import part-finished products, using cheap local labour to assemble the final product. Volkswagen was accused of this technique during the 1970s in Brazil, when it established a manufacturing plant in which workers assembled ‘complete knock-down kits’ into finished cars which were sold, tariff-free, in the Brazilian market. The impact on the current account was strongly negative, with visible imports being inflated by the cost of the kits and invisible imports being increased by the repatriated profits. Most countries (including Brazil) now have extensive ‘rules of origin’ to prevent such ‘screwdriving operations’ being used by multinationals as a device for evading tariffs. In Britain’s case, however, inward foreign direct investment has historically been generally outweighed by higher outward capital flows.
Employment
Faced with persistently high levels of unemployment in many European countries, it is perhaps understandable that so many states should court foreign multinationals in the belief that their investments will create local employment. Recent investments by major Japanese and US multinationals have, for example, been accompanied by strong competition on the part of national and regional governments in the EU to attract the investment in the hope of generating work. For example, the efforts noted above have been partly responsible for the inflow of Japanese investment into UK industry.
The ultimate employment effect of multinational activity is rather more complex. The net employment effect is a function of three factors:
1 direct job creation, which depends on the size of the foreign-owned subsidiary and the labour (or capital) intensity of its production processes;
2 indirect job creation, which depends on linkages with local suppliers and the value-added by domestic factors of production; and
3 the ‘Trojan horse’ effect, namely the displacement of domestic incumbents by the more efficient multinational company, which depends upon the latter’s market power.
In practice, it is difficult to gauge the net employment effect of multinational activity in the UK. There is no question that direct job creation has been significant, as witnessed by the eagerness of local authorities in areas of high unemployment to woo potential investors to their region. The UK government estimated that nearly 500,000 jobs were created by overseas businesses in the country between 1979 and 1998. However, indirect job creation (like technology transfer) is clearly limited by the extent to which foreign multinationals rely on imported intermediate products (e.g. inputs shipped from the parent company for local assembly). Under pressure from the EU, Japanese multinationals in the UK, for example, have raised the percentage of ‘local’ (i.e. EU) content in finished products to 80%. Finally, to the extent that (by definition) foreign multinationals enjoy ownership-specific advantages over domestic rivals, their success is likely to be at the expense of the declining market share enjoyed by the existing incumbents - direct (and indirect) jobs gains may thus be offset by induced job losses in the adversely affected companies. The difficulty of estimating this Trojan horse effect in the UK is that the foreign multinational’s output may compete with (and displace) exports from other countries, rather than with domestic production; by the same token, part or all of the multinational’s output may be exported (e.g. to other states in the EU). Hence, the UK may enjoy the direct job gains, while the Trojan horse losses (which could well be larger) may fall on third countries, inside or outside the EU. In recent years, certain EU governments, notably France, have expressed precisely this fear, suspecting that the Japanese-led renaissance of the UK’s consumer electronics and car industries will be at the expense of French, German and Italian workers.
In the UK, the Trojan horse effect is seen when foreign multinationals, often with UK government subsidies, create employment in the UK but at a high cost per worker and by displacing indigenous companies. For example, it was calculated in the late 1990s that the subsidy given to the Korean Lucky Goldstar (LG) electronics company to locate production in South Wales amounted to £40,000 per job created - while indigenous investment could generate more high quality jobs for a much lower subsidy of between £2,000 and £3,000 per job (Financial Times 1998).
Industrial structure
The ownership-specific advantage often enjoyed by foreign multinationals is their market size and power. One consequence of this is, inevitably, the displacement of less efficient domestic producers. Under certain circumstances, it is sometimes argued that foreign direct investment may result in the truncation of the host economy (i.e. the gradual loss of those economic sectors critical to self-sustained growth) and its subsequent dependence on overseas multinationals for continued growth and employment. In extremis, it is sometimes claimed that the widespread presence of foreign multinationals may lead to a loss of economic sovereignty on the part of the host country’s government. The counter argument is that, at least in the case of the UK, foreign direct investment has positively benefited the UK’s economic structure, channelling funds into those sectors (e.g. high technology manufacturing, car production, etc.) in which the economy enjoys a comparative advantage and thereby accelerating economic restructuring. This argument is supported by the work of Girma noted previously (Girma 2003).
Taxation
Multinationals are widely accused by governments of arranging intra-company transactions in order to minimize their tax liabilities, effectively forcing countries to compete to provide the lowest tax regime. Consider a simplified example in which a multinational’s production is vertically integrated, with operations in two countries. Basic manufacture takes place in country A and final assembly and sale in country B (see Table 7.11). In country A, the corporate tax rate is 25%, while in country B it is 50%. Suppose the company’s costs (inputs, labour, etc.) in country A are $40m and it produces
Table 7.11 Multinational tax avoidance.
| $m | Scenario 1 | Scenario 2 | ||
| Country A | Country B | Country A | Country B | |
| Costs | 40 | 90 | 40 | 100 |
| Sales | 50 | 100 | 60 | 100 |
| Profit | 10 | 10 | 20 | 0 |
| Tax liability | 2.5 | 5 | 5 | 0 |
| Total tax | 7.5 | 5 | ||
intermediate products with a market value of $50m; if it were to sell these intermediate products in the open market, it would declare a profit of $10m in country A, incurring a tax liability of $2.5m in that country.
However, suppose the products are actually intended for the parent company’s subsidiary in country B. In Scenario 1, the ‘transfer price’ (i.e. the internal price used by the company to calculate profits in different countries) is set at the market price of $50m in country A for the intermediate products which are now to be ‘shipped’ to country B for incorporation into the final product. The operation in country B incurs additional costs of $40m, after which the final product is sold in country B for $100m; thus the subsidiary will declare a profit of $10m and incur a tax liability of $5m. The company as a whole will face a total tax liability of $7.5m in countries A and B taken together.
Consider an alternative scenario (Scenario 2), in which the company sets a transfer price above the market price for the intermediate products manufactured in the low-tax country, A. With a transfer price of $60m rather than $50m and the same costs of $40m, the subsidiary in country A incurs a higher tax liability (25% of $20m), but this is more than offset by the lower (in fact, zero) tax liability incurred by the subsidiary in country B. Because the latter is now recording its total costs (including the cost of the intermediate products ‘bought’ from the subsidiary in country A) as being $100m rather than $90m, its profits and tax liability fall to zero. As a result, the total tax liability faced by the company on its international operations is only $5m, rather than $7.5m.
The basic issue is that the multinational has earned a total profit of $20m on its vertically integrated operation, i.e. $100m actual sales revenue in B minus $80m costs in A + B. However, by setting transfer prices on intra-company sales and purchases of intermediate products appropriately, the company can ‘move’ this profit to the lowest-tax country, thereby denying the higher tax country (in this case, country B) the tax revenue to which it is entitled. Such transfer pricing can, of course, only succeed when there is no active market for the intermediate products being traded. If the tax authorities in country B can refer to an open market price for the intermediate product, the inflated transfer price being paid can be identified. However, to the extent that many multinationals internalize cross-border operations because they have ownership-specific advantages (e.g. control of a specific raw material or technology), it may be that comparable intermediate products are not available on the open market. For this reason, high-tax countries may find they lose tax revenues to lower-tax centres as business becomes increasingly globalized. This creates, in turn, an incentive for countries to ‘compete’ for multinational tax revenues by offering low tax rates; the result of such competition is a transfer of income from national governments to the shareholders of multinational companies.
The potential for multinationals to try to avoid tax, as shown in Table 7.11, can be understood by looking at the corporation tax rates across Europe. For example, in 2010, the combined central and local government corporation tax rates varied from 34% in France to 28% in the UK - with rates in the Czech Republic (19%), Poland (19%) and Ireland (12.5%) being significantly lower. Such divergences in tax rates provide ample opportunities for tax avoidance activity.
Conclusion
Multinationals play a more influential role in the UK economy than in any other major, developed country in the world. Most of the household-name companies in Britain - BP, Unilever, Ford, Kellogg, Heinz, Cadbury Schweppes - are multinationals. In the past, companies became multinational to secure resources and markets or to overcome the transport costs associated with exporting. Increasingly, multinationals are becoming genuinely global, performing different stages of an integrated productive process in different countries to exploit natural and government-induced differences in factor costs as we saw in the case of Honda. There is a fierce debate about the benefits and costs of multinational activity for individual economies such as that of the UK. What is clear, however, is that the growth of multinationals will continue into the next century and that an increasing proportion of UK companies will do the majority of their business overseas, while an ever-higher share of UK production will be controlled by foreign companies.
Indeed, it is already becoming increasingly meaningless to think of companies as ‘British’ or ‘foreign’. Is Ford, an ‘American’ company which designs and builds cars in the UK, ‘foreign’? Is Attock Oil, a ‘British’ oil exploration and production company which operates only in North America and SE Asia, ‘British’? As companies become increasingly global in nature, the convention of labelling a company’s nationality by reference to the nationality of its controlling shareholders will become redundant. Imagine the Ford Motor Company, owned by Japanese shareholders, run by an American chief executive, producing components across the EU and assembling them in Turkey for sale in Russia. In what sense is such a multinational ‘American’, ‘Japanese’ or even ‘European’? The multinational of the future is likely to be genuinely ‘stateless’. Already the trend towards statelessness is well underway and the implications of this phenomenon are liable to be profound.
Key points
■ A ‘multinational’ is a company which owns or controls production or service facilities in more than one country.
■ There are some 82,000 multinational companies, the sales revenue of which amounts to over 50% of world GDP. Only 15 nation states have a GDP greater than the annual turnover of Exxon, Ford or General Motors.
■ Multinationals account for around 30% of GDP in the UK and almost half of manufacturing employment.
■ Foreign multinationals account for 11% of UK employment and 23% of UK turnover. The US dominates the scene, accounting for 42% of all foreign multinational employment in the UK and 37% of all foreign multinational turnover.
■ Successful multinational activity from the home base usually depends on the possession of ‘ownership-specific’ advantages over firms in the host country, together with ‘location-specific’ advantages which favour overseas production.
■ Cost-oriented multinationals focus mainly on reducing costs of production via overseas production (often via vertical integration); market-oriented multinationals focus mainly on easier sales access to overseas markets via overseas production (often via horizontal integration).
■ Being both a ‘home’ country to (UK) multinationals as well as a ‘host’ to foreign multinationals results in substantial flows of outward and inward foreign direct investment (FDI).
■ The costs and benefits of multinational activity for the UK (or indeed any country) can usefully be assessed under six main headings:
(i) FDI and economic welfare
(ii) technology transfer
(iii) balance of payments
(iv)employment
(v) industrial structure
(vi)taxation.
Now try the self-check questions for this chapter on the Companion Website. You will also find useful links to relevant websites.
References and further reading
Bloom, N., Sadun, R. and Van Reenen, J. (2007) Americans Do I.T. Better: US Multinationals and the Productivity Miracle, Discussion Paper no 788, London, Centre for Economic Performance, LSE.
Buckley, P. J. (1992) New Dimensions in International Business, Cheltenham, Edward Elgar.
Cleeve, E. (1994) Transnational corporations and internationalisation: a critical review, British Review of Economic Issues, 16(40).
Crum, R. and Davies, S. (1991) Multinationals, Heinemann Educational.
Department for Business, Innovation and Skills (2010) UK Inward Investment Report 2009/10: UK at the Heart of Global Business, July, London, The Stationery Office.
Dicken, P. (2011) Global Shift: Reshaping the Global Economic Map in the 21st Century (6th edn), London, Sage Publications.
Dunning, J. (1996) Globalisation, foreign direct investment and economic development, Economics and Business Education, 4(3): 46-51. Dunning, J. H. (1993) Multinational Enterprises and the Global Economy, Harlow, Addison- Wesley.
Economist (1996) Economic Indicators, 27 April.
Financial Times (1998) Regions take an inward look at a growing problem, 21 May.
Fortune (2010) Global 500, July.
Girma, S. (2003) The domestic performance of UK multinational firms, National Institute Economic Review, 185(July): 78-92.
Greenaway, D. (1993) Trade and foreign direct investment, European Economy, 52: 103-28. Harris, R. and Robinson, C. (2004) Productivity impacts and spillovers from foreign ownership in the United Kingdom, National Institute Economic Review, 187(January): 58-75.
Kene, P. B. (1994) The International Economy, Cambridge, Cambridge University Press.
Kobrin, S. J. (1991) An empirical analysis of the determinants of global integration, Strategic Management Journal, 12(Summer): 17-31.
McKinsey Global Institute (2010) Growth and Competitiveness in the United States: The Role of its Multinationals, June, New York. Meyer, K. (2008) Multinational Enterprises and Host Economies, Cheltenham, Edward Elgar. Norman, G. (1995) Japanese foreign direct investment: the impact on the European Union, in Healey, N. (ed.), The Economics of the New Europe: from Community to Union, London, Routledge, 223-38.
OECD (2010) Economic Globalisation Indicators, Paris, Organisation for Economic Co-operation and Development.
te Velde, D. W. (2003) Foreign ownership, microelectronic technology and skills: evidence for British establishments, National Institute Economic Review, 185(July): 93-106.
Thomsen, S. (1992) Integration through globalisation, National Westminster Bank Quarterly Review, August.
UNCTAD (1996) World Investment Report 1996: Investment, Trade and International Policy Arrangements, New York and Geneva, United Nations Conference on Trade and Development. UNCTAD (2005) World Investment Report 2005: Transnational Corporations and the Internationalization of R&D, New York and Geneva, United Nations Conference on Trade and Development.
UNCTAD (2009) World Investment Report 2009: Transnational Corporations, Agricultural Production and Development, New York and Geneva, United Nations Conference on Trade and Development.
UNCTAD (2010) World Investment Report 2010: Investing in a Low Carbon Economy, New York and Geneva, United Nations Conference on Trade and Development. US BLS (2010) International Labor Statistics, Washington DC, US Bureau of Labor Statistics. Winters, L. (1991) GATT: the Uruguay Round, Economic Review, 9(2): 25-7.
Young, S., Hood, N. and Hamill, J. (1988) Foreign Multinationals and the British Economy, Croom Helm.