SOCIAL POLARIZATION
5.6.1 Concepts and Motivation
Social polarization arises when people are clustered according to social characteristics and feel alienated from others that do not share these characteristics.
The term is used when the factors that determine individuals’ identity are culturally, ideologically, historically, biologically, or socially driven and do not depend solely on their income levels. Religion, race, ethnicity, language, education, and occupation are examples of characteristics along which society may be polarized. The study of social polarization is usually motivated by the view that, in many circumstances, income may not be the only relevant (or even be a relevant) dimension that might nourish identity and differences and thus generate conflict, as suggested by Esteban and Ray (1994), Montalvo and Reynal-Querol (2005b), Collier and Hoeffler (2004), and Easterly and Levine (1997), among many others. This has led to the relatively recent development of several social polarization measures, such as those of Reynal- Querol (2002), Apouey (2007), Permanyer (2010), and Permanyer and D’Ambrosio (2013). These are particularly useful in those contexts in which cardinal data are not available and in which polarization must be built on the basis of qualitative and nonordinal variables.Religion maybe seen as one of the most important of these qualitative characteristics. Reynal-Querol’s (2002)—RQ—contention, for instance, is that religiously divided societies are more prone to intense conflicts because religious identity is fixed and nonnego- tiable. She analyzed the effect of ethnic division on civil war as well as the role of political systems in preventing these conflicts, using the importance of religious polarization and animist diversity.
Others have focused on ethnic diversity to attempt to explain economic and social phenomena such as growth, investment, government efficiency, civil wars, and unemployment.
Easterly and Levine (1997) explained part of the poor economic performance in Africa by the relatively high level of ethnic fragmentation found on the continent. Montalvo and Reynal-Querol (2002) argued that ethnic diversity leads to the choice of poor public policies and a poor design of human/physical capital accumulation in particular, which has a negative influence on long-run growth and encourages rent seeking. Mauro (1995) also contends that ethnic fractionalization increases corruption and political instability and decreases investment. Because corruption has a negative impact on investment, he concluded that ethnic diversity undermines growth, a view shared by Porta et al. (1999).5.6.2 Measurement
To see how social polarization is measured in the literature, let us first recall the Esteban and Ray (1994) index of Equation (5.2):
In the case of social polarization, where income plays no role and where each person is identified with every other member of the group, the alienation function assumes values that are specific to group pairs and have no relationship to income. Denoting this alienation value by δjk for a pair of groups j and k, Duclos et al. (2004) suggested a natural simplification of the ER and DER polarization measures as:

Substituting the Euclidean distance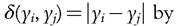 the discrete distance
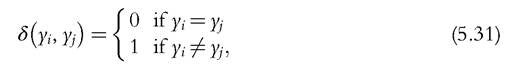
a social polarization index is defined to be proportional to
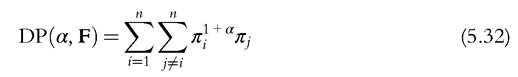
with α 2 [0, ∞ [. Alienation is thus set to zero between individuals belonging to the same group and to one between individuals belonging to different social groups.
Each value of α leads to a different social polarization index. Restricting the range of these values can be done using two axioms reminiscent of those in Esteban and Ray (1994).Axiom MRQ 1
Let there be three population groups of sizes p, q, and r where p > q > r. Ifthe two smallergroups are merged to form one new group with size then polarization increases.
Montalvo and Reynal-Querol (2002) (see also Montalvo and Reynal-Querol, 2005a,b, 2008) show that the social polarization index DP(α, F) satisfies Axiom MRQ 1 if and only if α ≥ 1. The importance of the identification effect must indeed be sufficiently strong. The impact of the disappearance of one group reduces the number of pairs of alienated groups; for α ≥ 1, this is offset by the identification effect of the formation of a larger group.
Axiom MRQ 2
Let the population be split into three groups of sizes p, q, and p. Ifthere is an equal movement of the population from group q to the two other groups, then polarization increases.
The only social polarization index DP(α, F) that satisfies Axiom MRQ 2 is the one with α = 1. DP(1, F) is the Reynal-Querol (2002) polarization index:
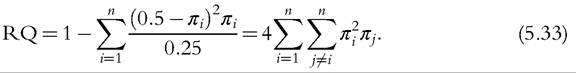
As shown in Equation (5.33), the RQ index was originally motivated and interpreted as one minus the average of the squared distances of group sizes from 0.5. In that formulation, the simple distribution of two equal-size groups is implicitly considered as the one with the most social polarization. Taking the square of the distances of group sizes from 0.5 captured the gap between group sizes and the symmetric two-group distribution. An increase in the number of groups or spreads of group sizes from 0.5 leads to lower social polarization.
Apart from fulfilling Axioms MRQ 1 and MRQ 2, the RQ index has two additional interesting properties.
With four groups, minimum social polarization is obtained when groups are all of the same sizes. Second, with n groups of equal relative size 1/n, social polarization decreases monotonically with n (see Figure 5.19).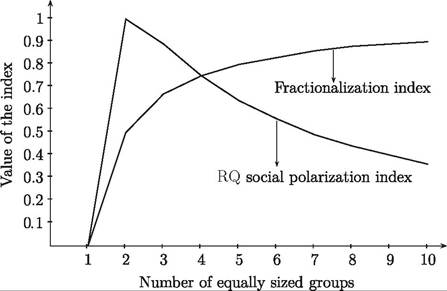
Figure 5.19 Fractionalization (FRAC) and social polarization (RQ) indices as a function of a number of equally sized groups. Source: Montalvo and Reynal-Querol (2008).
Chakravarty and Maharaj (2011b) also characterized the Reynal-Querol (2002) index of social polarization using alternative sets of independent axioms. Chakravarty and Maharaj (2012) further showed how a graph of cumulative population shares against the cumulative number of groups (ranked from the largest to the smallest ones) can rank some classes of social polarization indices of an RQ type and propose in the process a “generalized RQ index of order 3” given by

where θ 2 [0,3] and n ≥ 3. RQ(0) is the usual RQ index.
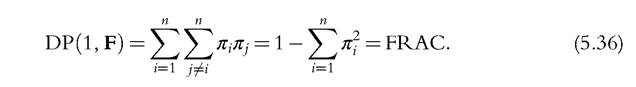
Much ofthe literature prior to Montalvo and Reynal-Querol (2002) has attempted to explain conflict through a social (often an ethnolinguistic) fragmentation index of the form:
The FRAC index, which is the complement to unity of the Hirschman-Herfindahl index (see Herfindahl, 1950; Hirschman, 1980), can be interpreted as the probability that two persons randomly drawn from a given society will not belong to the same social group. The probability that two randomly drawn individuals belong to the same group i is indeed π2; one minus the sum of those probabilities across all groups gives FRAC.
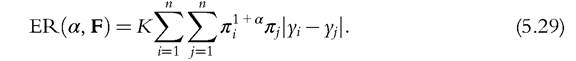
The fractionalization index can also be derived from the Gini index, which is proportional to ER(0,F) in Equation (5.29). Replacing the Euclidean distance ∣yi — yjj by the discrete distance in Equation (5.31), we obtain
Which of FRAC or of RQ should be a better predictor of conflicts has been a matter of debate.
The distinction between the two is analogous to that between inequality and polarization. Horowitz (1985) argued that there should be less violence in highly homogeneous and highly heterogeneous societies and more conflict in societies in which a large ethnic minority coexists with an ethnic majority. An increase in social heterogeneity should initially increase potential conflict, but after some point, greater diversity should eventually imply lower potential for conflicts—see also Colomer (2001) and Collier and Hoeffler (2004). If this is correct, then an index of social polarization should capture the likelihood of conflict, or the intensity of potential conflict, better than an index of fractionalization.The empirical literature provides some support to this view. Collier and Hoeffler (2004) found that religious fractionalization has no effect on the risk of conflict.
Montalvo and Reynal-Querol (2003,2008) found little empirical evidence of an effect of fractionalization on growth, but did report an important effect of religious and ethnic polarization on civil wars, investment, and the share of government consumption out of GDP, and thus on growth. Evidence showing that fractionalization is a better predictor of conflict can nevertheless be found in Alesina et al. (2003).
One way to understand better the distinction between indices of social polarization and indices of fractionalization is to consider two populations A and B, each composed of three different groups (this example is discussed in Montalvo and Reynal-Querol, 2002). The sizes of the groups in population A are given by (0.49, 0.49, and 0.01) and the sizes in population B are given by (0.33, 0.33, and 0.34). Which of these two populations is more likely to witness conflict? Fractionalization is higher in B; social polarization is larger in A. The likelihood of two individuals belonging to two different groups is indeed larger in B, but A is closer to a distribution with two equal-size groups, and thus closer to maximal social polarization.
The index of fractionalization increases whenever two-group sizes are equalized; the RQ of social polarization index increases only when these two groups are relatively large ones. The value of α in DP(α, F) cannot exceed 1, however, because with α > 1 DP(α, F) does not monotonically increase in moving from (0, 1, and 0) toward (0.5, 0, and 0.5)— and DP(α, F) thus fails Axiom MRQ 2 when α > 1.
The issue echoes the discussion of Axiom MRQ 2 on given earlier. If we shift population mass from one group equally to two other groups of equal size, then the axiom says that social polarization should increase. As mentioned earlier, the only admissible value of α for a DP(α, F) measure to satisfy that axiom is 1. With α = 0 in particular, fractionalization is not maximized with a distribution of two equal-sized groups; in fact, FRAC increases monotonically with n when n is the number of groups with equal relative sizes given by 1/n (Figure 5.19).
5.7.