THE BIG DATA ECOSYSTEM
25.2.1 Basic Processes
Figure 25.1 shows the basic operations in big data. From different possible sources, data are first extracted13 and consolidated as each source may have a different structure, organization and format.
During the transform stage a set of rules is applied to the data, including parsing to ensure its validity and completeness, modifying values, as well as merging and disaggregating data. The results from this stage are then loaded into the data warehouse. Data are also loaded to a number of data marts, subsets of the database prepared or adapted to some business process or user need. Big data is different from conventional database systems in the amount of data that is extracted, transformed and loaded and, in particular, in the strategies for storage and management in the data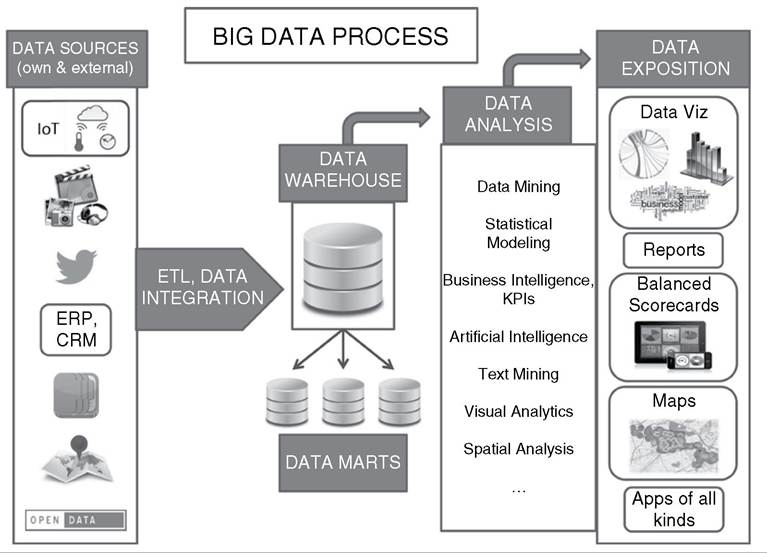
Note: CRM = customer relationship management; Data Viz = data visualization; ERP = enterprise resource planning; ETL = extract transform load; IoT = Internet of Things; KPIs = key performance indicators.
Figure 25.1 The stages of big data processing warehouse, often spread across different servers and locations. Data curation refers to all the processes described above once data are acquired.
Data analysis is the core process in big data. It comprises techniques derived from statistical analysis (all types of statistical models and regressions), computer science (data mining, machine learning, artificial intelligence), managerial and business administration (business intelligence, key performance indicators), visualization (visual analytics, spatial analytics), and an increasing number of new techniques developed specifically in the big data context (text mining, sentiment analysis, behavioral patterns) and/or derived from other scientific disciplines (network theory, agent-based modeling, complexity theory, game theory).
The last stage is most difficult to precisely define and categorize. It basically refers to the applications that can be built from the analysis. Among others it includes data queries and results as those in a search engine, visualization of results as in a map, and all types of reports from a model or simulation.
25.1.1 Players
In conventional data management, the data collected according specific rules were fed into the enterprise integration tool that transferred them into data warehouses or operational units. Then different analytical capabilities were used to extract information from the data. The process was conducted in-house or with standard database software packages and hardware. However, the volume and variety of requirements in big data has brought a considerable range of players into the sector, which can broadly be classified into four categories (see Figure 25.2):
• Technology providers (TP): Provide the core technologies upon which the whole data infrastructure is built. Given the unstructured nature of data, unlike relational database management systems (RDBMS), these technologies support nodal structures, massive parallel processing, NoSQL queries, and so on. Some key players in this category are Hadoop, MapReduce, and Cassandra.
• Infrastructure providers (IP): Provide back-end architecture for storage, analyses and retrieving of structured as well as unstructured data. IP range from individual offerings such as massive data warehouses for storage or analytics for querying to combo solutions for operational activities and storage. They can further be subclassified as analytics infrastructure (AI), operational infrastructure (OI) and databases & warehouses (D&W) (Feinleib, 2012). Key players include Oracle, Sybase, MySQL, Cloudera, TeraData, and InfoChimps.
• Analytics & visualization tools (A&VT): Provide specialized services and methodologies for analyzing big data and generating business intelligence (BI) insights for decision-making.
Most of these tools have viable graphical user interface (GUI) and client-server architectures. Important players include SAP, Hyperion, Microsoft, DataSpora, TIBCO, Ayata, Platfora, Cognos, and Autonomy.• Big data applications (BDA): Develop niches in terms of particular uses of big data, such as media applications for real-time consumer targeting, studying consumer trends, vertical applications for interpreting consumer demand and delivering relevant user experiences, log data applications for log management services or
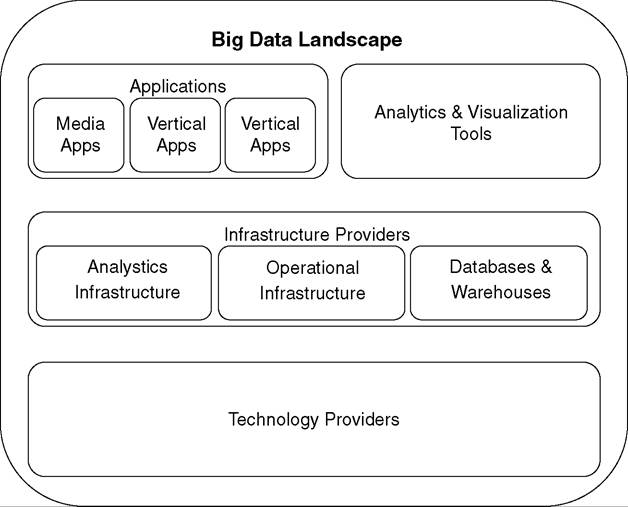
Figure 25.2 Players in big data
‘data-as-a-service’ through cloud infrastructure. Among the key players are Loggly, Media Science, Bloomreach, INRIX, and Gnip.
In more general terms, it can be said that the big data market is composed of three supply-side areas: hardware, software and services. According to industrial sources vendor revenue in the big data market reached $18.6 billion in 2013 with a growth rate of 58 percent over the previous year (Kelly, 2014). Services revenues made up 40 percent of the total market, followed by hardware at 38 percent and software at 22 percent. This breakdown is due in part to the open source nature of much big data software as well as the need for professional services to help organizations build successful use cases.
The big data ecosystem is deeply connected with cloud computing, as data are typically stored in an infrastructure consisting of a set of remote servers and the solutions to technologically manage the data as well as providing analytics and applications use this data remotely. Ignoring the acquisition part of the big data process, big data could be considered a particular sub-set of the general cloud computing paradigm.
25.1.2 Business Models and Innovations
According to Hemerly (2013) the innovations brought by big data to companies can be grouped in two broad categories: improvements in decision-making and improvements in efficiency.
Data-driven decision-making would facilitate increased objectivity, decision-making in real time, and the discovery of hidden patterns. Improved efficiency can be achieved with better and more personalized products and services. From another perspective, Buchholtz et al. (2014) talk about three ways in which data can be turned into value for a company or organization: data-to-information where data are mined for information and value is created the moment the search succeeds; data-to-product/service where insights from data analysis are implemented in practice; and data-to-management where evidence-based information feeds into the decision-making process. Finally, the OECD (2013) identifies five types of benefits from the exploitation of data in data-intensive sectors such as online advertisement, health care, utilities, logistics and transport, and public administration: enhancing research and development (data-driven R&D); developing new products (data products and services); optimizing production or delivery processes (data-driven processes); improving marketing by providing targeted advertisements and personalized recommendations (data-driven marketing); and developing new organizational and management approaches or significantly improving existing practices (data-driven organization).All in all, it can be said that big data business models are based on the achievable improvements of service quality and/or marketing capabilities of firms and organizations. With big data analytical methods, firms are supposed to be able to predict aggregate trends as well as individual preferences. This allows optimizing the returns on marketing investment and, equally important, the lowering of advertising costs and of service provision costs. Firms may also be able to increase revenues through recommendations to consumers and targeted offers (Acquisti and Varian, 2005) - the so-called behavioral advertising - as well as innovative marketing strategies (coupons, consumer loyalty enhancement, CRM techniques, etc.). Moreover, the use of big data enables firms and organizations to improve their ability to price discriminate. Furthermore, by observing individual behavior, firms can learn how to improve their services and redesign them in response to observed customer behavior (ibid.).
25.2