Transport
Transport is an important sector of any economy and has been the subject of increasing debate in recent years. This chapter will deal with certain aspects of that debate, notably the problems of road transport congestion and the move to a deregulated transport sector.
The last 60 years have seen a dramatic change in the patterns of demand for transport. For example, in 1952 only 27% of passenger kilometres travelled were by car, van and taxi, while public transport (both road and rail) accounted for 60%. Today, however, the share has changed, with 84% of passenger kilometres now being by car, van and taxi and with public transport in the form of bus, coach and rail accounting for only 13%. Such a substantial change has significant implications for road congestion and the environment. In this chapter we therefore concentrate mainly on the road transport sector, and on the car in particular, although we also include a section which deals with the growth of airline operations, especially the low-cost operators.One of the important issues involving transport activities is that of externalities, and the divergence between private and social costs and benefits. Such externalities are considered in the context of transport in this chapter and further reviewed in Chapter 8.
The characteristics of transport
First, transport is a service which is seldom demanded for its own sake and can be viewed as a ‘derived demand’. In other words, the demand for the private car, public transport and freight haulage is ‘derived’ from the need to transfer passengers and goods from one destination to another. Each journey undertaken can be seen as ‘unique’ in terms of both time and space, and cannot therefore be stored or transferred.
Second, the transport sector (both passenger and freight operators) is affected by the peak and off-peak nature of demand.
There will be periods of maximum or peak demand, e.g. on a daily basis when commuters travel into a major conurbation to work, or on a seasonal basis when holidaymakers use road, rail or airline transport during summer periods. Peak periods are present in the transport sector because of the derived nature of demand and because transport is consumed immediately and is therefore non-storable. Spare capacity at one time of the day or season cannot be used at another time of the day or season. Also, the indivisibility of supply means that public transport may be running at full capacity into the urban area in the peak period, but operating empty on the return journey. As a result there are often problems of over-supply during off-peak periods.Third, the transport sector has, over the years, been subject to varying degrees of state intervention. In the 1970s, the transport sector was characterized by public ownership and substantial government intervention, particularly in the provision of public transport. The 1980s and 1990s saw a period of rapid change, with a substantial scaling-down of state intervention in the sector. For example, the 1980 Transport Act deregulated the long-distance express coach market, allowing increased competition. The National Freight Corporation was privatized in 1982 and subsequent years saw the deregulation of local bus provision as a result of the 1985 Transport Act. Other transport companies were privatized, such as UK Airports with the 1986 Airports Act, British Airways in 1987 and NBC in 1988. In addition, there was the franchising of rail services from 1995 onwards.
Fourth, ‘externality’ effects are a characteristic of transport. These include effects such as pollution through emissions from car exhausts, noise from aircraft and motorways, and traffic congestion. At present 37% of carbon monoxide and 30% of nitrogen oxide emissions are associated with road transport in the UK. These impose costs on the community and are generally not taken into account by the transport provider (company or individual) who is usually only concerned with the private costs (such as fuel, wear and tear, etc.) of the journey undertaken.
Intervention by the state has therefore been required to deal with these external effects, especially where companies or individuals have failed to take full account of the social implications of their actions. This has led, for example, to the introduction of emission tests for carbon monoxide as part of the MoT test for cars and light vehicles and an increase in roadside enforcement programmes in order to remove the worst offenders from the road.Fifth, other characteristics of transport may be gauged from the changing nature of travel over recent years. Table 11.1 gives a summary of passenger travel in Great Britain over the period 1997-2007. It shows that there was an increase in passenger transport by 11.4% over the period, with travel by cars, vans and taxis increasing by 8.3%. Cars, vans and taxis dominate passenger transport, accounting for 84% of all passenger kilometres travelled in 2007, with bus and coach travel accounting for 6% of all passenger kilometres in 2007. Domestic air travel, although it has grown, still accounts for only 1.2% of overall travel.
Table 11.2 compares Great Britain with a number of other countries in terms of passenger kilometres travelled between 1997 and 2007. In all of these countries the major mode of transport is the private road vehicle. In Great Britain some 87% of total passenger travel in 2007 was by cars, compared with 96% in the US for the latest period available. The figure for Japan for passenger travel by cars is much lower (60%), with rail travel being much more significant (33%) than elsewhere.
Finally, another characteristic of transport is the changing nature of the freight market. In terms of freight transport, Table 11.3 gives figures in billion tonne kilometres and percentage, by mode, over the period 1998-2008. It shows that there has been a 2% increase in freight transported by road over the period and, as with passenger transport, roads can be seen as the major form of transport, with 674% of the share in the most recent time period.
Table 11.1 Passenger transport by mode, 1997-2007.
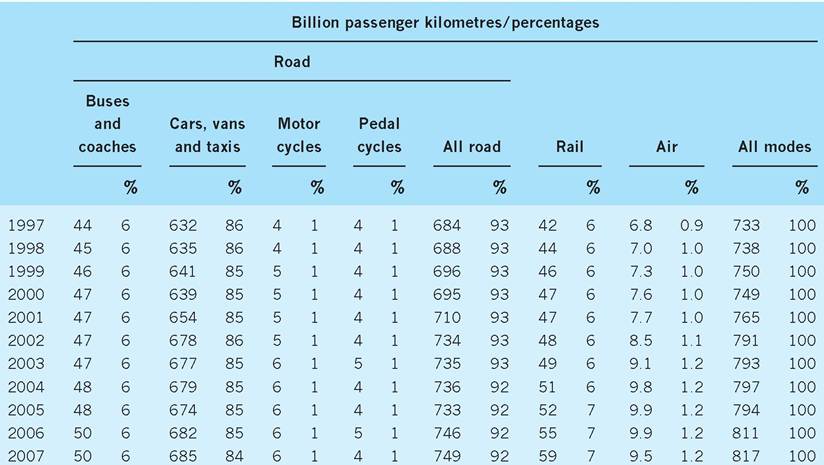
Source: Department for Transport (2009) Transport Statistics Great Britain 2008.
Table 11.2 Passenger transport by national vehicles on national territory, 1997 and 2007.
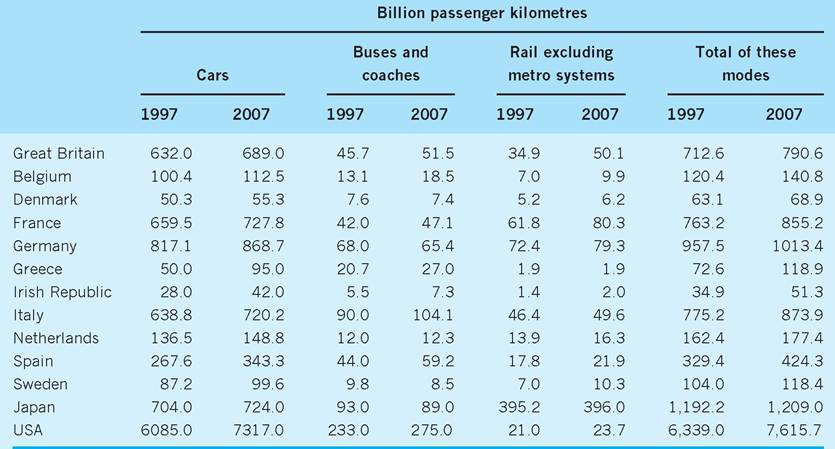
Source: Adapted from Department for Transport (2009) Transport Statistics Great Britain 2008.
Table 11.3 Domestic freight transport by mode (in billion tonne kilometres and percentages), 1998-2008.
| 1998 | 2000 | 2002 | 2004 | 2006 | 2008 | |
| All traffic | ||||||
| Road1 | 160.3 | 159.3 | 159.4 | 162.5 | 166.7 | 163.5 |
| Rail | 17.3 | 18.1 | 18.5 | 20.3 | 21.9 | 20.6 |
| Water2 | 56.9 | 67.4 | 67.2 | 59.4 | 51.8 | 49.7 |
| Pipeline | 11.7 | 11.4 | 10.9 | 10.7 | 10.8 | 10.2 |
| All modes | 246.2 | 256.3 | 256.0 | 253.0 | 251.3 | 244.0 |
| Percentage of all traffic | ||||||
| Road1 | 65 | 62 | 62 | 64 | 66 | -67 |
| Rail | 7 | 7 | 7 | 8 | 9 | -8 |
| Water2 | 23 | 26 | 26 | 23 | 22 | -20 |
| Pipeline | 5 | 4 | 4 | 4 | 4 | -4 |
| All modes | 100 | 100 | 100 | 100 | 100 | -100 |
1All goods vehicles, including those under 3.5 tonnes gross vehicle weight.
2Figures for water are for UK traffic.
Source: Adapted from Department for Transport (2009) Transport Statistics Great Britain 2008.
The demand for transport
The quantity of a good or service demanded is dependent upon a number of factors, such as its own price, the price of other goods or services (particularly close substitutes and complements), and income. For example, private car ownership is a function not only of the price of motor vehicles, but also of fuel prices, the price of alternative forms of transport, and income levels. Income is an important factor in determining both the demand for transport in general, and the particular mode of transport a passenger uses.
Table 11.4 gives figures for motoring expenditure, fares and other travel costs for households with different levels of income in the UK in 2008. As one would expect, it clearly shows that travel expenditure increases with income, with those households in the lowest 10% income group having an average weekly expenditure on transport of £12.10 whilst the highest 10% spend £161.10. For all households the average is £63.40.
For rail transport, Family Spending 2008 (ONS 2009) reveals that higher income groups spend more on that mode of travel. As illustrated in Table 11.4, the highest 10% of income earners spent on average £9.00 per week on rail and tube fares compared to an average for all households of £2.40. For bus travel, however, the highest 10% of income earners only spend £1.60 per week on bus and coach fares compared to an average for all households of £1.40, leading one to suggest that bus and coach travel can be viewed in economic terms as an inferior good.
Predicting the demand for transport in the future is a difficult process, since it depends on how the variables affecting demand change over time. For example, forecasts in terms of car ownership predict it to increase by 46% between 1996 and 2031. As Table 11.5 reveals, however, we have not yet reached saturation level in terms of car ownership, for there are still 24% of households who do not own a car.
With regards to forecasting car ownership, the Department of Transport used the National Road Traffic Forecasts 1988 to make the following observation:
Many factors are likely to influence the growth of car ownership and use. They include income, the cost of buying and running cars, journey requirements (work and non-work), quality of public transport services and the way people’s expectations and preferences about car ownership
Table 11.4 Detailed household expenditure by gross income decile group, 2008
| Lowest 10% | Second decile group | Third decile group | Fourth decile group | Fifth decile group | Sixth decile group | Seventh decile group | Eighth decile group | Ninth decile group | Highest 10% | All households | |
| Commodity or service | Average weekly household expenditure (£) | ||||||||||
| Transport | 12.10 | 17.10 | 24.10 | 38.90 | 51.90 | 61.0 | 73.60 | 81.90 | 112.20 | 161.10 | 63.40 |
| Purchase of vehicles | 3.40 | 4.70 | 4.90 | 12.20 | 16.60 | 20.10 | 26.30 | 24.70 | 38.0 | 60.60 | 21.10 |
| Purchase of new cars and vans | [0.40] | [1.20] | [0.90] | 5.30 | 5.30 | 7.020 | 8.80 | 6.80 | 8.30 | 22.50 | 6.60 |
| Purchase of second-hand cars or vans | 2.96 | 3.50 | 3.90 | 6.70 | 10.80 | 12.40 | 16.70 | 16.80 | 28.30 | 34.20 | 13.60 |
| Purchase of motorcycles and other | |||||||||||
| vehicles | [0.10] | 0.10 | 0.10 | 0.10 | 0.40 | 0.60 | 0.80 | [1.10] | 1.50 | 3.90 | 0.90 |
| Operation of personal transport | 6.00 | 8.90 | 14.50 | 20.00 | 29.60 | 32.20 | 37.10 | 43.60 | 55.90 | 70.00 | 31.80 |
| Spares and accessories | 0.30 | [0.20] | 1.20 | 1.50 | 3.20 | 1.90 | 2.10 | 2.40 | 5.40 | 5.40 | 2.40 |
| Petrol, diesel, other motor oils | 4.00 | 5.70 | 9.30 | 14.10 | 18.68 | 21.30 | 25.80 | 30.10 | 36.50 | 44.90 | 21.00 |
| Repairs and servicing | 1.40 | 2.40 | 3.10 | 3.50 | 5.20 | 6.80 | 6.90 | 8.20 | 10.30 | 14.70 | 6.20 |
| Other motoring costs | 0.30 | 0.60 | 1.00 | 0.90 | 2.50 | 2.20 | 2.40 | 2.90 | 3.70 | 5.00 | 2.10 |
| Transport services | 2.70 | 3.60 | 4.60 | 6.80 | 5.80 | 8.70 | 10.20 | 13.60 | 18.30 | 30.50 | 10.50 |
| Rail and tube fares | 0.50 | 0.70 | 0.60 | 0.80 | 1.00 | 1.70 | 2.10 | 4.10 | 3.90 | 9.00 | 2.40 |
| Bus and coach fares | 1.20 | 0.80 | 0.80 | 1.70 | 1.2 | 1.80 | 1.60 | 1.70 | 1.30 | 1.60 | 1.40 |
| Combined fares | [0.20] | [0.30] | [0.30] | [0.20] | [0.60] | 1.20 | 1.90 | 1.50 | 2.30 | 3.850 | 1.20 |
| Other travel and transport | 0.80 | 1.90 | 3.00 | 4.00 | 3.00 | 4.00 | 4.70 | 6.30 | 10.70 | 16.20 | 5.40 |
| Source: Adapted from ONS (2009) Family Spending, a Report on the 2004-05 Expenditure and Food Survey. | |||||||||||
214 CHAPTER 11 TRANSPORT
Table 11.5 Households with regular use of cars, 1998-2007.
Percentage of households
| No car | One car | Two cars | Three or more cars | |
| 1998 | 28 | 44 | 23 | 5 |
| 1999 | 28 | 44 | 22 | 5 |
| 2000 | 27 | 45 | 23 | 5 |
| 2001 | 26 | 46 | 22 | 5 |
| 2002 | 26 | 44 | 24 | 5 |
| 2003 | 26 | 44 | 25 | 5 |
| 2004 | 25 | 44 | 25 | 5 |
| 2005 | 25 | 44 | 25 | 5 |
| 2006 | 24 | 44 | 26 | 6 |
| 2007 | 24 | 44 | 26 | 6 |
Source: Department for Transport (2009) Transport Statistics Great Britain 2008.
change over time.... It seems likely that car ownership will eventually reach a limit - or ‘saturation level’ - as a larger proportion of the population acquires cars. Since no country appears to have reached this limit yet, the level of saturation must be assumed. For these forecasts, saturation has been assumed to occur when 90% of the driving age group of 17-74-year-olds owns a car (100% car ownership is unlikely because some people will be prevented or deterred by disabilities or other factors). On this basis, saturation would correspond to 650 cars per thousand people. The forecasts of growth in national car ownership are essentially about the rate and path with which the saturation level is approached. (Goodwin, 1990)
Forecasts of future traffic, particularly the private car, are essential for a central government which has to decide on the allocation of funds for future road development. For, as stated by the Department of Transport in 1989:
Traffic forecasts are important in assessing whether the benefits from a road improvement, over its life-time, justify the initial cost and in determining the standard of provision. They enable a balance to be struck between providing extra capacity before it is needed and the cost of adding to capacity at a later stage. Traffic forecasts also play a part in predicting the environmental impacts of traffic, such as noise and air pollution.
Such forecasts are difficult to determine owing to the high degree of uncertainty about the future and for this reason the basis of the forecasts involves two differing assumptions, namely that of low economic growth and that of high economic growth. The forecasts therefore provide a range of values (‘scenarios’) to cover the uncertainties involved. It is possible, however, for the outcome to fall outside the forecast range, with the Department of Transport being unable to forecast traffic levels accurately. A good example of this was seen with the M25, for which forecasts were undertaken in the 1970s when oil prices were high and economic growth low. This led the Department of Transport to underestimate the likely demand for transport along the route. For example, between 1982 and 1987 they forecast an increase in road traffic of between 9% and 16%, but the actual increase was 22%. The main reason for this was that the forecast assumed a growth of GDP of between 8% and 15% over the five-year period, but GDP actually grew by 18%. Also the price of fuel was forecast to rise in real terms, whereas it actually fell.
Road transport congestion
Congestion costs arise because the addition of more vehicles onto a road network reduces the speed of other vehicles and so increases the average time it takes to complete any particular journey.
It is possible to gain some understanding of congestion by studying the relationship between speed and flow along a particular route. Figure 11.1 shows a speed-flow curve for the movement of vehicles along a particular road. It shows how motorists interact and impose delays and costs on each other. In a free-flow situation (around point A) there is little or no interaction between vehicles, and therefore speeds (subject to the legal speed limit) are relatively high. However, as extra vehicles join the road, average speed is reduced; nevertheless an increased flow will still occur until point B is reached. The flow of vehicles depends upon the number of vehicles joining the road
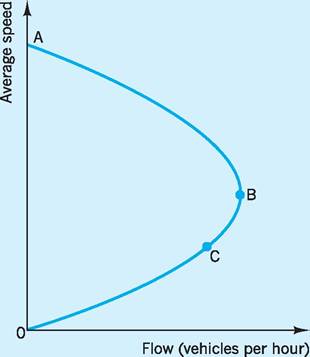
Fig. 11.1 Speed-flow curve.
and the speed of the traffic. For the individual user, maximum efficiency is where the speed is at its highest, i.e. point A. In terms of the system as a whole, however, the maximum efficiency is at point B, before the speed-flow curve turns back on itself (i.e. where the maximum flow of vehicles is achieved). Once at point B, the road is said to have reached its capacity at the maximum flow level. Motorists may continue to enter the road after B because they may lack perfect information, thus slowing down the whole flow. Point C may therefore be used to represent the speedflow situation during a peak period. At this point the traffic is in a stop-start situation, perhaps where the traffic flow is subject to a bottleneck. This gives rise to high external costs which the motorist is not taking into account. These costs will tend to increase the closer the road is to full capacity.
The costs of congestion
It is clear that a major strategy is needed to tackle the congestion problem, not only in urban areas but also on inter-urban routes. Congestion undermines competitiveness and hinders certain conurbations, particularly London, from attracting people and business. It also imposes a financial cost on the business community in terms of increased commuter times and delays in the delivery of goods.
Although somewhat dated, in 1997 the National Economic Research Associates (NERA) estimated the total cost of road congestion to road users to be £7bn. This was split into the cost to business (£2.5bn) and the cost to private motorists, private van drivers and bus passengers (£4.5bn). A more recent estimate, although a decade old, of congestion costs is even more substantial; for example the RAC (2002) has estimated that congestion costs the motorist around £23bn in time losses alone each year. This is approximately £800 per annum for every motorist in Britain irrespective of the extra fuel and wear and tear costs associated with congestion. Whilst estimates of the cost of congestion have been made, the government has admitted that ‘an ideal measure [of congestion] has yet to be identified’ (House of Commons Transport Committee 2003).
Figure 11.2 gives some indication of the causes of congestion. There has been a dramatic rise in the number of licensed vehicles over the period 19512008, made up almost entirely of private cars.
The theory of urban road transport congestion
An economic model can be used to simplify the various issues involved in transport congestion, as shown in Fig. 11.3. The horizontal axis measures the flow of vehicles per hour along a particular route. The vertical axis measures the cost per trip, including time costs. Two demand curves are shown, both of which have a negative slope because it is assumed that motorists will reduce their driving if the cost of driving increases. The demand curve D1 refers to the off-peak demand for the route. It is the aggregate demand of all motorists who wish to use the route. If the cost per trip is C0, and demand is D1, then this will produce a flow of F0 along the route. When making a journey, a motorist is not likely to take account of the congestion cost of that journey and may in fact consider only his or her own marginal private cost (MPC). MPC includes costs such as the price of petrol used and the opportunity cost of the time the motorist spends travelling. There can, however, be costs incurred on other road users which the individual motorist will not take into account. These are ‘external costs’ and include such things as the pollution and noise borne by society as a whole and the congestion borne by other road users. These are shown by the marginal social cost (MSC) curve in Fig. 11.3. For
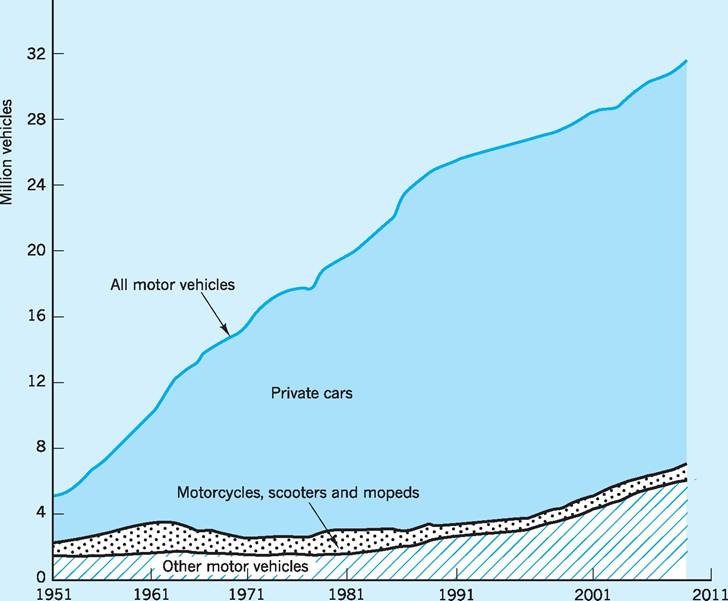
Fig. 11.2 Motor vehicles licensed, 1951-2008.
Source: Adapted from Department for Transport (2009) Transport Statistics Great Britain 2008.

Fig. 11.3 Eq uilibrium traffic flow.
simplicity, Fig. 11.3 assumes that congestion is the only externality; hence MPC is shown as equal to MSC for some range of traffic flow up to F1 because there is no congestion until that flow is reached. (Of course, if we allowed for the pollution which occurs from exhaust gases at low mileage, then MSC would be above MPC at all levels of traffic flow.) If motorists did take into account the social costs of a journey, then they might decide that the journey was not worth making, at least not at that time of day or by that particular route.
In the figure it can be seen that the flow of traffic can increase up to F1 without congestion, because it is possible for the additional cars to enter the road without slowing down any other driver. It can be seen, therefore, that there is no divergence between marginal private cost and marginal social cost. However, at flows above F1, congestion is apparent because additional drivers slow down the overall traffic flow and the individual motorist’s MPC per trip increases. Each motorist is now beginning to interfere with other road users, affecting their costs but ignoring those costs when deciding whether or not to make a particular trip. As the flow of traffic increases beyond F1, there is also a divergence between the MPC and the MSC, as shown in the figure by lines MPC1 and MSC1 (MSC is equal to MPC plus the social cost of congestion). This is brought about mainly through increased travel times, as each additional driver entering the road imposes an extra delay (perhaps only small) on every other driver. If the demand for the route at the peak period is of the normal shape D2, then the traffic flow will be F2. Here F2B will be the (private) cost per trip to the motorist, and the external costs which the motorist has not taken into account will be equal to AB. At a flow of F2 there is therefore allocative inefficiency, as the ‘real’ or social cost of congestion has not been accounted for by the private motorist.
Policy options for urban road congestion - demand policies
There are various policies which have been designed to improve the use of existing road capacity. These include policies which can be introduced to influence the demand for road space; there are also policies designed to expand road capacity, which can be viewed as supply-side policies. These various policies will be covered in this section. However, at this stage it is also worth mentioning that there is a ‘laissez- faire’ approach which is an alternative solution for permitting an equilibrium level of road transport congestion to emerge. For instance, if congestion gets ‘too bad’ in a particular region, then it may persuade companies and individuals to move to less prosperous regions which do not have the same level of congestion. The problem with this ‘laissez-faire’ approach is that the transport network may be operating at, or near, full capacity at certain times, and therefore even small fluctuations in demand can cause long delays and create problems for safety.
Road user charging
When undertaking a journey, each driver is comparing the private benefit of each trip with the private cost of each trip. Drivers will add their vehicles to the flow whenever their marginal private benefit exceeds their marginal private cost. New roads could be built to meet the demand during the peak period, or demand could be restrained, or a mixture of the two policies could be undertaken. In Fig. 11.3 above, the flow of F3 could be achieved by placing a charge of CD on the road user, so raising marginal private costs from MPC1 to equal those of MSC1; this would thereby reduce the traffic flow from F2 to F3. This road user charging option would bring about a ‘more efficient allocation’ of a scarce resource, because the marginal private benefit (as measured by the demand curve) is now equal to the marginal social cost curve. Road user charging is an option which is gaining in popularity.
D. Newbery has commented that ‘As road space is a valuable and scarce resource, it is natural that economists should argue that it should be rationed by price - road-users should pay the marginal social cost of using the road network if they are to make the right decisions about whether (and by which means) to take a particular journey, and, more generally, to ensure that they make the correct allocative decisions between transport and other activities’ (Newbery 1990).
Road user charging was suggested as a possible solution to the urban congestion problem as long ago as 1964, when the Ministry of Transport produced the Smeed Report. Road user charging could be introduced by using meters attached to cars in the form of an electronic numberplate. As a car entered a congested area or stretch of road, the meter would be activated by sensors in the road. A charge would then be registered. As well as dissuading the marginal car user from using the road, it would also provide the authorities with revenue which could be used to construct more roads or to improve the public transport system. The government has recognized this and the Transport Bill (2000) included powers to enable local authorities outside London, if they wanted to, to introduce road user charging and/or a workplace parking levy (see below) as part of their local transport plan. Such powers had already been given to London’s mayor and the Boroughs through the Greater London Authority Act 1999.
On 17 February 2003 in London the Mayor, Ken Livingstone, launched the first major congestion charging scheme in Britain, a scheme to charge motorists for the use of the road network within a specified area of Central London between certain times, the aim of the scheme being to reduce congestion. It forms one of only a small number of charging schemes worldwide, the Singapore Electronic Road Pricing scheme being the other main example.
The UK is one of the most congested countries in Europe and London one of the most congested cities. Average vehicle speeds in London have declined over time since 1974, falling from 22 km per hour 30 years ago to as little as 15 km per hour in the central and inner areas of London. This reduction in average speeds has been experienced in both the morning and evening peak periods with, perhaps surprisingly, the daytime off-peak period in Central London being most congested of all (in terms of lowest vehicle speeds). Clearly this is something the London authorities, namely Transport for London, have been keen to address and average speeds have increased by over 2 km per hour following the introduction of congestion charging.
Congestion charging originally covered 21 square kilometres of Central London, although the zone was extended westward in 2007. In October 2010, however, it was announced by the current Mayor that the Western Extension of the Congestion Charging Zone would be removed from January 2011. Motorists entering the zone between the hours of 7.00 am and 6.00 pm, Monday to Friday (excluding public holidays), are charged £8, increased to £10 in January 2011. In the financial year 2005/06 the scheme generated £122m in net revenue. This increased to £148m in the financial year 2009/10 and has been used to invest in improving transport in London.
Enforcement
Enforcement of the scheme is via 700 video cameras, which are able to scan the rear numberplate of the vehicles that enter the zone. Each evening the information obtained is matched against a database of motorists who have paid the charge. Payment can be made by phone, using the Internet, at shops or at petrol stations. If the motorist has failed to pay the charge before midnight, a fine of £120 is imposed. If the offender pays within 14 days, then the fine falls to £60.
Exemptions
A number of exemptions have been built into the scheme.
■ Certain listed vehicles receive a 100% discount - this includes all alternative fuel vehicles, namely gas, electric and fuel cell vehicles, which are exempt on environmental grounds. Blue and orange badge holders are also exempt; that is, vehicles driven by disabled people. In addition, certain NHS staff, patients and emergency vehicles (fire engines, police vehicles and ambulances) have been brought within this category. Certain other vehicles are also exempt, such as those with more than nine seats and military vehicles used by the armed forces.
■ Residents within the charging zone are eligible for a 90% discount.
■ Motorbikes and mopeds, black cabs and London- licensed mini-cabs are also exempt.
According to Transport for London there has been a 6% increase in bus passengers during the charged hours although congestion has risen to the pre-charging levels. It would, however, have been much worse without the charges.
The scheme utilizes a rather simplistic technology, namely cameras on all the roads into the central area. It also incorporates a fixed price of £10, the charge not changing in line with the level of congestion experienced. As we noted in Chapter 10, the ‘pure’ environmental tax (Pigouvian tax) would equal the marginal external damage and would therefore rise as the marginal external damage increases (e.g. at peak time). The current fixed charge may, however, be changed to a variable charge as the scheme evolves. For example, the scheme might use global positioning satellites (GPS) and cars fitted with satellite receivers in order to allow the charge to vary with distance, time and location.
One of the criticisms levelled at road user charging is its effect on increasing the inflation rate. However, if it succeeds in reducing the total costs of commercial activities, then this is a false worry. Road user charging should not be viewed as a revenue maximizing charge, but as an efficiency maximizing charge. It could then be the key to medium-term relief from congestion and could provide the funds for the longterm upgrading of roads and public transport.
In addition, there are a number of problems to be addressed when considering the implementation of a road user charging policy. First, there need to be accurate estimates of elasticities of demand and of marginal external costs. Second, the issue of equity and the problem of practically implementing the scheme both need to be considered. For example, what charge should be made for congestion and how would it vary depending on the level of traffic and the time of day? Third, road user charging could be seen as an invasion of privacy.
Subsidizing public transport
Another approach designed to shift the demand to the left in Fig. 11.3 is subsidizing public transport. This method was used in the 1970s by a number of UK metropolitan councils. For example in Sheffield, bus fares were reduced by 55% in real terms over the period 1975-81. In addition to financial implications, the problem faced by this method is in persuading car users to transfer from private to public transport, since they often perceive themselves as being the victims of congestion rather than the cause of it. To be successful, this policy requires a long-term improvement in public transport and a cross-elasticity of demand between public and private transport substantially greater than zero. An added problem is that increased income levels lead to increased car ownership, thus lowering the demand for public transport, as stated above in the section ‘The demand for transport’. The public transport sector therefore becomes more reliant on certain groups of travellers, namely the young, the elderly and those on low incomes.
Parking restrictions
One policy which has been extensively used in urban areas since the 1960s is parking restraints. The aim has been, through parking meters and restrictions on on-street parking, to limit the supply of parking spaces, so reducing the demand for urban routes. This policy, too, has limitations in that removing parking facilities from a road essentially increases the size of the road and may therefore encourage extra traffic flows. At the same time, parking restraints encourage illegal parking which may add to congestion. This is one of the main reasons for the introduction of wheel clamps in Central London in 1986 and policies such as the tow-away scheme introduced in Cambridge in 1991, subsequently abandoned in 1996 given its unprofitability.
City Councils have sought to use pricing policies at their car parks to encourage shopping and other short-stay motorists, while at the same time discouraging long-stay commuters. However, the success of this policy has been hindered to some extent by their lack of control over privately operated car parks and by high volumes of through traffic in most congested areas. Parking charges are also unable to discriminate between length of journey or route taken. Pricing policies could be used to encourage motorists to park at peripheral, out of town, car parks that are part of park-and-ride schemes, which are now operating in many British cities.
The lack of control over private parking was addressed by the Transport Bill (2000) which gave local authorities the power not only to introduce road user charging but also to levy a mandatory charge on workplace parking across all or part of their area. The levy would act as a licence fee with the owners or occupiers of premises applying to the traffic authority for a licence stating the maximum number of vehicles that would be parked on their premises at any one time. A workplace parking charge per vehicle would then be multiplied by that maximum number. The aim is ‘to reduce the amount of free workplace car parking available as a means of reducing car journeys and promoting greater use of alternative modes’ (Department of the Environment, Transport and the Regions 1998). It is intended that the levy would act as an incentive for occupiers of property to reduce the total number of parking spaces, restricting the maximum number of vehicles for which a licence is sought. As with road user charging there are a number of issues which need to be addressed. These include the need for complementary policies to be adopted, such as the introduction or strengthening of existing on-street parking restrictions and the adjustment of tariffs for both on- and off-street parking
Table 11.6 Cross-elasticity of demand between parking price and purpose of journey using public transport.
| Journey purpose | Number of trips | Kilometres |
| Commuting | +0.02 | +0.01 |
| Business | +0.01 | +0.00 |
| Education | +0.00 | +0.00 |
| Other | +0.04 | +0.02 |
| Total | +0.02 | +0.01 |
Source: OECD: Contract No. RO-97-SC-2035.
outside the workplace to levels consistent with those applied to workplace parking. There is also the problem of which premises or vehicles should be exempt, if any, and what the exact parking levy per vehicle should be in order to achieve the desired objective. To date, only Nottingham City Council has seriously considered the introduction of a workplace parking levy as a means of reducing congestion. At the time of writing, Nottingham city council intend to charge for workplace parking from 1st April 2012.
Transport for London (2004) gave cross-elasticity estimates between the price of parking and the demand for public transport for various types of journey. This can be seen in Table 11.6 and reveals close to zero cross-elasticities of demand between the price of parking and all types of journey, whether expressed in terms of number of trips or kilometres travelled.
Limiting car ownership and use
Further ways of influencing the demand for road space include:
■ Limit on car ownership. This could be achieved by imposing either import restrictions, a registration tax or a system of rationing on cars. As yet, this is not something which has been advocated in the UK, but it does occur in certain parts of the world, not only to deal with traffic congestion but also to save energy. For example, in Singapore a quota system is in operation where vehicle owners tender for a ‘certificate of entitlement’ without which they cannot own a vehicle. (See www.lta.gov.sg for a more detailed explanation.)
■ System of car sharing. If successful this would also shift demand to the left in Fig. 11.3.
■ Increase in road fuel duty. This was introduced by the Chancellor of the Exchequer in the March 1993 budget. The road fuel duty was increased by 10% and it was announced that in future budgets the duty would be increased, in real terms, by at least 3%, though this was subsequently abandoned after the fuel price protests of 2000.
Policy options for urban road congestion - supply policies
As well as demand policies to deal with the urban road congestion problem, supply-side policies (such as new road building) can be implemented. An urban road building strategy can be examined by the use of Fig. 11.4.
Increasing the number of lanes, or building new roads, will shift the marginal private cost and marginal social cost curves from MPC1 and MSC1 respectively, to MPC2 and MSC2. The diagram implies that before the road capacity was expanded, congestion occurred beyond a traffic flow of F1, but now occurs at a point beyond F4. The reason for this is that road construction increases road capacity, so that an increased flow is now possible before the costs of congestion appear. If demand is taken to be D2, then a flow of F5 will now use the road, and although there will be some congestion (note that MSC2 is greater than MPC2 at F5 by the distance GH) this will be somewhat less than the congestion before the new road expansion, which was AB in Fig. 11.4.
There is, however, a limitation with this strategy. If the road network is expanded and improved, then individuals who previously used public transport may now begin to use their own car. New traffic will therefore be generated, as those who did not make a particular trip previously are now encouraged to do so, and motorists who travelled via a different route may now be persuaded to use the route(s) in question. Also peak and off-peak travel can, to some extent, be viewed as substitutes, so that off-peak travel may fall. It could therefore be argued that increasing a road’s capacity will result in more vehicles using the route, i.e. a case of supply generating its own demand. This means that the level of demand may well be underestimated. In fact, demand could become almost perfectly elastic, as with demand curve D3 in Fig. 11.4. If this were to be the case, then the flow of traffic along the particular route would be F6 and not F5, and the social cost which had not been taken into account
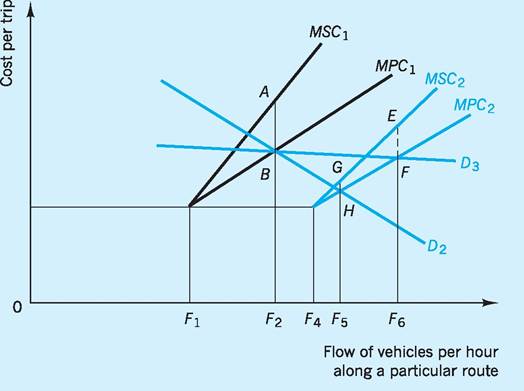
Fig. 11.4 Eq uilibrium traffic flow: supply-side policies.
would be EF and not GH. The final situation may not, then, be significantly different from the initial external cost of AB in Fig. 11.4. In other words, a similar congestion problem would still persist.
I Government transport policy
In July 1998 the government published a White Paper on the Future of Transport entitled ‘A New Deal for Transport: Better for Everyone’ in which it was recognized that there was a need to improve public transport and reduce car dependency. As such, a commitment was made to create an improved integrated transport system more able to tackle congestion and its associated pollution. The main aim of the White Paper was to ‘increase personal choice by improving the alternatives and to secure mobility that is sustainable in the long term’. There was a recognition that road building (‘predict and provide’) was not the answer to the growth in traffic.
The 2007 White Paper entitled ‘Towards a Sustainable Transport System, Supporting Economic Growth in a Low Carbon World’ (Department for Transport 2007) continued the theme by stating that transport has a vital role to play in supporting sustainable economic growth, whilst playing its part in reducing carbon emissions. The White Paper was in essence a response to the Eddington study (2006), which dealt with how to improve transport’s contribution to economic growth and productivity, and the Stern Review of the Economics of Climate Change (Stern 2007) which dealt with how transport would play its part in delivering reductions in carbon emissions.
Over the years, the state has attempted to influence transport in a number of ways, concerning quality, quantity, ownership and resource allocation.
Quality
This has been concerned mainly with safety. In 1930 the Road Traffic Act was introduced, which required both bus operators and freight hauliers to license their vehicles with regional Traffic Commissioners. This policy was viewed, essentially, as one of protecting the public interest. This follows from the fact that, for both the road haulier and the bus operator, the capital costs of vehicle purchase are relatively low, so that there is a low barrier to entry into the industry. As a result, profits can be driven down, which in turn could lead to operators trying to reduce their costs, with possibly adverse effects on safety standards. In recent years there have been a number of transport disasters, and this has clearly made the whole area of transport safety a major political issue. An important question is whether increased competition will lead to reduced safety standards!
Quantity
The licensing system has also been used as a form of regulatory control. Successive governments have been of the opinion that quantitative controls on transport were necessary in order to make sure that existing capacity was fully utilized. Such controls have applied to the road haulage and bus industries. One of the implications of licensing has been the crosssubsidization of bus services. Until 1986, the provision of unprofitable services was closely linked to the granting of licences for route monopolies by the traffic commissioners. Although certain services, such as late evenings, weekends and certain rural routes, were unprofitable, they were viewed as being ‘socially’ worthwhile. The financial losses on such routes were supported from the profits which the operators earned on the more profitable routes, so that crosssubsidization clearly took place. However, crosssubsidization was possible only as long as operators had monopolies; with a deregulated bus sector this was less likely.
Ownership
In the past, railways and parts of the road haulage and bus passenger transport sector have been under public ownership. The main reasons put forward for such ownership include the suggestion that if the subsidization of such services was needed, then it would be easier for the government rather than private companies to control that particular operation. Government control would also allow for improved coordination of services. The government’s stance on state ownership has changed, however, in the past 30 years, as with the sale of the National Freight Corporation to its employees in 1982, and of the National Bus Company following the deregulation of the bus industry in 1986 and the franchising of rail services.
Resource allocation
A major area of direct government involvement in the transport sector concerns the large amounts of public expenditure invested in the transport sector.
In the government’s Comprehensive Spending Review, October 2010 (see http://www.dft.gov.uk/ about/spendingreview) there was a commitment to reducing the deficit while facilitating long-term sustainable growth and addressing carbon emissions. As such, the Spending Review saw the DfT’s budget cut by 15% in real terms over the period 2010/11 to 2014/15, with capital funding cut by 11% and the revenue budget cut by 21%. The DfT stated that this would involve the following.
■ Efficiency - with savings delivered through ‘better procurement and management contracts, improved delivery of front line services, savings in rail costs and reduction of lower priority programmes’ (Department for Transport 2010).
■ Refocusing lower priority programmes - which involves making savings through reducing expenditure on lower priority areas, some of which would involve DfT marketing and research activity.
■ Revenue raising - which involves an increase in the cap on rail fares as well as an increase in the charge to undertake the Dartford crossing. The increase in rail fares is intended to provide investment for important new projects including rolling stock, aimed at reducing overcrowding. The increase in the Dartford crossing charge is aimed at providing funds to assist in an additional crossing.
■ Secure investment in terms of -
■ £18bn of rail investment;
■ £4bn on Highways Agency projects, capital maintenance and enhancements;
■ £6bn on local transport projects, capital maintenance and enhancements;
■ funding for additional PFI projects; and
■ funding for tube upgrades.
It is intended that both passengers and motorists will benefit from the investment, as will the economy through economic growth.
■ Localism - in that the government wants to devolve power and greater financial autonomy to local authorities. The idea is that greater local control, participation and accountability is an effective means by which sustainability of local transport systems could ‘promote economic growth, minimise the environmental impact of travel, improve public health and address social exclusion’ (Department for Transport 2010).
■ Sustainability - via priority spending on rail projects which are viewed as sustainable, such as High Speed Rail and Crossrail and ultra low carbon vehicles.
Government intervention in the transport sector, characterized by state monopolies, public ownership and investment based on state priorities, can be contrasted with a ‘laissez-faire’ approach. The latter involves leaving the sector to the workings of the free market, with quality, quantity and resource allocation being determined by consumer preferences. In a ‘pure’ laissez-faire situation, transport services are provided by privately owned firms and the finance of those services is based on customer fares. In this free market, there would be no statutory control on entry into the sector and no financial support for those operators facing difficulties. However, the transport sector has not been left to the free market, for many of the reasons mentioned above, although there has been a move in recent years to allow certain parts of the transport sector to operate in a ‘freer’ market. This has been the case with the private financing and construction of the Channel Tunnel, the deregulation of the bus industry and the private financing of road construction, such as the M6 toll road. There is now a general consensus that road supply cannot realistically be expanded sufficiently to meet demand. The need for demand management policies has therefore become widely accepted, and these will become an increasingly important part of any government’s transport policy in the foreseeable future.
Deregulation of the bus industry
Prior to 1930, the local urban and rural bus industry operated in a competitive market structure with no government regulation. There was fierce competition between rival bus companies (using surplus war vehicles) and this period was associated with a high number of accidents, unscheduled and irregular intervention by ‘pirate’ operators at peak times, and other types of wasteful duplication.
It was for these reasons that, in 1930, the Road Traffic Act was introduced, which was to form the basis of bus industry regulation for 50 years. Under the Act, Traffic Commissioners were responsible for the issue of road service licences (a licence being required for each route operated), the quality of vehicles and the level of fares.
The period 1930-80 was therefore a restrictive one for the local bus service industry. A comprehensive public transport network was provided under a protectionist system, with a licence acting as a barrier to entry, since a licence gave the operator a monopoly on a particular route for the duration of the licence. In 1930 the industry was dominated by private bus operators but, as it developed, the state took a progressively larger role, as with the formation in 1968 of the National Bus Company (NBC) and the Scottish Bus Group (SBG). This meant that by 1986 the industry consisted of state-owned operators, the local authority sector and independent companies which mainly operated in the contract hire sector (including school bus provision).
Changes were regarded as necessary by the mid- 1980s. There had been a steady decline in patronage, with bus and coach passenger travel falling from 42% of total travel in 1953 to 8% in 1983. The growth in the use of the private car, fare increases in excess of the inflation rate, increased operating costs and the decline in services were seen as the chief reasons for the decline in bus/coach travel.
The 1984 White Paper on Buses stated:
The total travel market is expanding. New measures are needed urgently to break out of the cycle of rising costs, rising fares, reducing services, so that public transport can win a bigger share of this market. We must get away from the idea that the only future for bus services is to contract painfully at large cost to taxpayers and ratepayers as well as travellers. Competition provides the opportunity for lower fares, new services, more passengers. For these great gains, half measures will not be enough. Within the essential framework of safety regulation and provision for social needs, the obstacles to enterprise, initiative and efficiency must be removed.
The White Paper led to the 1985 Transport Act, through which (by October 1986) road service licensing requirements were abolished outside London. Provision was also made in the Act for the privatization of the National Bus Company. The Passenger Transport Executives operating in metropolitan areas were to be converted into independent companies, still owned by the local authorities, but those authorities now had the option to privatize them. Local bus operators had to register their routes and times and to give sufficient notice of withdrawal of services. There was also the introduction of competitive tendering for the unprofitable bus routes.
So the main objective of the 1985 Act was to introduce competition into the bus sector, providing the opportunity for independent bus operators which did not offer licensed services before 1986, now to do so. It was envisaged that there would be a number of benefits from deregulation:
1 increased competition, allowing greater choice for the consumer and providing a service which is more responsive to the preferences of the consumer;
2 a closer relationship between bus operating costs and the fares charged, the reason being the ending of cross-subsidization, whereby certain routes were overcharged in order to subsidize non-profitable routes - this was helped, of course, by the freedom of entry for new operators after 1986, which in principle should compete away any ‘monopoly profits’ from charging excessive fares on routes, unrelated to costs;
3 providing a greater potential for innovation in bus travel under deregulation, which was less likely in the absence of competition - one such innovation following deregulation has been the introduction of minibus services;
4 a reduction in the subsidies obtained by bus operators to undertake unprofitable services - the revenue support from government had increased from £10m in 1972 to £529m in 1982, and it could be argued that such subsidies created a protective wall behind which bus operators could operate inefficient services.
There were, however, reservations as to the likely success of bus deregulation, most notably the view that it could lead to a wasteful duplication of services on the profitable routes, especially at peak periods, with a resulting increase in the level of congestion in a number of urban areas. Further, it was feared that the intended reduction in the level of subsidy to the bus sector after deregulation might lead to a rise in the level of fares, thereby diminishing bus use.
Bus services since deregulation
In terms of local bus services in England (outside London), there has in fact been an increase in annual bus kilometres travelled. In 1985/86, the year before deregulation, 1,423 million bus kilometres were undertaken, whereas by 2006/07 around 2,190 million bus and coach vehicle kilometres were recorded (Department for Transport 2009).
Although there has been an increase in bus kilometres travelled since deregulation, there has also been a decrease in passenger journeys in England from 4,808 million in 1985/86 to 4,470 million in 2006/07, a decline of 7%. There is little doubt that deregulation has been a contributing factor to the decline in bus use by passengers in the period following deregulation. One reason, at least immediately after deregulation, is the confusion which passengers experienced due to the changes in service times, routes and operators resulting from deregulation. Higher fares may also have played a part in the reduction in passenger journeys. In Great Britain between 1995 and 2008/07, local bus fares increased by 76.2%, whereas the RPI increased over the same period by only 44.1%.
Airline operations and the growth of low-cost carriers
In recent years there has been a dramatic growth in air travel. This can be seen in Table 11.7 which shows traffic at selected UK airports over the past 10 years. The table reveals a growth at airports such as Luton and East Midlands of 143% and 154% respectively.
Air traffic is forecast to grow rapidly, as illustrated in Table 11.8. Clearly any forecasts have an element of uncertainty; however, even the low forecasts envisage terminal passengers increasing by 60% and 80% for international and domestic passengers respectively between 2010 and 2030.
One of the contributors to air traffic growth in the UK has been the growth in low-cost air travel in terms of passenger numbers, the number of airline operators and the number of airports they operate to and from. There are a number of low-cost operators
Table 11.8 UK forecasts of air traffic demand, terminal passenger traffic 2005-20.
| 2010 | 2020 | 2030 | |
| International | |||
| Low | 200 | 250 | 320 |
| Mid | 210 | 290 | 235,360 |
| High | 210 | 300 | 261,385 |
| Domestic | |||
| Low | 50 | 70 | 90 |
| Mid | 50 | 70 | 90 |
| High | 50 | 70 | 100 |
Source: Adapted from Department for Transport (2009) Transport Statistics Great Britain 2008.
Table 11.7 Terminal passenger traffic (arrivals and departures) at selected UK airports, 1994-2008.*
Millions
| 1998 | 2000 | 2002 | 2004 | 2006 | 2008 | |
| Gatwick | 29.0 | 31.9 | 29.5 | 31.3 | 34.1 | 34.2 |
| Heathrow | 60.4 | 64.3 | 63.0 | 67.1 | 67.3 | 66.9 |
| Luton | 4.2 | 6.1 | 6.5 | 7.5 | 9.4 | 10.2 |
| Stansted | 6.8 | 11.8 | 16.0 | 21.0 | 23.7 | 22.3 |
| Birmingham | 6.6 | 7.5 | 7.9 | 8.8 | 9.1 | 9.6 |
| East Midlands | 2.2 | 2.2 | 3.2 | 4.4 | 4.7 | 5.6 |
| Manchester | 17.2 | 18.3 | 18.6 | 21.0 | 22.1 | 21.1 |
*All traffic: domestic and international.
Source: Adapted from Department for Transport (2009) Transport Statistics Great Britain 2008.
in the UK, most notably Ryanair, easyJet, bmibaby, Thomsonfly and MyTravelLite, and a cursory glance at the website of any low-cost operator indicates the range of origins and destinations served. For example, take the destinations served by two of those low-cost operators from one airport, namely East Midlands, in 2010: Ryanair serves 32 destinations from East Midlands Airport and bmibaby serves 28 destinations.
The growth in low-cost air travel has been remarkable. For example, a news release by Ryanair on November 2010 stated that the number of booked passengers in October 2010 alone was 7 million, up from 6.2 million in October 2009, a 14% increase. In the 12-month period to October 2010, the total number of booked passengers on Ryanair was 72.5 million.
This growth in low-cost airline operations has been based on employing a number of strategies in order to maintain a tight hold on costs. Such costreducing strategies include:
■ operating with only one type of aircraft in order to obtain economies in terms of aircraft maintenance and flexibility in terms of crew utilization;
■ operating a single class with no business or first-class seats, thus allowing more passengers to be carried;
■ selling tickets via the Internet which leads to cost saving as a result of avoiding travel agents’ commission;
■ e-ticketing, which dispenses with the need to print airline tickets;
■ utilizing aircraft more efficiently by:
■ using less-congested secondary airports, allowing for faster turnaround times;
■ not carrying cargo, which takes time to load and unload;
■ not providing on-board catering;
■ not providing seating allocation.
A key question is whether the growth in low-cost travel can be sustained or whether low-cost operators will need to look for new markets. To some extent this search for new markets is already happening, with operators looking to operate from a wider range of airports to a wider range of destinations.
This growth in air travel has many implications, not least the issues of environmental sustainability and climate change already addressed in Chapter 10.
Conclusion
This chapter has attempted to identify, and analyse, a number of the current issues facing the transport sector, notably road congestion and the role of the state in transport provision. Transport, as a derived demand, is an important sector of the UK economy. In 2008 total household expenditure in the UK was £471.00, of which transport comprised £63.40, the largest category.
The period 1997-2007 saw an 11.4% increase in the demand for passenger transport and this is expected to continue, with the car dominating. Income has been viewed as a major factor in determining that demand and its future growth. Forecasting the future patterns of demand is seen as essential for governments when deciding on the allocation of funds to possible new road or airport developments. The increased reliance on the car has created a major problem of congestion, particularly in urban areas, and in recent years this has become more of a political issue. A number of possible solutions have been examined, originating from both the supply and demand sides. On the supply side, it is clear that it is not possible to provide sufficient road capacity to meet the likely growth in demand. Demand needs therefore to be ‘managed’, and demand-side policies have been extensively used. Road user charging is viewed by many to be the best method of dealing with the congestion problem, albeit part of a package of measures.
The public sector plays an important role in the transport sector, as regards both its expenditure on such aspects as the national roads system and its ownership of parts of the sector. The last 30 years have, however, seen a move towards a transport sector operating in a ‘freer’ market. Major parts of the sector have been privatized, the bus industry has been deregulated and there has been increased privatesector involvement in the provision of the transport infrastructure. This chapter has sought to examine the possible reasons for this move towards a free-market sector, together with the likely advantages and disadvantages. It has also made reference to air travel and to the increasingly important low-cost carriers.
Key points
■ In the 1950s only 25% of passenger journeys were by car; today the figure has risen to over 80%.
■ Transport is a service which is a derived demand, with important peak and off- peak characteristics.
■ Transport, particularly road transport, is a major source of pollution and of other externalities, e.g. congestion.
■ A speed-flow curve is a useful means of analysing congestion.
■ The RAC estimates that congestion costs the motorist in the UK around £23bn in lost time per annum.
■ Policy options to deal with congestion are various. Those involving demand include road user charging, subsidies to public transport, parking restrictions and limits to car ownership. Those involving supply include more extensive and better integrated transport networks.
■ Passenger air traffic has grown dramatically over recent years, especially via the low-cost carriers.
Now try the self-check questions for this chapter on the Companion Website. You will also find useful links to relevant websites.
References and further reading
Button, K. (2010) Transport Economics (3rd edn), Cheltenham, Edward Elgar.
Department for Transport (1989) National Road Traffic Forecasts, London, HMSO.
Department for Transport (2004) The Future for Transport: a Network for 2030, London, The Stationery Office.
Department for Transport (2006) Transport Statistics Great Britain 2005, London, The Stationery Office.
Department for Tansport (2007) Towards a Sustainable Transport System: Supporting Economic Growth in a Low Carbon World, October, London.
Department for Transport (2009) Transport Statistics Great Britain 2008, London, The Stationery Office.
Department for Transport (2010) Government Comprehensive Spending Review, available at: http://www.dft.gov.uk/about/spendingreview (accessed February 2011).
Department of the Environment, Transport and the Regions (1998) A New Deal for Transport: Better for Everyone, Cm. 3950, London, The Stationery Office.
Department of the Environment, Transport and the Regions (2000) Transport 2010: The 10 Year Plan, London, The Stationery Office.
Department of Transport (1984) Buses, Cmnd 9300, London, HMSO.
Eddington, R. (2006) The Eddington Transport Study: The Case for Change, London, HM Treasury.
Glaister, S. (2009) Motoring Towards 2050, Roads: A Utility in Need of a Strategy? London, RAC Foundation, 11 June.
Goodwin, P. B. (1990) Demographic impacts, social consequences, and the transport debate, Oxford Review of Economic Policy, 6(2): 76-90.
House of Commons Transport Committee (1993) Fourth Report, The Government’s Proposals for the Deregulation of Buses in London, London, HMSO.
House of Commons Transport Committee (2003) First Report of Session 2002-03 Urban Charging Schemes, HC390-I, London, The Stationery Office. NERA (1997) The Costs of Road Congestion in Great Britain, NERA Briefing Paper, New York, National Economic Research Associates.
Newbery, D. M. (1990) Pricing and congestion: economic principles relevant to pricing roads, Oxford Review of Economic Policy, 6(2): 22-38.
ONS (2009) Family Spending, a Report on the 2004-05 Expenditure and Food Survey, London, Office for National Statistics.
Page, S. (2009) Transport and Tourism: Global Perspectives (3rd edn), Harlow, Financial Times/ Prentice Hall.
RAC (2002) Motoring Towards 2050, May, London.
Schmidtchen, D., Koboldt, C., Helstroffer, J., Will, B. and Haas, G. (2010) Transport, Welfare and Externalities, Cheltenham, Edward Elgar.
Stern, N. (2007) The Economics of Climate Change: The Stern Review, Cambridge, Cambridge University Press.
TRACE (1999), Elasticity Handbook: Elasticities for Prototypical Contexts, Costs of Private Road Travel and Their Effects On Demand, Including Short and Long Term Elasticities, Report to the European Commission, Directorate-General for Transport, Contract No: RO-97-SC.2035.
Transport for London (TfL) (2004) The Demand for Public Transport: a Practical Guide, TRL Report, London.
Transport for London (2006) Central London Congestion Charging, Impacts Monitoring, Fourth Annual Report, London.