Population Distribution of the City of Poltava in the Second Half of the Eighteenth Century by Age, Sex, and Marital Status
IURII VOLOSHYN
The study of any local community calls for an analysis of its main demographic characteristics, which include the sex, age, and marital structure of the population.
By sex structure is meant the division of the population into male and female; by age structure, the distribution of the population by age groups; and by marital structure, the breakdown of the population by marital status.1Sources
Researchers consider the most representative sources for establishing the above indicators in a premodern society to be documents of a record-keeping nature, which include materials consisting of fiscal and ecclesiastical registers of the population.2 Since so far scholars have not found the ideal source that would allow us to study the demographic parameters of the population of Poltava in the second half of the eighteen century, I will use both types of record-keeping sources in my study. For the necessary information, I will turn to the city's census book for the years 1765-66, which was compiled in the course of a fiscal survey - the General (Rumiantsev) Census of Little Russia (1765-69 )3 - and the confessional lists of Poltava churches for 1775,4 which were church registers.
The idea to conduct a general census in the Hetmanate was closely connected with the ideas of cameralism, the Enlightenment, and the concept of a well- ordered state, which Catherine II sought to implement. This idea was realized during the rule of the Second Little Russian Collegium in 1765-69. The census became the most ambitious fiscal document among a large number of population enumerations conducted in the Hetmanate in the eighteenth century. The name “Rumiantsev” came from the fact that the implementation of this idea had been entrusted to the then president of the Collegium of Little Russia, Count Petr Rumiantsev.
The survey contains detailed information about the Hetmanate's cities, towns, villages, and homesteads (khutirs), segmenting their populations according to age, sex, marital status, state of health, and amount of taxes paid; describing church, Cossack, artisanal, and peasant households, and yardless houses (bezdvirni khaty), manorial estates (pidvarky), cultivated land, forests, hayfields, pastures, mills, distilleries, malthouses, and livestock.
In the regimental city of Poltava, the census began on i November 1765 and was completed on 3 February 1766.5 The book containing this data is in the Central State Historical Archive of Ukraine in Kyiv. It is a relatively thick volume, consisting of 390 sheets in folio format. It numbers some 388 pages, most of which are covered on both sides with the cursive script of the eighteenth century.
The text is written in different hands typical of the second half of the eighteenth century, which indicates that several people participated in compiling it. Most likely these people were Vasyl' Boiko, Ivan Drotenko, Ivan Shtepenko, and Artem Tetervak, clerks (kantseliarysty) whom the city administration had assigned to do this job.6 The legibility of the handwriting and the small number of corrections, markings, and notes in the margins indicate that we most probably have before us one of the clean copies of the city census. It is likely that it was among the materials of the survey of the Poltava regiment that the military clerk (viis'- kovyi kantseliaryst) Vasyl' Marchenko submitted to the Little Russia Collegium in June 1770.7
A few important features need to be noted regarding the informational content of the census. First, in view of the announced topic of this article, we obviously have to include among its “flaws” the fact that it did not call for the collection of information about the so-called “new nobility” (Cossack officers; kozats'ka starshyna) and clergy. Consequently, the representatives of these two social groups appear only very indirectly, if at all, in the document.
Second, there is no information about newborns, who, because of their high death rate in traditional society, were not deemed to warrant counting. And the third important flaw, in my opinion, is the inexact representation of age. This conclusion is prompted by the large number of persons, the so-called “jubilee celebrants,” (iuviliary) whose ages ended with the number 5 or 0. My preliminary calculations indicate that they made up the majority of Poltava widows.8The main reason for this was the population’s low level of statistical culture and knowledge of the number of years lived, which was characteristic of early modern society in general,9 and Poltava society in particular. As a result, the Poltavites of the time described their age in approximate terms, usually ending with the number o or 5. The result was, as already noted, a large concentration in the structure of the population under study of people whose age ended with precisely such indicators. According to my calculations, 72 per cent of the city residents in the 25-60 years age group (it numbered a total of 3,311 persons, of whom 2,388 turned out to be “jubilee celebrants”) reported their age in this way during the census of the city in 1765-66.10
One of the most used methods in historical demography that is employed in studying the intensiveness of age heaping by rounding ages to end in 0 or 5 is Whipple’s Index.11 The index score is obtained by multiplying by 100 the ratio of the number of persons ranging in age from 25 to 60 years who report ages ending in o and 5 to one-fifth of the total population between 23 and 62 years inclusive. This index is calculated using the following formula:

If we apply the formula to the data in the Rumiantsev census, Whipple's Index will be: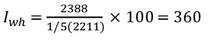
The result is extremely high and indicates that the quality of the data collected by the census takers during the Rumiantsev survey is very poor, with a deviation from the standard recommended by the un (table 13.1) of more than 75 per cent.
Confessional lists were parish documents that recorded the names of parishioners receiving confession. The first steps to introduce these registers on the territory of the metropolitanate of Kyiv were made in the late seventeenth century, but they did not come into active use until the 1720s, as part of the confessional- ization process that was under way in the Russian Orthodox Church at the time. They were maintained more or less regularly in the i73os-qos, when the form of the lists became uniform. The church authorities designated Lent as the time that priests should compile the confessional lists.12
In my study, I will use the confessional lists of the churches of Poltava for 1775. They are part of the confessional lists of the Poltava archpriests (protopopy), which are held in the collection of the Pereiaslav-Boryspil eparchy in the Central State Historical Archive of Ukraine in Kyiv. The book is a large volume, numbering more than 1,200 sheets in folio format, filled with the cursive script of the eighteenth century.
Table 13.1 un Standard for calculating Whipple's Index
| Whipple’s Index | Data quality | Deviation from ideal |
| signature of Father losyp Leontiiev, two different hands are easily discernible. Only the author of the confessional list of the parish of the Church of the Nativity of the Mother of God can be identified with the greatest degree of certainty: he was the priest Mykola Liubych. All we know about him is that he was 62 years old in 1775 and the oldest of the parish priests of Poltava's churches and, as such, he would have known his parishioners well. However, experience and age clearly helped Father Mykola little in compiling the list, because the Whipple's Index for his parish was 170. The most conscientious priest in the city of Poltava was, clearly, Father Matvii Kolosovs'kyi, the pastor of the parish of the Church of the Resurrection. At any rate, Whipple's Index, calculated on the basis of the data collected under his direction, stands at 107, which is considered to be, as is evident from table 13.1, a relatively accurate indicator.Despite the reservations I have expressed here, both types of sources are fairly representative. They can be employed with certain caveats, keeping in mind that they were created in the so-called “pre-statistical” era. The data they contain are partly complementary, which allows us to analyze the sex, age, and marital structure of the population of the city of Poltava in the second half of the eighteenth century. Sex-Age Composition of the Population
where Kfem - is the feminization coefficient for the age group, Wj - is the number of women in the group, and Mi - is the number of men in it. The masculinization coefficient is the reverse to it and is described as:
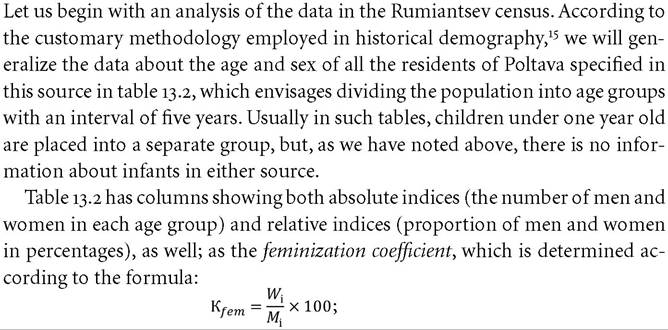
Which of the two coefficients to employ is, in the opinion of the Polish scholar Cezary Kuklo, up to the researcher.16 Because of the preponderance of women in the population, the feminization coefficient is usually used, and I have done so in my study as well. According to my calculations based on the data in this source, Poltava's residents totaled (not counting the Cossack officers and clergy) 6,913 people, of whom 3,576 were women and 3,337 were men. Residents of the city proper numbered 1,555 persons (679 men and 876 women), and the remaining 5,358 people (2,658 men and 2,700 women) lived in the suburbs.17 If we add to them the Cossack officers and the clergy (by my calculations based on the confessional lists, the Cossack officers' microgroup alone totaled 600 people), we can safely conclude that the total population of Poltava exceeded 7,500 people. Women predominated in the sex structure: the overall feminization coefficient was 107; women also prevailed in most of the age groups. In this respect, Poltava was not different from other cities. The preponderance of women in early-modern cities was a common phenomenon both in the Hetmanate and in other European regions. More specifically, according to the Rumiantsev census data, in the regimental city of Starodub the feminization coefficient was 109, in Nizhyn, 101, and in Pereiaslav, 105.18 In Poland's Cracow, in 1792, this coeffi-Table 13.2 Sex-age structure of the population of Poltava in 1765-66 according to the Rumiantsev Census
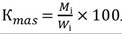
cient measured 104, in imperial Vienna, 109, in France's Marseille, 103, in Russia's Riazan, 105,19 and in England's Southampton, 108.20 This feature was noted even then. For example, Klymentii Zinoviiv wrote: “It seems often two women are left unmarried / While only the third one perhaps may hope to have a husband.” In the poet's opinion, the gender balance was violated, because: “men die on military campaigns”21 According to the data in the confessional lists for 1775 (table 13.3), the sex-age structure of the population of Poltava was similar to what we just described above. Four of six local parishes - those of the Resurrection, Transfiguration, Presentation at the Temple, and Nativity of the Mother of Good churches - had a total population of 3,973 faithful (1,936 men and 2,037 women).22 To them we can add the total number of members of the Saint Nicholas parish, which we know from another source: 2,247 people (1,122 men and 1,125 women).23 The list of the sixth city parish - Dormition Church - has come down to us in poor physical condition, which makes it impossible to determine the exact number of parishioners. However, the data from the surviving pages give us grounds to state that they numbered no fewer than 1,303 people (643 men and 660 women).24 Thus the total number of the residents of Poltava added up to at least 7,523 people (3,701 men and 3,822 women). It appears that the population of the city grew slightly as compared with 1766, but it is doubtful that this increase was substantial, because there were no grounds for an acceleration in the urbanization of the region at that time. There were also small changes in the sex structure: the share of men increased a bit (the general feminization coefficient dropped from 107 to 103). At the same time, in four parishes this coefficient was somewhat higher, measuring 105. As we can see, both sources show that the population of Poltava in the period under study totaled over 7,500 people. Due to the described features of the documents that served as the basis for our calculations, the specified count of the population is not exact. Obviously, the number of residents of Poltava could not have remained unchanged over the ten years that passed between the conduct of the two surveys. On the one hand, there was natural growth (as both tables show, the proportion of children under 14 was fairly high in the total population - 37.7 per cent and 32.4 per cent, respectively). However, we should not forget that not all years of the period under study were favorable for the city. In particular, in 1766, 1773, and 1774, the Hetmanate suffered droughts that resulted in low crop yields, increases in grain prices, and also a rise in the death rate. For example, in 1766, the price of rye flour in the Poltava regiment increased by a factor of 3.7, and the price of oats rose by a factor of 1.8.25 In addition, there was a great fire in Poltava in 1771,26 which would have also affected the count of residents. Today historical demography holds the widely accepted view that in most populations, regardless of historical era, boys accounted for a larger number of births (105-107 to 100 girls), but they were less biologically resistant to disease. Therefore, the death rate among boys during the first year of life was markedly higher. As a result, in the age group under four years old, the number of girls exceeded the number of boys.27 In Poltava, this ratio in 1766 was 112 girls to 100 boys, and in 1775, 105 to 100. The study of the proportion of children (age groups from o to 14 years) and the elderly (over 65) in the general structure of the population provides some information about the extent of population under-recording. The accepted view is that the proportion of children usually approaches 40 per cent and the proportion Table 13.3 Sex-age structure of the population of Poltava in 1775 according to data contained in confessional lists
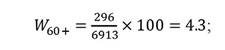
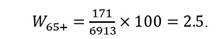
of the elderly should not exceed 3-3.5 per cent.28 In Poltava, both these population groups met these criteria. Thus, according to the Rumiantsev census, children accounted for 37.3 per cent and the elderly, for 2.5 per cent of the population. According to the confessional lists, children made up 32.4 per cent and the elderly, 1.6 per cent of the total number of people. This can be regarded as further corroboration of the fact that the sources used for this analysis are representative. The sex structure of working-age groups of the population (15 to 65 years) was greatly affected by external factors, above all, seasonal and regular migrations (for example, the inflow of female hired workers into the city, which had an effect on the feminization of the city's population), natural disasters (droughts, locust attacks, fires), as well as wars, in which the Cossacks in the Hetmanate were engaged virtually permanently in the second half of the eighteenth century. In the older age groups (over 40 years), men had a numerical advantage (see, for example, the 40-44 age group in table 13.2, and the 45-49 age group in table 13.3), which may have been because of the high mortality rate among women in childbirth. Cezary Kuklo writes: “aging, the number of previous deliveries and born children, in combination with exhaustion from daily hard work, lowered the natural biological resistance of the female organism and made it more vulnerable to various infections and postnatal complications, which often caused the death of the mother.”29 A study of the age structure of the population of Poltava allows us to trace the process of so-called demographic aging. That is what the growth of the proportion of the elderly (over 60 or 65 years) in the overall structure of the population is called.30 To assess the rate of aging, a special coefficient W is calculated using the following formula:
where S60+ and S65+ are the number of people over 60 years old and over 65 years, respectively, and S is the total number of people. In Poltava, according to the Rumiantsev census, the demographic aging coefficient for people over 60 years old was:
and for the group of over 65 years, it was:
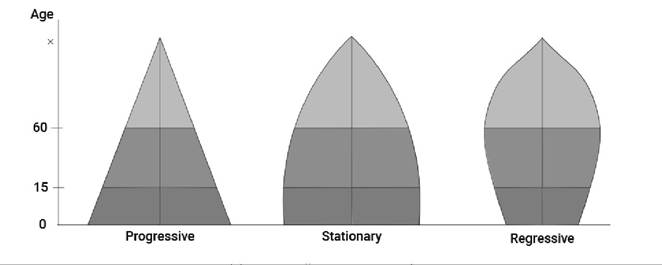
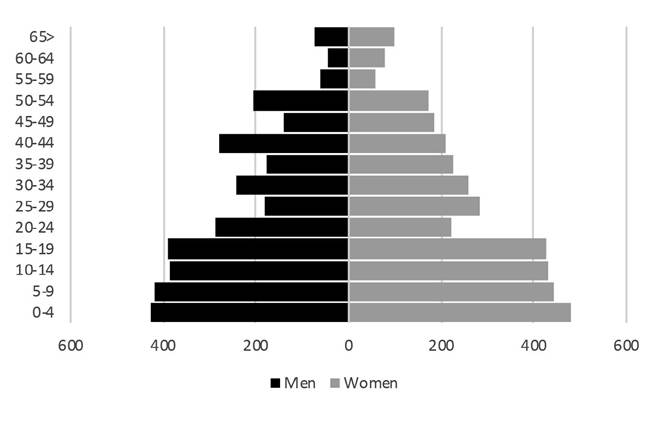
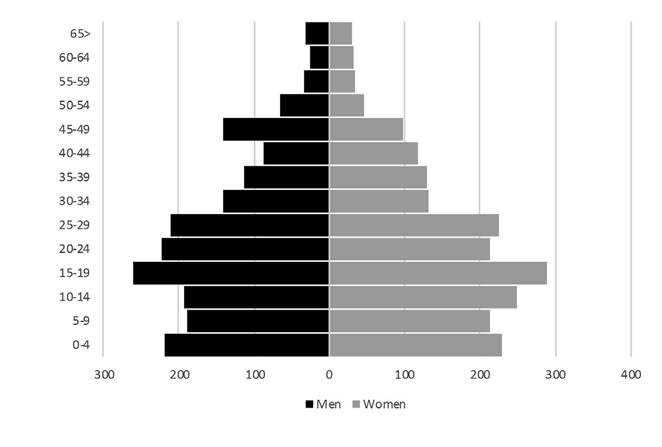
At the same time, the confessional lists for 1775 showed respective aging coefficients at: If we compare these values of aging coefficients with the special scales used in demography to calculate this phenomenon, we will see that according to the J. Beaujeu-Garnier - E. Rosset scale, which is applied when the threshold age is 60 years, the population of Poltava was experiencing “demographic youth.” This is deemed to apply to a population in which the proportion of people over 60 years old does not exceed 8 per cent. If, however, 65 years is taken as the threshold value, the un scale of demographic aging is usually employed, according to which a population, whose aging coefficient does not exceed 4 per cent of all population, is considered to be demograph- ically young.31 It is to this category that the population of Poltava belonged in the second half of the eighteenth century, according to our calculations. Contemporary demography holds the widespread view that the age structure of a population has a significant influence on the development of social processes. This is most clearly manifested in the indicators of the population’s natural dynamics: birthrate, death rate, and marital status. The larger the proportion of the younger age groups in the overall structure of the population, the higher the marriage and birth rates. Conversely, the higher the proportion of the elderly, the higher the death rate.32 The most widespread method of analyzing the structure of a population is by building sex-age pyramids, which enable us to visualize the age structure type. Such pyramids are represented by a mirror bar graph depicting the distribution of the population by age and sex (left side - men, right side - women). The vertical axis indicates the age, and the horizontal one, the number of people.33 Each age group is indicated on the graph by two bars, whose lengths are proportional to the number of men and women in each given group (see figures 13.2 and 13.3). Since the age interval assigned to the last group (over 65 years) is much greater than the five-year intervals for all the other groups (theoretically speaking, it encompasses six 5-year intervals, from 65 to 95 years), for the sake of proportionality in the graphic representation, it is customary in demography to divide the number in this group by six.34 Thus for the demographic pyramid built in accordance with data from the Rumiantsev census, the conventional (specified here) number of people in the oldest group will add up to 171 6 = 28.5, and for the pyramid built based on the confessional lists, it will equal 62 6 = 10.3. Demographic pyramids are most often compared to three “ideal types” of the age structure of the population, which were introduced at the end of the nineteenth century by the Swedish demographer Gustav Sundbarg. He introduced the concept of progressive, stationary, and regressive types of age structures (see figure 13.1).
Figure 13.1 The main “ideal” types of age pyramids
Figure 13.2 Sex-age pyramid of Poltava according to the Rumiantsev Census In the progressive type of age structure, the population number constantly increases; in the stagnant type, the number does not change significantly; in the regressive type, it decreases.35 Although on the whole, as we have already established, the population of Poltava was young, both the pyramids I have created lack the “ideal” geometric form. They clearly show the ups and downs that, I believe, attest to the effect of the described disasters, the natural and military calamities, on the structure of Poltava's population in the second half of the eighteenth century. These forms of demographic pyramids also provide evidence of a significant age rounding in the sources we used and their primitive nature from the standpoint of contemporary historical demography. Even so, the pyramids have the typical appearance of the sex-age structure of a traditional society. The broad base of the first pyramid indicates a high proportion of children. On the pyramid based on data from the confessional lists (see figure 13.3), children are somewhat outnumbered by the young representatives of the working-age groups. I believe that this is the result of at least two factors: first, that this pyramid was built on the records of only four parishes, and thus the smaller size of the group weakens the effect of the “law of large numbers”; second, that the confessional lists did a better job of recording the migrants coming to the
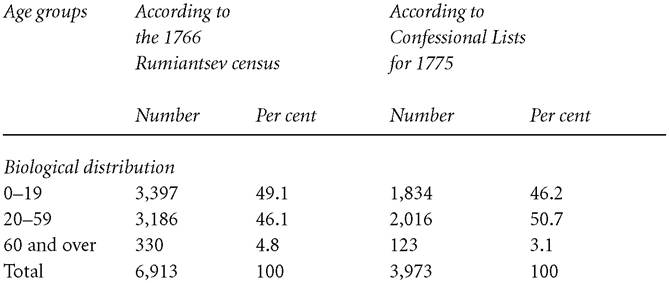
Figure 13.3 The sex-age pyramid of Poltava according to the confessional lists for 1775 city - that is, clients of local landlords (piddani), hired workers, craftsmen’s apprentices, and so forth. These categories usually belonged to the young age groups.36 The steady tapering off of the pyramid upwards, and the small number of the elderly, indicates that the residents of Poltava constituted a traditional (agrarian) society.37 However, there is no ideally regular tapering off on either pyramid, which is due to the higher death rates in the older age groups. In addition, people of various ages were variously affected by illnesses and other potentially lethal factors. The age structure is also studied by dividing the population into large age groups, as proposed by the founder of historical demography Louis Henry (table 13.4). He introduced two types of division: biological and economic. Under the biological type, the population is divided into young people (0-19 years), adults (20-59), and the elderly (60 and over). Under the economic type, the population is divided into groups of pre-productive age (0-14), productive age (15-64), and post-productive age (over 65 years).38 It should be noted that the Rumiantsev census actually employed its own distribution, which essentially corresponded to the economic type of division, the only difference being that the last group began from 60 years of age rather than 65.39 Table 13.4 Population distribution of Poltava in the second half of the eighteenth century by biological and economic types
Economic distribution
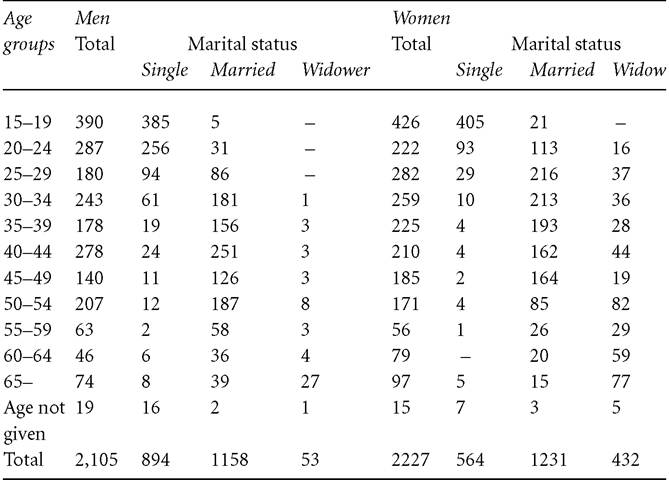
Table 13.4 shows that in both types of distribution, adults or people of productive age accounted for the largest segments of the population. Young people were in second place, and the smallest group consisted of representatives of the older age groups, which is a characteristic feature of a traditional, pre-industrial society. Thus, our analysis allows us to conclude that the total population of the city of Poltava in the second half of the eighteenth century numbered nearly 7,500 people, with women having the advantage in numbers. Poltava even outnumbered some other regimental cities in terms of residents. For example, according to the Rumiantsev census, Nizhyn then had 5,469 inhabitants,40 and Starodub had 4,286.41 The obvious numerical preponderance of the young and adult over the elderly indicates that the city population in the period under study was experiencing demographic youth. Population distribution by marital status. Demography defines the marriage structure of the population as the distribution of the population by marital status, that is, the personal status of each individual in relation to the marriage institution.42 Based on this, I will try to provide answers to the following questions: Table 13.5 Population distribution of the city of Poltava by marital status in 1765-66
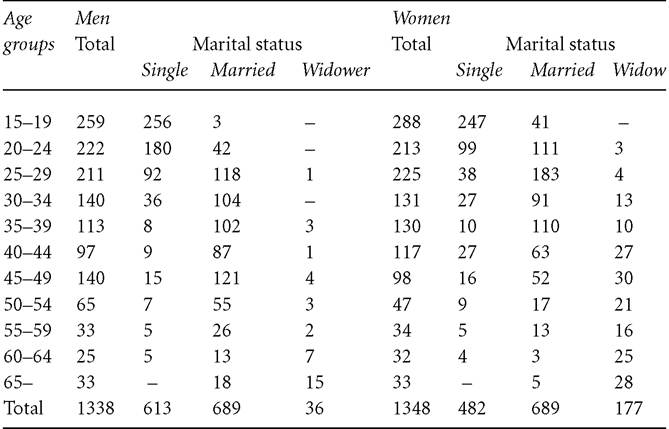
• How many Poltavites were married at the time that the documents were created? • What share of city residents was made up of those who used to be married (widows and widowers)? • How many people had never been married? • What was the difference in age between husband and wife? • What was the situation in the marriage market? With this in mind, the male and female populations have been entered in a special table of unprocessed statistical data reflecting the distribution of the population by marital status (tables 13.5 and 13.6). Although the lowest marriage age at the time was 13 for girls and 18 for boys,43 I will take the age category of 15-19 years as the starting point, since no younger married persons of either sex were found in either source. My calculations show that married individuals accounted for the largest share of the city's population in the period under study. In 1765-66, married men totaled Table 13.6 Population distribution of the city of Poltava by marital status in 1775
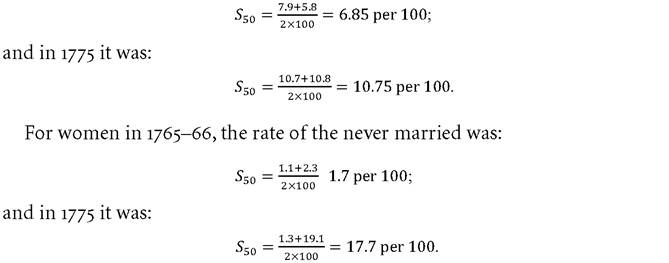
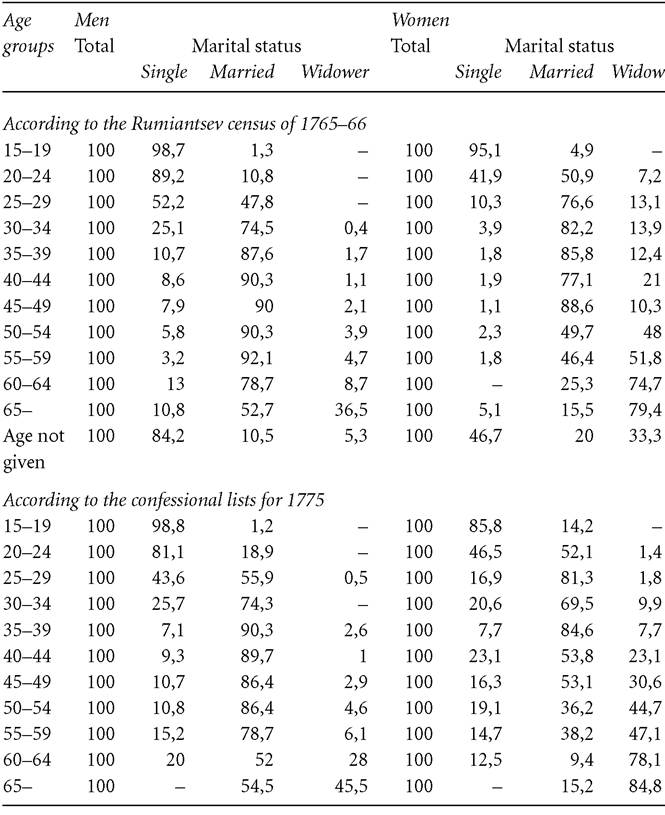
1,158 (55 per cent) and married women numbered 1,231 (55.3 per cent). In 1775, in four parishes, there were 689 (51.5 per cent) married men and exactly the same number of married women, whose share of the population was not much smaller (51.1 per cent). Single men were in second place. According to the Rumiantsev census, there were 894 (42.5 per cent) of them, while single women numbered 564 (25.3 per cent). According to the confessional lists, there were 613 bachelors (45.8 per cent) and 482 single women (35.7 per cent). The largest proportion of those that were not married at the time that the source was compiled was made up of persons that belonged to relatively young age groups and potentially still had every chance of getting married (table 13.7). Among men, according to the Rumiantsev census, 735 (82.2 per cent) of the total 894 bachelors were in the groups ranging from 15 to 29 years, while, according to the confessional lists, these groups accounted for 528 (86.1 per cent) of 613 bachelors. Among single women, according to the first source, there were 527 females of that age (93.4 per cent) of the total number of 564, and, according to the second source, 384 (79.7 per cent) of 482, respectively. The data obtained from our calculations allow us to establish the level of ultimate singlehood, which is understood to mean the share of persons who never married throughout their entire life. According to the methodology of the French scholars Louis Henry and Alain Blum, it is generally held that the opportunity to marry for the first time decreases as the age level increases and becomes minimal at 50 years of age. Thus, the level of ultimate singlehood equals the rate of singlehood at 50 years.44 The indicator of ultimate singlehood S50 is obtained by calculating the average values of bachelors in the 45-49 and 50-54 age groups (table 13.7). Thus, for men in 1765-66, this rate was:
In the first case, the indicator of never married women is legitimately lower than for men, but in the second instance, it is too high. In my opinion, this phenomenon is closely related to the specific character of confessional lists as a source for the study of marital status. Of the four registers that I studied in my research, only one, compiled by the clergy of the Church of the Transfiguration,45 recorded the marital status of all hired workers. In the other three registers, hired workers of both genders were listed as single. A comparison of the result with the rates of ultimate singlehood in the villages of the Topal company (sotnia) of the Starodub regiment (among the men, only one man in the company remained single, and there were no single women), leads us to conclude that the number of people in the city of Poltava who never married was much higher. The overall percentage of single persons among both men and women also appears greater.46 This seems hardly surprising for Poltava, because, despite all its special aspects and caveats, it was a city, and the percentage of unmarried men and women in the cities of the time was fairly high.47 Their number rose due to the concentration of hired workers, students, craftsmen’s apprentices, and so forth. The smallest share in the distribution of population by marital status consisted of people that had been married earlier. Thus, in 1765-66, there were 53 widowers (2.5 per cent) in the city, and in 1775,36 (2.7 per cent). Widows usually comprised a several-fold larger number: in 1765-66, they numbered 432 widows (19.4 per Table 13.7 Distribution of the population of Poltava by marital status (percentage)
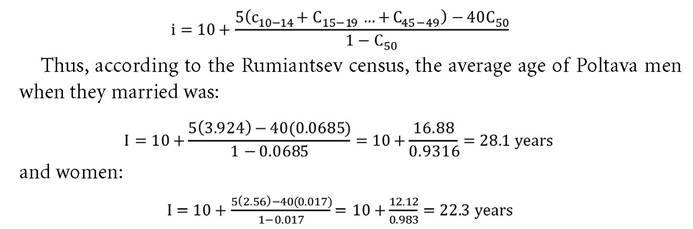
cent), and in 1775, 177 (13.1 per cent). As we can see, widows predominated over widowers eight-fold in the first instance, and five-fold in the second. I should note that the preponderance of widows over widowers was a typical phenomenon in early modern society not only in the Hetmanate, but across most of the territory of Europe. For example, widows accounted for 12.7 per cent and widowers for 0.7 per cent of the population of Pereiaslav.48 A similar situation existed in many Polish cities of the time: in Cracow there were 1.2 per cent widowers as against 6.9 per cent widows, and in Warsaw, 2.2 per cent widowers as against 9.9 per cent widows.49 In western European cities there were also more widows than widowers, but no such large numerical advantage was observed. For example, in Southampton, the share of widowers was 4.2 per cent and that of widows, 9.5 per cent.50 The reason for this numerical advantage of widows is obviously related to the overall preponderance of women in the population structure, the traditionally higher death rate among men, and fewer opportunities for widows to remarry. As Sherri Klassen, a researcher in this field, observes, in the eighteenth century, half of all widowers married a second time as against only one-third of widows who remarried.51 The data presented in table 13.7 also allow us to calculate the average age at which Poltava residents married for the first time. Because the accuracy of the indices of population distribution by marital status in the confessional lists is somewhat questionable, I will limit myself to the data in the Rumiantsev census. Knowing the proportion in each age group below fifty years of those that never married, I will attempt to calculate this indicator (i) using the following formula:
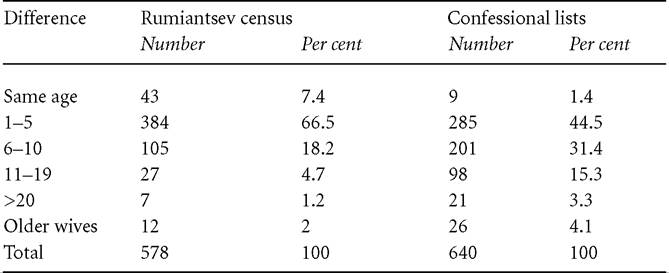
These results are somewhat higher than the indices I obtained for the Old Believers’ and Ukrainian villages of the Starodub regiment. There, according to the same source, the average age at first marriage among the Russian Old Believers was 22.5 years for men and 19.3 for women. Ukrainian men married later: at 23.7 years, whereas women slightly earlier: at 19.1 years.52 The indicators for Poltava are closer to those obtained by Ihor Serdiuk for Pereiaslav: 25.7 years for men and 22.5 years for women.53 The accuracy of these indices was most likely affected by various factors, for example, the special aspects of the source and a high percentage of single individuals in the urban population as against their share in the villages. However, the marriage age of Poltava residents matches exactly the analogous indicators reported by the abovenamed Cezary Kuklo for the territory of the Polish-Lithuanian Commonwealth. In particular, he states that “at the end of the existence of the Republic of Nobles, men married at an average age of 25 to 29 years, and women married at 20 to 24 years.”54 In the countries of western Europe, particularly in large urban centers, the age at first marriage also ranged within these parameters.55 For example, according to Roger Bellingham’s calculations, in the town of Selby in Yorkshire (England), the age at first marriage for men was 25.1 years, and for women, 22.8 years.56 In summing up my analysis of population distribution by marital status of the city of Poltava in the second half of the eighteenth century, I must note that more than half of Poltavites aged fifteen and older were married. A significant proportion of the population was made up of single individuals, the majority of whom had every prospect of marrying. Contrary to the widespread view that in a traditional society only the odd individual never married, in the population of Poltava, 7 men and 2 women per every 100 persons never entered the institution of marriage. It is likely that the urban factor played a certain role since the ultimate singlehood coefficient was usually higher in the city than in the villages. The laws in effect in the Hetmanate allowed Poltavites to marry fairly early: according to the Lithuanian Statute, the legal marriage age for females was 13 and 18 years for males;57 the decree issued by Peter I on 23 March 1714 set the minimum marriage age at 17 years for women and 20 years for men.58 Despite this, the average age at first marriage in Poltava was significantly higher: 28.1 years for men and 22.3 years for women.59 If one is to believe the sources, early marriages occurred very rarely in the city. The Rumiantsev census records only one pair, where both were 20 years old: the Taras and Uliana Bilychenko couple.60 The confessional lists record equally few - just four young couples. The youngest lived in the household of Cossack Onysym Bahrii and belonged to the parish of the Church of the Nativity of the Mother of God. Unfortunately, this page of the register survived in very poor condition, making it impossible to establish the names of the pair; however, it makes it clear that one of Onysym’s brothers was nineteen years old and his wife was sixteen.61 Terentii, the son of the Cossack widow Frosyna Havry- lykha, married at a relatively young age (19 years). And his wife, Stepanyda, had just turned 18 years old at the time.62 There were two other young married couples among the Cossacks who were parishioners of the Transfiguration Church: Iosyp (20 years) and Ievheniia (19 years) Hnitko and Ivan (20 years) and Ahafiia (17 years) Zasiadko.63 Age Difference It is difficult to say which of our two most used sources recorded the age parameters of Poltavites more accurately. Quite often they simply contradict each other. For example, according to the Rumiantsev census, Pavlo Rudenko, who is mentioned in this source more than once, was forty years old, and his wife, Uliana, was only twenty.64 On the other hand, if one believes the confessional list of the Resurrection Church, compiled ten years later, Pavlo was then forty-five years old, and Uliana was thirty-six.65 Thus our sources report different ages of our protagonists and different age differences between them. In my opinion, this is yet another illustration not only of the “rigor” with which statistical documentation was compiled in those days but also of the characteristic attitude to age and the specific nature of its perception by the Poltava residents of the day. Despite the fact that both sources contain data that are not always accurate, we have no better and more accurate indicators today. From the Rumiantsev census, I selected only couples who were household owners whose ages were listed. There were 578 such families. The married couples of their subjects and servants are not included in this study. From the confessional lists, I considered the data for only four parishes: Resurrection, Transfiguration, Nativity of the Mother of God, and Presentation at the Temple. The main reason for this choice, as already noted above, was the significant damage to documents. Nonetheless, I was able to identify 640 married couples in this source (table 13.8). The table created on the basis of these data clearly illustrates the fact that in both sources married couples in which the husbands were one to five years older than their wives made up the largest share. It should be noted that according to the Rumiantsev census, 258 examples (67 per cent) consisted of couples where the difference was five years. The confessional lists contained only 68 (23.9 per cent) such couples, but they, too, made up the largest category in their subgroup. The way in which the documents are formulated give us grounds to assume that these were first marriages, concluded between a single man and a single woman. This was generally a typical situation in Poltava at the time, as well as in other cities in the Hetmanate66 and neighboring regions, especially the Polish-Lithuanian Commonwealth.67 According to both sources, couples with an age difference of six to ten years were in second place. The confessional lists report significantly more such couples than the Rumiantsev census. In my opinion, this is explained by the greater precision of recording the ages of married couples in the different parishes. Whatever the case may be, this yet again indicates that the age difference between husband and wife usually ranged between one to ten years. Table 13.8 Age difference between husbands and wives
There were couples where the difference was 10 to 19 years, sometimes it was 20 years, or even more. According to the Rumiantsev census, seven persons - merchants Ivan Mospan, Pavlo Rudenko, and Ivan Sulyma; city councilor Omelian Malikhovs'kyi; shoemaker Hryhorii Khomych; blacksmith Andrii Dubyna; and Cossack Nestor Halaburdenko - were twenty years older than their wives. Notably, in this source, this significant age difference was indicated exclusively by this figure. Whereas the confessional lists are not that uniform: they show that the age difference in this group ranged from 20 to 32 years. Thus, the manorless (bez- dvirnyi) parishioner of the Church of the Transfiguration Havrylo Kravchenko was 32 years older than his wife, Ahafiia.68 It is likely that she was his second, or even third, wife. Such unequal marriages, as well as those in which the wives were older than their husbands, were not very common in the society of the day. As we see in table 13.8, the Rumiantsev census recorded 12 (2 per cent) couples in Poltava where the wife was older, while the confessional registers listed 26 (4.1 per cent) such cases.69 The wandering poet Klymentii Zinoviiv, who formulated moral values and at the same time largely expressed public opinion regarding various phenomena, in one of his poems condemned both examples of inequality. He wrote that, “it is not good when the husband is old and the wife is young, there is much discord between such [partners]and a marriage where the wife was older than the husband, in his opinion, was wholly void of God's blessing and there would be no good in it ever. Summing up, Klymentii notes: Therefore protect Christians from such marriages, God: Because this is very indecent and unseemly. And grant us to make marriages of equal years: And have your blessing.70 However, concrete circumstances sometimes forced people to ignore public opinion and conclude such marriages. In an agrarian society, the numerical advantage in age of wives is usually explained by manpower needs.71 In the case of Poltava, at least three additional, exclusively “urban,” factors need to be considered: the ability to gain through marriage city citizenship, Cossack status, or a place in a craftsman’s workshop. Characteristics of the “Marriage Market”72 The study of how and where Poltavites chose their marriage partners, as well as matters concerning the marriage rate in general, is made more difficult by the weakness of the source base. Unfortunately, no church registers of births, marriages, and deaths, compiled during the period under study, have been preserved, or perhaps have not been found yet. The Rumiantsev census casts little light on this matter. The compilers of the Poltava book, in contrast to their colleagues who described other localities, for some reason very rarely recorded the parentage of the marriage partners. Therefore, I will base my data only on chance observations that occasionally occur in the sources I have analyzed. The Poltava census book and two other documents compiled in the course of the conduct of the Rumiantsev census - “Inventory of the Property of the Cossacks of the Poltava Company” (Opys maina kozakiv Poltavs'ko’i sotni) and the “Register of those who joined the Cossacks,” (Imenna vidomist’ pro zapysavshkhsia v kozaky) - offered information about 87 married couples, thus enabling us to research this question to some degree.73 We must first note, however, that the choice of a marriage partner in early modern Ukrainian society was not only a matter of love, but, first and foremost, a family strategy. The legal norms in effect on the territory of the Hetmanate, both secular (Lithuanian Statute of 1588) and religious (Synod decree of 5 January 1724), admonished parents against forcibly marrying their children.74 However, children had to obtain their parents’ permission to marry. Thus, although young people had to be governed by family interests, some freedom of choice existed nonetheless. In his day, this circumstance served as grounds for the prominent Ukrainian historian Orest Levyts'kyi to characterize family relations in Ukrainian society as “excellent.”75 Another important condition for concluding a marriage was the absence of blood kinship.76 Also, marriages between people of different faiths were not encouraged: “there is no better life in marriage in the world than having a wife of the same faith.”77 There were no such cases in Poltava during the period that I studied. But there were marriages between members of different ethnic groups - as a rule, between Ukrainians and Russians. We know for a fact that the wife of the Russian merchant Petro Bobrov, lavdokha, was Ukrainian, the widow of the Poltava town dweller Vasyl' Pavlenko.78 Merchant Mykhailo Antonov was Russian and his wife Ahafiia was Ukrainian.79 There is no exact information about the ethnicity of the wife of the Tatar convert to Christianity Mykola Bashkyr, Paraska, but it is likely that she too was Ukrainian.80 We also do not know the ethnic identity of the wife of the “nonservice” Georgian Otar Kuchuina, who rented a dwelling in the manor of Cossack Mykhailo Kalynychenko.81 An analysis of the origins of the marriage partners in the selected couples indicates that in 51 cases (58.6 per cent) both were native Poltavites. Although my selection does not pretend to be fully representative, I would venture that the marriage market in Poltava was confined, for the most part, to the territory of the city and surrounding villages. At the same time, there were also people who came from outside the boundaries of this territory. There were 25 (28.7 per cent) such individuals among the men. The largest number of them (12) came from the villages and towns of the Poltava regiment, seven came from other regions of the Hetmanate, three from the Slo- boda regiments, one from the Saint Elizabeth Fortress, one from Russia, and one (Stepan Zhornii) from the Don.82 In addition, Poltava was quite often chosen as the place to marry and settle by natives of Zaporizhzhia, which is easily explained by the relatively close location of the city to its free lands. There are countless such examples, but let us consider just a few. For instance, lakiv Rudyi (the grandfather of the famous Poltava bur- mister and fellow of the standard (bunchukovyi tovarysh) Pavlo Rudenko), who came to the Zaporozhian Sich from Chyhyryn and for some time “dostatochnoe vremia” was in the Pashkivskyi kurin (infantry unit). Later, “after marriage in Poltava” (emphasis mine - lu. V.), he bought townspeople-estate (meshchanskogo stanu) land and had the status of a town dweller (meshchanin).”83 A similar journey was made by the grandfather of the city company's aide-de-camp Semen Ku- tyts'kyi, who “after arriving from the Polish domain, stayed at the Zaporozhian Sich and the company regiments.” After some time, he came to Poltava and married.84 The Poltava town dweller Semen Mymria was also “a son of the Polish nation” and came from the town of Turiia, near Lysianka. At thirteen, after the death of his parents, he made his way to the Sich and lived there for seven years with his cousin, Cossack Danylo Bezchesnyi. Then Danylo gave Semen a herd of 85 horses to drive to Poltava and sell them there. But Semen's brother instructed him: “after selling them, remain here and, if possible, get married (emphasis mine - lu. V.). Which is what Semen did: “he married Paraskoviia, the daughter of Poltava resident Nestor Pavlovs'kyi, a subject of His Excellency the Lord General Field Marshall, senator, and bearer of various orders Count Kyrylo Rozumovs'- kyi.”85 Notably, Semen's father-in-law was also “a son of the Polish nation,”86 a compatriot, that is “one of his own.” As the selection shows, only in thirteen couples were the wives from outside Poltava. And almost all of them came from surrounding villages: Ivashky, Vaku- lyntsi, Luhove, Patlaivka, Semenivka, Machukhy, Hozhuly, Budky, Pavlenky, Tiu- tiunnyky, and Nyzhni Mlyny. The exceptions were the wives of the Cossacks: Danylo Skorokhod's Feodosiia, who came from the town of Kotelva of the Okhtyrka regiment in Sloboda Ukraine, and Herasym Lebid's Tetiana “taken from the Pryluky regiment,87 the village of Khmeliv.”88 This village was probably one of the most distant places from which a bride came. Thus, we can assume that the search for marriage partners for the residents of early modern Poltava was confined to the territory of the city and surrounding villages. Instances in which partners were chosen from outside this area were the exception. If we examine the social origin of marriage partners (we were able to identify the status groups of both partners in 48 cases), we will find that they appear relatively homogenous, with only a few exceptions. People usually married members of their status group, or members of social groups close to their own. Thus in 22 cases (45.8 per cent), the social group of both marriage partners was recorded as identical. Ten other marriages (21.3 per cent) were concluded between Cossacks and commoners (pospolyti) and five marriages (10.6 per cent), between Cossacks and craftsmen. In five cases (10.6 per cent), the brides came from clerical families. Two of them, the wives of Cossacks Mykola Andrushchenko, levdokiia, and Hry- horii Rohachevs'kyi, lefymiia, were the daughters of priests.89 In four cases (8.5 per cent), one of the partners represented the merchant class. Clearly, ordinary Poltavites did not marry their daughters and sons to the members of the Cossack elite, wealthy merchant class, or the highest town dweller and clerical ranks. An advantageous marriage in Poltava at that time served as a kind of social elevator, which ensured a small rise in status or the opportunity to become part of the city community. As an example, we can cite the story of the merchant Ivan Kys- lomed, a native of “the village of Machukhy, from where he came to Poltava while still a minor, but does not remember in what year, and here he married the daughter of a native Poltava merchant, Vasyl' Bondarenko.”90 In addition, at least nine Cossacks from the regimental company - Mykhailo Kalenychenko, Ivan Tkachenko, Illia Klymenko, Herasym Halaburda, Oleksii Kononenko, Sava Bahrii, Hnat and Danylo Beznosenko, and Fedir Sinnychenko - claimed privileged status on the basis of marriage to the daughters of Cossacks.91 Obviously, the most advantageous mesalliance was entered into by Sava Bahrii, who married the daughter of retired regimental judge Vasyl' Artiukh.92 Equally profitable was the marriage of the aforementioned Russian merchant Mykhailo Antonov to the widow of fellow of the banner (znachkovyi tovarysh) Ivan Nashchyns'kyi.93 This marriage most likely not only enabled the merchant to find common ground with the local merchant community but also bound him with family ties to a fairly influential officer clan. Translated from the Ukrainian by Marta Skorupsky NOTES Originally published as: lurii Voloshyn, “Statevo-vikovyi sklad naselennia” and “Shliubna struktura naselennia” in lurii Voloshyn, Kozaky i pospolyti: mis’ka spil'nota Poltavy druhoipolovyny XVIII stolittia (Kyiv, 2016), 81-91, 160-74. Copyright 2016 by lurii Voloshyn. Copyright 2016 by lurii Voloshyn. Translated and reprinted with permission. 1 lu. I. Muromtseva, Demohrafiia: navchal 'nyi posibnyk dlia studentiv vyshchykh navchal ’nykh zakladiv (Kyiv, 2006), 61-75. 2 C. Kuklo, Demografia Rzeczypospolitejprzedrozbiorowej (Warsaw, 2009), 51-195. 3 Tsentral’nyi derzhavnyi istorychnyi arkhiv Ukrainy v m. Kyievi (Central State Historical Archive of Ukraine in Kyiv; hereinafter - tsdiauk), f. 57, op. 2, spr. 1, ark. 1-388. 4 tsdiauk, f. 990, op. 2, spr. 34, ark. bzv. 7-119. 5 lu. V. Voloshyn, “‘Dlia tochnago ischyleniia i svedeniia vsego malorossiiskago naroda': provedennia Rumiantsevs'koho opysu v polkovomu misti Poltavi (1765-1766 rr.),” Kraieznavstvo 1 (2011): 57-71. 6 tsdiauk, f. 57, op. 2, spr. 8. 7 G.A. Maksimovich, Deiatel'nost' Rumiantseva-Zadunaiskogo po upravleniiu Malorossiei (Nizhyn, 1913), 247. 8 lu. V. Voloshyn, “Zhinka-vdova v polkovomu misti Poltavi druhoi polovyny XVIII st. (za materialamy Rumiantsevs'koho opysu Malorosii),” Kyivs'ka starovyna 1 (2010): 18-25. 9 Kuklo, Demografia Rzeczypospolitej, 136. 10 tsdiauk, f. 57, op. 2, spr. 1. 11 Henry S. Shryok and Jakob S. Sigel, The Methods and Materials of Demography (New York, 1976), 295. 12 V.A. Dmytrenko, “Materialy tserkovnoho obliku naselennia Kyivs'koi ta Pereiaslavs'koi-Boryspil's'koi ieparkhii iak dzherelo z sotsial'noi istorii Het'- manshchyny XVIII st.” (PhD diss., M.S. Hrushevs'kyi Institute of Ukrainian Archeography and Source Studies, Kyiv, 2011), 50-60. 13 Ibid., 99-101. 14 Polnoe sobranie zakonov Rossiiskoi imperii (hereafter pszri ) (St Petersburg, 1830), 10: 116-18. 15 Kuklo, Demografia Rzeczypospolitej, 130-1. 16 Ibid., 133. 17 Misto Poltava v Rumiantsevs ’komu opysi Malorosn (1765-1769 rr.), ed. Iu. Voloshyn (Kyiv, 2012), 576. 18 Calculated as in I.O. Serdiuk, “Polkovi mista Livoberezhnoi Ukrainy seredyny XVIII st.: istoryko-demohrafichnyi vymir (na prykladi Nizhyna, Pereiaslava i Staroduba)” (PhD diss., National University of Kyiv-Mohyla Academy, Kyiv, 2010), 197-9. 19 C. Kuklo, Kobieta samotna w spoleczenstwie miejskim u schylku Rzeczypospolitej szlacheckiej (Bialystok, 1998), 51-4. 20 A.M. Froide, “Hidden Women: Rediscovering the Single Women of Early Modern England,” Local Population Studies 68 (Spring 2002): 29. 21 Klymentii Zinoviiv, Virshi. Prypovisti pospolyti, ed. I.P. Chepiha (Kyiv, 1971), 97. 22 tsdiauk, f. 990, op. 2, spr. 34, ark. 51-119. 23 Ibid., ark. 7-50. 24 Ibid. 25 E.S. Ostras', Vrozhainist’zernovykh kul’tur, khlibni tsiny ta zabezpechennia naselennia khlibom u Livoberezhnii Ukra'ini v druhii polovyni XVIII st. (Donetsk, 2003), 11, 46. 26 Derzhavnyi arkhiv Poltavs’koi oblasti (State Archive of Poltava Region; hereinafter - dapo), f. 8831, op. 9, spr. 7, ark. 91. 27 Kuklo, Demografia Rzeczypospolitej, 133. 28 Ibid. 29 Ibid., 134. 30 V.G. Glushkova and Iu. A. Simagin, eds, Demografiia: uchebnoe posobie, 4th ed. (Moscow, 2010), 55. 31 V.M. Medkov, Demografiia: uchebnoeposobie (Rostov-on-Don, 2002), 128. 32 Glushkova and Simagin, Demografiia: uchebnoe posobie, 56. 33 Demograficheskii entsiklopedicheskii slovar’, ed. D.I. Valentei (Moscow, 1985), 65. 34 Louis Henry and Alain Blum, Metodika analiza v istoricheskoi demografii (Moscow, 1997), 26. It should be noted that these types of age structures also differ as to the proportion of children and the elderly in the overall structure of the population. Under the “progressive” type, children account for up to 40% and the elderly, up to 10%; under the “stagnant” type, children make up less than 30% and the elderly more than 20%; under the “regressive” type, children account for up to 20% and the elderly for more than 30%. See, Muromtseva, Demohrafiia: navchal 'nyi posibnyk, 68. At least such was the situation in Pereiaslav according to I. Serdiuk's observations. See, Serdiuk, Polkovi mista Livoberezhnoi Ukrainy seredyny XVIII st., 106. Henri and Blum, Metodika analiza, 25. Ibid., 23. tsdiauk, f. 57, op. 1, spr. 117, ark. 112zv. V.M. Kulakovs'kyi, “Klasove rozsharuvannia mis'koho naselennia u XVIII st.,” Ukrains’kyi istorychnyi zhurnal 9 (1980): 93. I.O. Serdiuk, “Demohrafichni kharakterystyky dytiachoho naselennia Staro- duba za danymy Heneral'noho opysu Livoberezhnoi Ukrainy 1765-1769 r.r.,” in Naukovi zapysky: zbirnykprats’ molodykh vchenykh ta aspirantiv 17 (Kyiv- Khmel'nyts'kyii, 2008), 86. Muromtseva, Demohrafiia: navchal'nyiposibnyk, 74-5. I.M. Petrenko, Shliubno-simeini vidnosyny v povsiakdennomu zhytti myrian Rosiis ’koi derzhavy XVIII st. 2 parts (Poltava, 2010), 1: 195. Henri and Blum, Metodika analiza, 48. tsdiauk, f. 990, op. 2, spr. 34, ark. 71-86. Iu. V. Voloshyn, Rozkol’nyts’ki slobody na teritoriiPivnichnoiHet'manshchyny u XVIII st. (istoryko-demohrafichnyi aspect) (Poltava, 2005), 186-90. Kuklo, Kobieta samotna, 60. I. Serdiuk, “Vdivtsi i vdovy u Rumiantsevs'komu opysi Pereiaslava (istoryko- demohrafichnyi analiz),” Kraieznavstvo 1-4 (2008): 175. Kuklo, Kobieta samotna, 58. Froide, “Hidden Women,” 30. S. Klassen, “Widows and Widowers,” in Encyclopedia of European Social History from 1350 to 2000, ed. Peter N. Stearns, vol. 4 (Detroit, 2001), 207-8. Voloshyn, Rozkol’nyts’ki slobody, 194-5. Serdiuk, Polkovi mista Livoberezhnoi Ukrainy, 113-14. Kuklo, Demografija Rzeczypospolitej, 278-9. Petrenko, Shliubno-simeini vidnosyny, 202. R. Bellingham, “Age at Marriage in the Late-Eighteenth Century,” Local Population Studies 61 (Autumn 1998): 56. 57 Statuty Velykoho kniazivstva Lytovs'koho, 3 vols. (Odesa, 2004), vol. 3, bk. 2, Statut Velykoho kniazivstva Lytovs’koho 1588 roku, 209. 58 pszri, vol. 5 (1713-1719): 92. 59 In 1965, the British scholar John Hajnal divided Europe by marriage rates along a line from St Petersburg to Trieste. According to him, to the west of this line, low marriage rates predominated with a high age of first marriage, at over 24 years for women, and 26 years for men. The level of the never married was also relatively high - more than 10%. To the east of this line, the marriage rate was high, while the marriage age was lower: below 22 for women, and below 24 for men. The level of ultimate singlehood was below 5%. (Massimo L. Bacci, Demograficheskaia istoriia Evropy [St Petersburg, 2010], 149.). The results I obtained do not accord with this theory in everything, because the average marriage age of men appears too high. However, it was less than 24 years for women, as it should be. The level of ultimate singlehood was also not high - 1.6%, different from the pattern of marriage east of the Hajnal line. It is possible that this error is connected to the specific nature of the urban environment. 60 Misto Poltava, 450. 61 tsdiauk, f. 990, op. 2, spr. 34, ark. 111. 62 Ibid., ark. 57. 63 Ibid., ark. 75, 76. 64 Misto Poltava, 146. 65 tsdiauk, f. 990, op. 2, spr. 34, ark. 52. 66 I. Serdiuk, Polkovykh horodov obyvateli: istoryko-demohrafichna kharak- terystyka mis’koho naselennia Het’manshchyny druho'ipolovyny XVIIIst. (Poltava, 2011), 149. 67 Kuklo, Demografija Rzeczypospolitej, 284. 68 tsdiauk, f. 990, op. 2, spr. 34, ark. 85zv. 69 The aforementioned Cesary Kuklo contends that in the society that he studied the number of such marriages ranged between 10 and 20 per cent, see Kuklo, Demografija Rzeczypospolitej, 284. 70 Zinoviiv, Virshi. Prypovisti pospolyti, 115-16. 71 Voloshyn, Rozkol’nytski slobody, 196. 72 Marriage market - a term often used in scholarly literature to characterize the totality of potential suitors and marriageable girls in the whole population, as well as the entire system of their expectations and requirements with respect to their future marriage. Characteristic of the marriage market, as of the regular market, are the concepts of supply and demand. The situation on the marriage market, the likelihood of entering into marriage, depends on the number of potential marriage partners in the whole population, and on its sex-age structure. See, Demograficheskii poniatiinyi slovar’, ed. L.L. Rybakovskii (Moscow, 2003), 33-4. TsDIAUK, f. 57, op. 2, spr. 60, 166. Statuty Velykoho kniazivstva Lytovs'koho, vol. 3, bk. 2: 28; pszri, vol. 7 (17231727): 197-8. O. Levitskii, “O semeinykh otnosheniiakh v lugo-Zapadnoi Rusi v XVI-XVII vekakh,” Russkaia starina 11 (1880): 558. Statuty Velykoho kniazivstva Lytovs'koho, vol. 3, bk. 2: 207-8. Zinoviiv, Virshi. Prypovisti i pospolyti, 116. Misto Poltava, 72-3. Petro Bobrov was from the city of Pereiaslavl-Zalesskii and came to Poltava from the Saint Elizabeth Fortress. Both places were centers of compact settlement of Russian Old Believers, allowing us to assume that he may have also been an Old Believer. However, there is no direct evidence of this. tsdiauk, f. 57, op. 2, spr. 60, ark. 142. Ibid., 286. Misto Poltava, 176. Ibid., 480. “Atestat Viis'ka Zaporoz'koho Nyzovoho tovaryshevi Korsuns'koho kurenia Pavlovi Rudenky: al'bom,” in Skarby Dnipropetrovs’koho istorychnoho muzeiu im. D.I. lavornyts’koho (Dnipropetrovsk, 2005), 133-4. tsdiauk, f. 57, op. 2, spr. 60, ark. 175. Ibid., f. 1726, op. 1, spr. 22, ark. i02zv-03. Misto Poltava, 355. Clearly an error in the document, because the village of Khmeliv was part of the Romny company of the Lubny regiment, and from 1742 to 1782 it was the center of the Khmeliv company. tsdiauk, f. 57, op 2, spr. 166, ark. 44, 74zv. Misto Poltava, 197; tsdiauk, f. 57, op. 2, spr. 60, ark. 147. Misto Poltava, 48. tsdiauk, f. 57, op. 2, spr. 60, ark. 152-75. Ibid., ark. 178. This probably refers to Vasyl' Artemovych, who, according to Volodymyr Kryvosheia, was the regimental judge in 1717-18. See, V.V. Kryvosheia, Kozats’ka starshyna Het’manshchyny. Entsyklopediia (Kyiv, 2010), 190. Ivan Andriiovych Nashchyns'kyi (1727?-52?), fellow of the banner of the Poltava regiment, member of a fairly influential Cossack officer family. His father was probably Andrii Nashchyns'kyi, captain of the Poltava city company (1691-1700). One of his relatives, Klym Nashchyns'kyi, was the Poltava regimental quartermaster (1709-22) and acting colonel several times. Other members of this clan included the rector of the Kyiv-Mohyla Academy in 1758-61 and the well-known church figure, archimandrite Danylo Nashchyns'kyi (31 January 1721-5 May 1793). See, Kryvosheia, Kozats’ka starshyna Het'- manshchyny, 536; V.O. Mokliak, Poltavs 'kyi polk: naukovo-populiarnyi narys istorn polku z chasu ioho vynyknennia do kintsia XVII stolittia (Poltava, 2008), 68; Kyievo-Mohylians 'ka akademiia v imenakh, XVII-XVIII st. Entsyklopedy- chne vydannia, comp. Z.I Khyzhniak, ed. V.S. Briukhovets'kyi (Kyiv, 2001), 387.
More on the topic Population Distribution of the City of Poltava in the Second Half of the Eighteenth Century by Age, Sex, and Marital Status:
-
Conflictology -
Ecology -
Economy -
Finance -
History -
Law -
Medicine -
Philosophy -
Religious studies -
|