SET THEORY
Look at the following diagrams:
Figure 1: Refers to the situation where there are two attributes A and B. (Let’s say A refers to people who passed in Physics and B refers to people who passed in Chemistry.) Then the shaded area shows the people who passed both Physics and Chemistry.
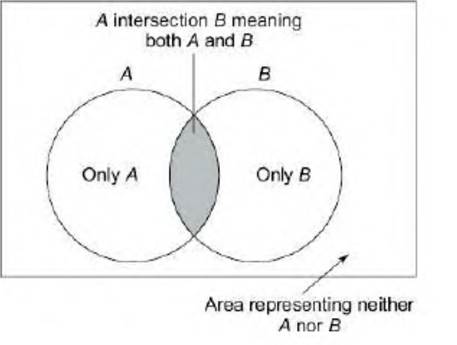
In mathematical terms, the situation is represented as:
Total number of people who passed at least
Figure 2: Refers to the situation where there are three attributes being measured. In the figure below, we are talking about people who passed Physics, Chemistry and/or Mathematics.
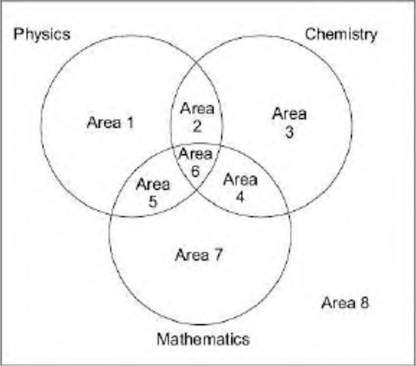
Inthe above figure, the following explain the respective areas:
Area 1: People who passed in Physics only
Area 2: People who passed in Physics and Chemistry only (in other words—people who passed Physics and Chemistry but not Mathematics)
Area 3: People who passed Chemistry only
Area 4: People who passed Chemistry and Mathematics only (also, can be described as people who passed Chemistry and Mathematics but not Physics)
Area 5: People who passed Physics and Mathematics only (also, can be described as people who passed Physics and Mathematics but not Chemistry)
Area 6: People who passed Physics, Chemistry and Mathematics
Area 7: People who passed Mathematics only
Area 8: People who passed in no subjects
Also take note of the following language which there is normally confusion about:
People passing Physics and Chemistry—Represented by the sum of areas 2 and 6
People passing Physics and Maths—Represented by the sum of areas 5 and 6
People passing Chemistry and Maths—Represented by the sum of areas 4 and 6
People passing Physics—Represented by the sum of the areas 1, 2, 5 and 6
In mathematical terms, this means:
Total number of people who passed at least 1 subject =

Let us consider the following questions and see how these figures work in terms of real time problem solving:
More on the topic SET THEORY:
- Preface
- CONTENT AGGREGATION AND MARKET STRUCTURE
- 3 Obligations as to Husbandry
- The Netherlands and the UK: The Witteveen Reports and their contradictory results
- Comparability across People and Dimensions
- THEORETICAL CONSIDERATIONS
- Contents
- Background Context
- BACKGROUND AND DEFINITIONS
- Data for Multidimensional Poverty Measurement