Distance to the Frontier and Changes in the Organization of Production
In this section, I discuss how the structure of production changes over the process of development, and how this might be related both to changes in certain aspects of the internal organization of the firm and to a shift in the “growth strategy” of an economy.
I will illustrate these ideas using a simple model based on Acemoglu, Aghion and Zilibotti (2006). Because of space restrictions, I only provide a sketch of the model, mainly focusing on the production side of the economy.Consider a less-developed economy that is behind the world technology frontier. Throughout, I focus on the behavior of this economy, thus there is no need to use country indices. Time is discrete and the economies populated by two-period lived overlapping generations of individuals. Total population is normalized to 1. There is a unique final good, which is also taken as the numeraire. It is produced competitively using a continuum of intermediate inputs according to the standard Dixit-Stiglitz (constant elasticity of substitution) aggregator:

where A (ν, t) is the productivity of the intermediate good in intermediate sector ν at time t, x(ν, t) is the amount of intermediate good ν used in the production of the final good at time t, and α ∈ (0,1).
Each intermediate good is produced by a monopolist ν ∈ [0,1] at a unit marginal cost in terms of the unique final good. The monopolist faces a competitive fringe of imitators that can copy its technology and also produce an identical intermediate good with productivity A (ν,t), but will do so more expensively. In particular, the competitive fringe can produce each intermediate good at the cost of χ > 1 units of final good. The existence of this
competitive fringe forces the monopolist to charge a limit price:

Naturally, this limit price configuration will be an equilibrium when χ is not so high that the monopolist prefers to set a lower unconstrained monopoly price.
The condition for this is simply
which I impose throughout. Broadly, one can think of the parameter χ as capturing both technological factors and government regulations regarding competitive policy. A higher χ corresponds to a less competitive market. Given the demand implied by the final goods technology in (21.32) and the equilibrium limit price in (21.33), equilibrium monopoly profits are simply:
is a measure of the extent of monopoly power. In particular it can be verified that δ is increasing in χ for all χ ≤ 1∕α.
In this model, the process of economic development will be driven not by capital accumulation—which was the force emphasized in some of the earlier models—but by technological progress, that is, by increases in A (ν, t). Let us assume that each monopolist ν ∈ [0,1] can increase its A (ν, t) by two complementary processes: (i) imitation (adoption of existing technologies); and (ii) innovation (discovery of new technologies). The key economic tradeoffs in the model arise from the fact that different economic arrangements (both in terms of the organization of firms and in terms of the growth strategy of the economy) will lead to different amounts of imitation and innovation.
To prepare for this point, let us define the average productivity of the economy in question at date t as:
Let A (t) denote the productivity at the world technology frontier. The fact that this economy is behind the world technology frontier means that

for all t. The world technology frontier progresses according to the difference equation

where the growth rate of the world technology frontier is taken to be

877
where η and γ will be defined below.
We assume that the process of imitation and innovation leads to the following law of motion of each monopolist’s productivity:

where η > 0 and 7 > 0, and ε (ν, t) is a random variable with zero mean, capturing differences in innovation performance across firms and sectors.
In equation (21.37), η∕l (t — 1) stands for advances in productivity coming from adoption of technologies from the frontier (and thus depends on the productivity level of the frontier, /I (t — 1)), while γA (t — 1) stands for the component of productivity growth coming from innovation (building on the existing knowledge stock of the economy in question at time  as the (inverse) measure of the country’s distance to the technological frontier at date t.
Now, we can integrate (21.37) over ν ∈ [0,1], use the fact that ε (ν, t) has mean zero, divide both sides by A (t) and use (21.35) to obtain a simple linear relationship between a country’s distance to frontier a (t) at date t and the distance to frontier a (t — 1) at date t — 1 given by

This equation is similar to the technological catch-up equation in Section 18.2 in Chapter 18. It shows how the dual process of imitation and innovation may lead to a process of convergence. In particular, as long as equation (21.38) implies that a (t) will
eventually converge to 1. Second, the equation also shows that the relative importances of imitation and innovation will depend on the distance to the frontier of the economy in question. In particular when a (t) is large (meaning the country is close to the frontier), γ—thus innovation—matters more for growth.
In contrast when a (t) is small (meaning the country is farther from the frontier), η—thus imitation—is relatively more important.To obtain further insights, let us now endogenize η and γ using a reduced-form approach. Following the analysis in Acemoglu, Aghion and Zilibotti (2006), I will model the parameters η and γ as functions of the investments undertaken by the entrepreneurs and the contractual arrangement between firms and entrepreneurs. The key idea is that there are two types of entrepreneurs: high-skill and low-skill. When an entrepreneur starts a business, his skill level is unknown, and is revealed over time through his subsequent performance. This implies that there are two types of “growth strategies” that are possible. The first one emphasizes selection of high-skill entrepreneurs and will replace any entrepreneur that is revealed to be 878
low skill. This growth strategy will involve a high degree of turning (creative destruction) and a large number of young entrepreneurs (as older unsuccessful entrepreneurs are replaced by new young entrepreneurs). The second strategy maintains experienced entrepreneurs in place even when they are have low skills. This strategy therefore involves an organization of firms relying on “longer-term relationships” (here between entrepreneurs in the credit market), an emphasis on experience and cumulative earnings, and less creative destruction. While low-skill entrepreneurs will be less productive than high-skill entrepreneurs, there are potential reasons for why an experienced low-skill entrepreneur might be preferred to a new young entrepreneur. For example, this may be because entrepreneurial experience increases productivity, so that the low-skill experienced entrepreneur may be better at certain tasks than a high-skill inexperienced entrepreneur. Alternatively, Acemoglu, Aghion and Zilibotti (2006) show that in the presence of credit market imperfections, the retained earnings of an old entrepreneur may provide him with an advantage in the credit market (because he can leverage his existing earnings to raise more money).
I denote the strategy based on selection by R = 0, while the strategy that maintains experienced entrepreneurs in place is denoted by R = 1.The key reduced-form assumption here will be that experienced entrepreneurs (either because of the value of experience or because of their retained earnings) are better at increasing the productivity of their company when this involves the imitation of technologies from the world frontier (i.e., relatively “routine” tasks). High-skill entrepreneurs, on the other hand, are more innovative and generate higher growth due to innovation. Thus the tradeoff between R = 1 and R = 0 and the associated tradeoff between organizational forms boils down to the tradeoff between imitation of technologies from the world technology frontier versus innovation. For this reason, I will refer to the first one as imitation-based growth strategy and to the second one as the innovation-based growth strategy. Motivated by these considerations, let us assume that the equation for the law of motion of the distance to frontier, (21.38), takes the form
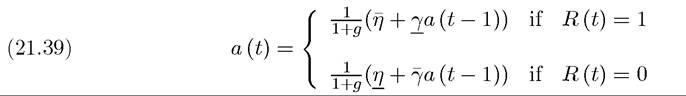
as a function of the contractual/organizational decision at time t, R (t) ∈ {0,1}. In this equation we assume that

The first part of this assumption follows immediately from the notion that high-skill entrepreneurs are better at innovation, while the second part, in particular, that builds in the feature that experienced entrepreneurs are better at imitation. When the imitation-based growth strategy is pursued, experienced entrepreneurs are not replaced, and consequently, 879
there is greater transfer of technology from the world technology frontier. The final part of this assumption, that simply ensures that imitation-based growth will not lead
to faster growth than the world technology frontier.
Also in terms of (21.39), we can interpret the assumption (21.36) as stating that the world technology frontier advances due to innovation-based growth strategy, which is natural, since a country at the world technology frontier cannot imitate from others. This is what equation (21.40) introduces.
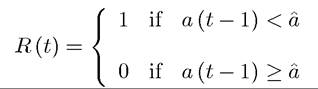
FIGURE 21.4. The growth-maximizing threshold and the dynamics of the distance to frontier in the growth-maximizing equilibrium.
Figure 21.4 draws equation (21.39), and shows that the economy with long-term contracts (R = 1) achieves greater growth (higher level of a (t) for given a (t — 1)) through imitation channel, but lower growth through the innovation channel. The figure also shows that which regime maximizes the growth rate of the economy depends on the level of a (t — 1), that is, on the distance of the economy to the world technology frontier. In particular, inspection of (21.39) is sufficient to establish that there exists a threshold
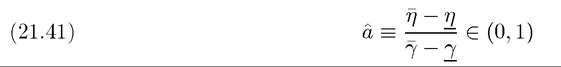
such that when a (t — 1) < a, the imitation-based strategy, R = 1 leads to greater growth, and when a (t — 1) > a, the innovation-based strategy, R = 0, achieves higher growth. Thus if the economy were to pursue a growth-maximizing sequence of strategies, it would start with R = 1 and then switch to an innovation-based strategy, R = 0, once it is sufficiently close to the world technology frontier. In the imitation-based regime, incumbent entrepreneurs are 880
sheltered from the competition of younger entrepreneurs and this may enable the economy to make better use of the experience of older entrepreneurs or to finance greater investments out of the retained earnings of incumbent entrepreneurs. In contrast, the innovation-based regime is based on an organizational form relying on greater selection of entrepreneurs and places greater emphasis on maximizing innovation at the expense of experience, imitation and investment.
Figure 21.4 describes the law of motion of technology in an economy as a function of the organization of firms (markets), captured by R. It does not specify what the equilibrium sequence of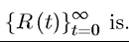 To determine this equilibrium sequence, we need to specify the
equilibrium behavior, which involves the selection of entrepreneurs as well as the functioning of credit markets. Space restrictions preclude me from providing a full analysis of the equilibrium in such a model. Instead, I will informally discuss some of the main insights of such an analysis.
Conceptually, one might want to distinguish among four configurations, which may arise as equilibria under different institutional settings.
(1) Growth-maximizing equilibrium: the first and the most obvious possibility is an equilibrium that is growth maximizing. In particular, if markets and entrepreneurs are able to solve the agency problems, have the right decision-making horizon and are able to internalize the pecuniary and non-pecuniary externalities, we would obtain an efficient equilibrium. This equilibrium will take a simple form:
so that the economy achieves the upper envelope of the two lines in Figure 21.4. In this case, there is no possibility of outside intervention to increase the growth rate of the economy.[XLV] Moreover, an economy starting with a (0) < 1 always achieves a growth rate greater than g, and will ultimately converge to the world technology frontier, i.e., a (t) → 1. In this growth-maximizing equilibrium, the economy first starts with a particular set of organizations/institutions, corresponding to R = 1. Then, consistent with Kuznets' vision of a structural transformation emphasized above, the economy undergoes a change in its organizational form and growth strategy, and switches from R = 1 to R = 0. In our simple economy, this structural transformation takes the form of long-term relationships disappearing and being replaced by shorter-term relationships, by greater competition among entrepreneurs and firms, and by better selection of entrepreneurs.
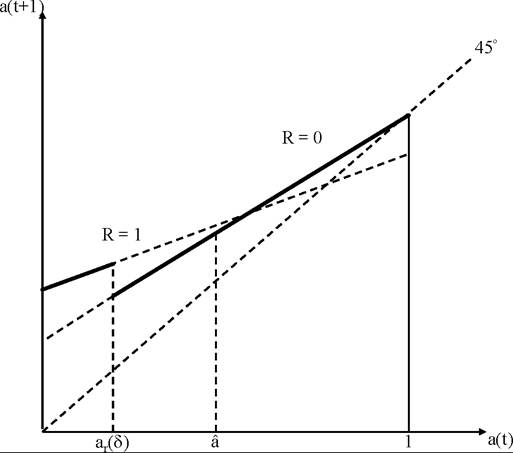
FIGURE 21.5. Dynamics of the distance to frontier in the underinvestment equilibrium.
(2) Underinvestment equilibrium: the second potential equilibrium configuration involves the following equilibrium organizational form:
where Figure 21.5 depicts this visually, with the thick black lines corre
sponding to the equilibrium law of motion of the distance to the frontier, a. How is ar (δ) determined? Acemoglu, Aghion and Zilibotti (2006) shows that when investments by young and old entrepreneurs are important for innovation and credit markets are imperfect, then the retained earnings of old (experienced) entrepreneurs enable them to undertake greater investments. However, because of monopolistic competition, there is the standard appropriability effect, whereby an entrepreneur that undertakes a greater investment does not capture all the surplus generated by this investment because some of it accrues to consumers in the form of greater consumer surplus. The appropriability effect always discourages investments, and in this context since greater investments are associated with more experienced, older entrepreneurs, it discourages the regime in which long-term contracts keep entrepreneurs in place for two periods in a row. This description also explains why this equilibrium is referred to as the “underinvestment equilibrium”; in the range a ∈ (αr (δ), ^), the economy could reach a higher growth rate (as shown in the figure) by choosing
R (t) = 1, but because the appropriability effect discourages investments, there is a switch to the innovation-based equilibrium and the associated organizational forms earlier than the growth-maximizing threshold.
A notable feature is that although the equilibrium is different from the previous case, it again follows the sequence of R = 1 followed by a structural transformation and a switch to greater competition among and selection of entrepreneurs with the innovation-based regime. Therefore, this equilibrium also exhibits the feature that the process of growth and economic development is associated with structural transformation. Moreover, the economy will still ultimately converge to the world technology frontier, i.e., a (t) = 1 is reached as t → ∞. The only difference is that the structural transformation from R = 1 to R = 0 happens too soon at a (t — 1) = ar (δ) rather than at a.
Consequently, in this case, a temporary government intervention may increase the growth rate of the economy. The temporary aspect is important here, since the best that the government can do is to increase the growth rate while a ∈ (ar (δ), a). How can the government achieve this? Subsidies to investment would be one possibility. Acemoglu, Aghion and Zilibotti (2006) show that the degree of competition in the product market also has an indirect effect on the equilibrium, as emphasized by the notation ar (δ). In particular, a higher level of δ, which corresponds to lower competition in the product market (i.e., higher χ), will increase ar (δ), and thus may close the gap between ar (δ) and ^. Nevertheless, it has to be noted that reducing competition will create other, static distortions (because of higher markups). Moreover and more importantly, we will see in the next two configurations that reducing competition can have much more detrimental effects on economic growth.
3. Sclerotic equilibrium: the third possibility is a sclerotic in which ar (δ) > a, so that incumbent low-skill, low-productivity firms survive even when they are potentially damaging to economic growth. Acemoglu, Aghion and Zilibotti (2006) show that this configuration can also arise in equilibrium because the retained earnings of incumbent entrepreneurs act as a shield protecting them against the creative destruction forces brought about by new entrepreneurs. Consequently, in general, the retained earnings or other advantages of experienced entrepreneurs both have (social) benefits and costs, and which of these will dominate will depend on the details of the model and the parameter values. When the benefits dominate, the equilibrium may feature too rapid a switch to the innovation-based strategy, and when the costs dominate, the economy may experience sclerosis with the imitation-based strategy and excessive protection of incumbents.
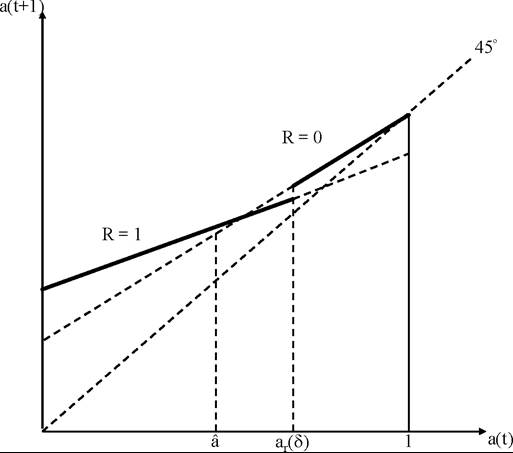
Figure 21.6. Dynamics of the distance to frontier in the sclerotic equilibrium.
The resulting pattern in this case is drawn in Figure 21.6. Now the economy fails to achieve the maximum growth rate for a range of values of a such that a ∈ (a, ar (δ)). In this range, the innovation-based regime would be growth-maximizing, but the economy is stuck with the imitation-based regime because of the retained earnings and the power of the incumbents prevent the transition to the more efficient organizational forms.
An interesting feature is that, as Figure 21.6 shows, this economy also follows a pattern in line with Kuznets’s vision; it starts with a distinct set organizations, represented by R = 1, and then switches to a different set of arrangements, R = 0. Like the previous two types of equilibria, this case also features convergence to the world technology frontier, i.e., to a = 1.
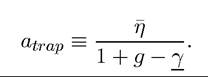
4. Non-Convergence trap equilibrium: the fourth possibility is related to the third one and also involves ar (δ) > a. However, now the gap between ar (δ) and a is even larger as depicted in Figure 21.7, and includes the level of a, atrap, such that
Inspection of (21.39) immediately reveals that if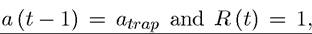
the economy will remain at atrap. Therefore, in this case, the retained earnings or the experience of incumbent firms afford them so much protection that the economy
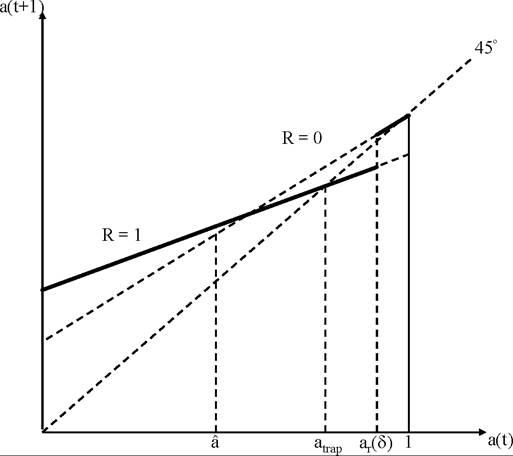
FIGURE 21.7. Dynamics of the distance to frontier in a non-convergence trap. If the economy starts with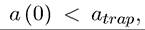 it fails to converge to the world
technology frontier and instead converges to atrap.
never transitions to the innovation-based equilibrium. This not only retards growth for a temporary interval but pushes the economy into a non-convergence trap. In particular, this is the only equilibrium pattern in which the economy fails to converge to the frontier; with the imitation-based regime, R = 1, the economy does not grow beyond atrap, and at this distance to frontier, the equilibrium keeps choosing R = 1.
This equilibrium therefore illustrates the most dangerous scenario—that of nonconvergence. Encouraging imitation-based growth—by supporting existing, incumbent firms, may appear as a good policy,* [46] but in fact it condemns the economy to non-convergence. This is also the only case in which the Kuznetsian structural transformation does not occur because the economy remains trapped. In many ways, this is in line with Kuznets' vision; the resulting economy is an underdeveloped one, unable to realize the structural transformation necessary for the process of economic development.
Taken together the four scenarios suggest that depending on the details of the model, there should be no presumption that the efficient or the growth-maximizing sequence of growth
2
strategies will be pursued. Thus, some degree of government intervention might be useful. However, the third and the fourth cases also emphasize that government intervention can have fairly negative unintended consequences. Such intervention will improve growth performance during a limited period of time (in the second scenario when a ∈ (ar (δ), a), but it can create much more substantial costs by leading to a non-convergence trap as shown in Figure
21.7. Therefore, unless there is very precise information and some way of reversing policies protecting incumbents that are once implemented (a very difficult practice because of political economy reasons, which will be discussed in greater detail in Chapter 22), government interventions to spearhead economic development might backfire.
Even though the implications of these four scenarios for government intervention are mixed, their implications for changes in the structure of organization over the development process are clearer; irrespective of which scenario applies, the economy starts with a distinct organization of production, where longer-term contracts, the incumbent producers, experience and imitation are more important, and then, except in the non-convergence trap equilibrium, it ultimately switches to an equilibrium with greater creative destruction, shorter-term relationships, younger entrepreneurs and more innovation. This type of transformation is another facet of the structural transformations emphasized by Kuznets as part of the process of economic development. The framework presented here, though reduced-form, can also be used to study other aspects of the transformation of the production of organization. Exercise 21.7 shows how the ideas in this section can be used to study the changes in other aspects of the internal organization of the firm through the course of the process of development.
21.5.