KEY DIAGRAM 2
The labor market
An economy's level of employment and the real wage are determined in the labor market.
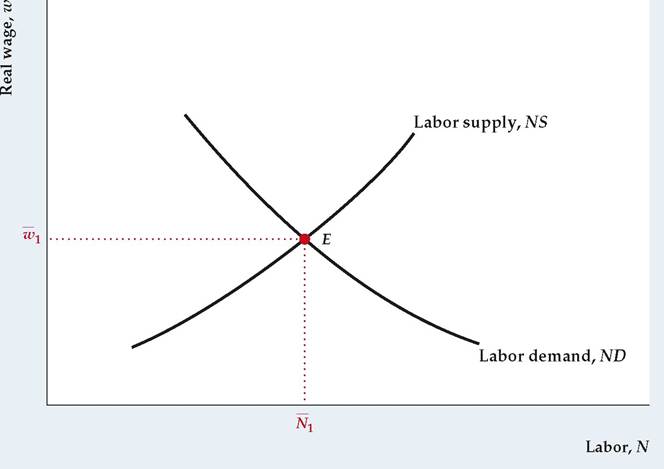
Diagram Elements
■ The current real wage, w, is on the vertical axis, and the level of employment, N, is on the horizontal axis.
The variable N may also represent alternative measures of labor, such as total hours worked.■ The labor demand curve, ND, shows the amount of labor that firms want to employ at each current real wage. The labor demand curve slopes downward because firms find hiring more labor profitable when the real wage falls. The labor demand curve for an individual firm is the same as the MPN curve, which shows the marginal product of labor at each level of employment.
■ The labor supply curve, NS, shows the amount of labor offered by workers at each current real wage. The labor supply curve slopes upward because an increase in the current real wage, with other factors held constant, increases the amount of labor supplied.
Analysis
■ Equilibrium in the labor market occurs when the quantity of labor demanded equals the quantity of labor supplied. In the figure, equilibrium employment is and the equilibrium real wage is w 1. The equilibrium level of employment, which occurs after wages and prices have fully adjusted, is called the fullemployment level of employment.

Factors That Shift Curves
■ Any factor that increases the amount of labor demanded at a given current real wage shifts the labor demand curve to the right. Such factors include an increase in productivity that increases the marginal product of labor and an increase in the capital stock. See Summary table 3.
■ Any factor that increases the amount of labor supplied at a given current real wage shifts the labor supply curve to the right. Such factors include a decline in wealth, a drop in the expected future real wage, an increase in the adult population, and an increase in labor force participation. See Summary table 4.
►