KEY DIAGRAM 1
The production function
The production function indicates how much output an economy or a firm can produce with any given quantities of capital and labor.
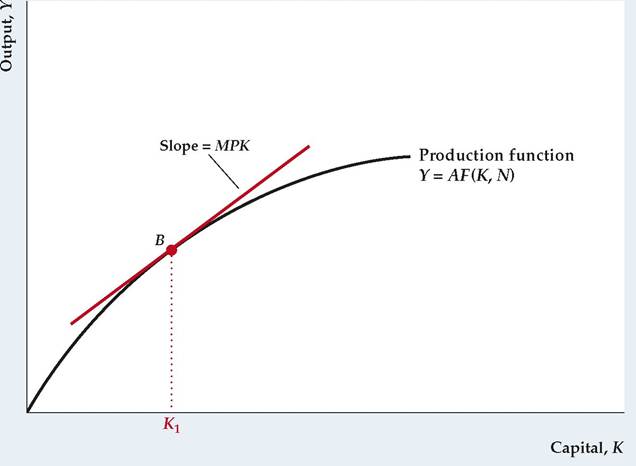
Diagram Elements
■ The production function graphed here has the amount of output produced, Y, on the vertical axis and the quantity of capital used, K, on the horizontal axis, with labor, N, held constant.
It can also be drawn as a relationship between output and labor, with capital held constant. The production function relating output to labor looks like the graph shown here.■ The equation for the production function is Y = AF (K, N), where A (total factor productivity, or simply productivity) measures how effectively the economy uses capital and labor.
Analysis
■ The production function slopes upward, reflecting the fact that an increase in the quantity of capital will allow more output to be produced.
■ The production function becomes flatter from left to right, implying that the larger the capital stock already is, the less extra output is gained by adding another unit of capital. The fact that extra capital becomes less productive as the capital stock grows is called diminishing marginal productivity of capital.
■ With labor held constant, if an increase in capital of ∆ K leads to an increase in output of ∆ Y, then ∆Y∕∆K is called the marginal product of capital, or MPK. The MPK is measured graphically by the slope of the line tangent to the production function. For example, in the diagram the MPK when the capital stock is K1 equals the slope of the line tangent to the production function at point B.
Factors That Shift the Curve
■ Any change that allows more output to be produced for given quantities of capital and labor—a beneficial supply shock—shifts the production function upward. Examples of beneficial supply shocks include new inventions and improved management techniques.
■ Any change that reduces the amount of output that can be produced for given quantities of capital and labor—an adverse supply shock—shifts the production function downward. Examples of adverse supply shocks include bad weather and the depletion of natural resources.
►
More on the topic KEY DIAGRAM 1:
- SNAP 2008
- Corporate social and ethical responsibility
- Intellectual history of this idea
- EXERCISE ON QUANTITATIVE REASONING
- Preface
- SUMMARY
- THE EVALUATION PROBLEM
- The potential distributions of terrestrial biomes differ from their actual distributions due to human activities
- Chapter 28 ICT Infrastructure Framework for Microfinance Institutions and Banks in Pakistan: An Optimized Approach
- Conclusion