SUMMARY
CONCEPT 10.1 Populations are dynamic entities that vary in size over time.
10.1.1 List the different patterns of population growth observed in nature.
Most observed patterns of population growth can be grouped into four major types: exponential growth, logistic growth, fluctuations, and regular cycles.
These four patterns are not mutually exclusive, and a single population can (and probably will) experience each of them at different times.10.1.2 Compare the patterns of exponential growth with that of logistic growth.
Exponential growth occurs when the rate of growth increases (or decreases) in proportion to the current number of individuals and lasts for a limited time when conditions are favorable (or unfavorable).
Logistic growth occurs when the rate of growth increases rapidly at first and then stabilizes as the population reaches carrying capacity (the maximum population size that can be supported indefinitely by the environment).
10.1.3 Describe population size fluctuations and the special case of population cycling.
All populations show fluctuations in size, some of which are erratic and others of which are deviations from exponential or logistic growth. Some populations fluctuate greatly over time; others fluctuate relatively little.
Some populations show regular population cycles, a special type of fluctuation in which alternating periods of high and low abundance occur after nearly constant intervals of time.
A time lag in population growth often occurs when a change in population size is delayed by density-dependent factors, such as growth, reproduction, and/or mortality.
CONCEPT 10.2 The risk of extinction increases in populations that fluctuate in size and/or are small.
10.2.1 Justify why fluctuations in population growth rate can increase a population’s risk of extinction.
For a given average population size, a population that fluctuates in size shows a slower growth rate than one that does not vary.
A slower growth rate results in a smaller population size, which has a greater risk of extinction.
10.2.2 List and describe the ways that chance events can drive small populations to extinction.
Small populations can be driven to extinction by chance events associated with genetic drift and inbreeding, demographic stochasticity, and environmental stochasticity.
Genetic drift and inbreeding reduce the genetic variation of small
populations, limiting the ability of populations to respond to environmental change and harmful alleles.
Demographic stochasticity and environmental stochasticity produce unpredictable changes in population sizes, thus increasing the risk of extinction, especially for small populations.
REVIEW QUESTIONS
1. Describe a factor that can cause a time lag or delay in the response of a natural population to a change in population density. How do such time lags affect changes in abundance over time?
2. Summarize how chance events can threaten small populations.
3. A population consists of four unrelated individuals, two females (F1 and F2) and two males (M1 and M2). Individuals live only 1 year, and they mate only once, producing two offspring (one female, one male) from each mating. Individuals avoid mating with relatives if possible.
a. Starting with individuals F1, F2, M1, and M2 as the parent generation, can the first two generations of offspring be born to parents that are not related to each other? You may find it helpful to construct a diagram to illustrate the two generations of parents and their offspring.
b. If the second generation of offspring become parents, how many of the matings in this third generation of parents can occur between unrelated individuals? Generalizing from your results, is inbreeding likely to be common or uncommon in small populations?
HONE YOUR PROBLEM-SOLVING SKILLS
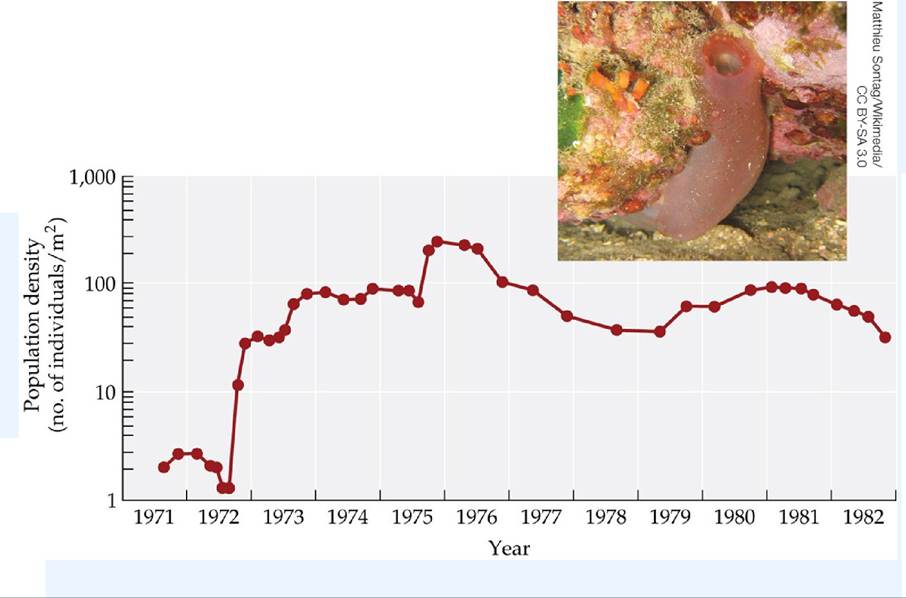
Svane (1984) studied population dynamics in the tunicate (or “sea squirt”) Ascidia mentula, a filter-feeding marine invertebrate.
The figure shows population densities over time for one of six study populations, and the table provides data (averaged across the six study populations) on how per capita birth and death rates are related to population density.| Population density (no. indiv/m[5] [6]) | Birth rate (offspring/indiv/yr) | Death rate (deaths/indiv/yr) |
| 38 | 0.40 | 0.38 |
| 60 | 0.39 | 0.32 |
| 75 | 0.56 | 0.51 |
| 105 | bgcolor=white>0.470.36 | |
| 180 | 0.44 | 0.48 |
| 230 | 0.30 | 0.32 |
population density. To do this, first plot each data point and then draw an approximate best-fit curve that goes through those points. Are birth rates density dependent? Explain.
3. Use the data in the table to graph the death rate versus population density; to do this, first plot each data point and then draw an approximate best-fit curve that goes through those points. Are death rates density dependent? Explain.
LIST OF KEY TERMS
Allee effects bottom-up control carrying capacity delayed density dependence demographic Stochasticity effective population size Environmental Stochasticity eutrophication exponential growth genetic drift inbreeding logistic growth natural catastrophes outbreak population cycles population fluctuations population growth top-down control
More on the topic SUMMARY:
- Molecular Epidemiology of Bovine Tuberculosis in Uganda
- Contents
- Animal Husbandry
- Other Mycobacterial Infections in Livestock and Wildlife in Tanzania
- REVIEW OF FORENSIC ASSESSMENT INSTRUMENTS
- Somalia
- FIVE COMPONENTS OF LEGAL COMPETENCIES
- The Netherlands and the UK: The Witteveen Reports and their contradictory results