Portfolio Allocation and the Demand for Assets
Discuss the factors that affect how people choose which assets they own.
Our next goal is to understand how people determine the amount of money they choose to hold. We begin by considering the broader question of how people allocate their wealth among the many different assets that are available, of which money is only one example.
A consumer, a business, a pension fund, a university, or any other holder of wealth must decide how to distribute that wealth among many types of assets. The set of assets that a holder of wealth chooses to own is called a portfolio. The decision about which assets and how much of each asset to hold is called the portfolio allocation decision.
The portfolio allocation decision can be complex. Many people make their living by giving financial advice to holders of wealth, and a major branch of economics, called financial economics, is devoted largely to the study of the portfolio allocation decision. But, fundamentally, only four characteristics of assets matter for the portfolio allocation decision: expected return, risk, liquidity, and time to maturity.
Expected Return
The rate of return to an asset is the rate of increase in its value per unit of time. For example, the return on a bank account is the interest rate on the account. The return on a share of stock is the dividend paid by the stock plus any increase in
5In Chapter 2 we said that the portion of government outlays not covered by taxes had to be borrowed from the private sector. Is this still true when the government has the option of paying for its outlays by printing money? Yes; for national income accounting purposes, the Federal Reserve is treated as part of the private sector. So when the Treasury sells government bonds to the Federal Reserve in exchange for currency, it is still technically borrowing from the private sector.
6The financing of government spending through money creation is discussed further in Chapter 15. the stock's price. Clearly, a high return is a desirable feature for an asset to have: All else being equal, the higher the return a wealth holder's portfolio provides, the more consumption she can enjoy in the future for any given amount of saving done today.
Of course, the return on an asset is not always known in advance. Stock prices may go up or down, for example. Thus holders of wealth must base their portfolio allocation decisions on expected returns, or their best guesses about returns on assets. Everything else being equal, the higher an asset's expected return (after subtracting taxes and fees such as brokers' commissions), the more desirable the asset is and the more of it holders of wealth will want to own.[116]
Risk
The uncertainty about the return an asset will earn relates to the second important characteristic of assets—riskiness. An asset or a portfolio of assets has high risk if there is a significant chance that the actual return received will be very different from the expected return. An example of a risky asset is a share in a start-up Internet company that will be worthless if the company fails but will grow in value by a factor of 10 if the company succeeds. Because most people don't like risk, they hold risky assets only if the expected return is higher than that on relatively safe assets, such as government bonds. The risk premium is the amount by which the expected return on a risky asset exceeds the return on an otherwise comparable safe asset.
Liquidity
Besides risk and return a third characteristic, liquidity, affects the desirability of assets. The liquidity of an asset is the ease and quickness with which it can be exchanged for goods, services, or other assets. Because it is accepted directly in payment, money is a highly liquid asset. An example of an illiquid asset is your automobile: Time and effort are required to exchange a used car for other goods and services; you must find someone interested in buying the car and arrange legal transfer of ownership.
Between liquid money and illiquid autos are many assets, such as stocks and bonds, of intermediate liquidity. A share of stock, for example, can't be used directly to pay for groceries as cash can, but stock can be transformed into cash with a short delay and at the cost of a broker 's fee.In addition to making transactions easier and cheaper, liquidity provides flexibility to the holder of wealth. A liquid asset can easily be disposed of if there is an emergency need for funds or if an unexpectedly good financial investment opportunity arises. Thus, everything else being equal, the more liquid an asset is, the more attractive it will be to holders of wealth.
Time to Maturity
Financial securities have a fourth and final key characteristic, which is their time to maturity. Time to maturity is the amount of time until a financial security matures and the investor is repaid his or her principal. Considering time to maturity is especially relevant for all types of bonds, as an investor can purchase bonds that will mature at any time—in one day, one week, one month, one year, or thirty years.
Let's consider Tim and Nathan, a couple that wants to buy bonds and keep their money invested for two years. They could choose one of two plans: Plan A is simply to buy a two-year bond today; Plan B calls for buying a one-year bond today and another one-year bond when that one matures one year from today. Ignoring, for the moment, any differences in the risk between Plan A and Plan B, the investors would choose the plan that they expect to give them the highest return over the two years. For example, if today's interest rate on the two-year bond is 7% per year, today's interest rate on a one-year bond is 5% per year, and if they expect the interest rate on a one-year bond to be 6% per year one year from now, then their return from Plan A (buying the two-year bond) is 7% per year and the return they expect from Plan B is 5.5% per year, which is the average of the 5% per year return on the one-year bond purchased today and the expected 6% per year return expected on the bond to be bought one year from today.
So the investors are likely to choose Plan A; that is, they are likely to buy the two-year bond today.The idea that investors compare the returns on bonds with differing times to maturity to see which is expected to give them the highest return underlies the expectations theory of the term structure of interest rates. "Term structure" refers to the fact that the theory explains why bonds that are similar in all respects except their terms to maturity have different rates of return. In equilibrium, according to the expectations theory, Plans A and B, which involve holding bonds with different terms to maturity over the same two-year period, should yield the same expected return; that is, the interest rate on a two-year bond should equal the average interest rate expected on two successive one-year bonds, so that an investor does not prefer one investment over another. More generally, the expected rate of return on an N-year bond should equal the average of the expected rates of return on one-year bonds during the current year and the N—1 succeeding years.
Although the expectations theory of the term structure of interest rates is a useful starting point, it cannot explain why, on average, we observe that the interest rates on long-term bonds generally exceed the interest rates on short-term bonds. (See the graph of the yield curve in Chapter 4, "In Touch with Data and Research: Interest Rates," which illustrates the term structure of interest rates.) When short-term interest rates are expected to be higher in the future than the current short-term rate, the expectations theory predicts that the long-term interest rate will exceed the short-term interest rate. However, when short-term interest rates are expected to be lower in the future than the current short-term interest rate, the expectations theory predicts that the long-term interest rate will be lower than the short-term interest rate. To see why long-term interest rates usually exceed shortterm interest rates, we need to take account of the fact that longer-term bonds are riskier than shorter-term bonds because the prices of long-term bonds are more sensitive than the prices of short-term bonds are to changes in the interest rate.
Because investors do not like risk, they must be compensated for holding longer- term bonds. The result is a term premium: an interest rate on long-term bonds that is somewhat higher than the expectations theory would suggest.If we add the term premium to the expectations theory, we have a more complete theory of how interest rates vary with time to maturity. For example, suppose the interest rate on a one-year bond today is 5% per year, the interest rate on a one-year bond one year from now is expected to be 6% per year, and the term premium on a two-year bond is 0.75% per year. Then, in equilibrium, the interest rate on a two-year bond should equal the average interest rate on the one- year bonds, which equals (5% + 6%)/2 = 5.5%, plus the term premium, 0.75%, or 6.25%.
Types of Assets and Their Characteristics
What types of assets do people hold, and how do the characteristics of those assets differ? Though there are many different assets, we will consider a few that are the most popular: money, bonds, stocks, houses, and consumer durable goods.
We have already seen in Section 7.1 that there are different types of money. All types of money usually have a low expected rate of return compared with other assets. Money usually does not have much risk, although there is always some risk that inflation will be higher than expected, so that the real return to holding money might turn out to be lower than expected. But money is very liquid compared with the other assets; indeed, its liquidity is generally the defining characteristic of what we call money. Because of its liquidity, money's time to maturity is generally very short. However, some assets included in M2, such as small time deposits, may have a longer time to maturity and are not very liquid.
Bonds are financial securities that are sometimes called fixed-income securities because they promise to pay bondholders specific amounts on specific dates. People often choose to own bonds issued by the U.S.
government because these bonds have little risk of default. Bonds issued by corporations are similar, but there is always some chance that a corporation will go bankrupt and fail to pay the interest or repay the principal it owes to its bondholders. Thus bonds offer a higher expected return than money, but the return is riskier. Many bonds, especially those sold by the U.S. government, are very liquid because an investor can easily sell his or her bond quickly and with low transactions costs. However, some corporate bonds are not very liquid, especially in bad economic times, and it may be difficult to sell them without a high cost. Bonds are issued in a variety of times to maturity, generally ranging from 3 months to 30 years.Stocks represent ownership in a company. Most stocks pay periodic dividends to the shareholders, but the dividend payments are not guaranteed. When the economy is weak and the company is not doing well, it may even stop paying dividends altogether for a time. Prices of stocks rise and fall every day, so the overall return to a shareholder consists of the dividends received plus any capital gain resulting from an increase in the value of the stock less any capital loss resulting from a decrease in the value of the stock. Because dividends and, especially, stock prices can change unpredictably, stocks are subject to a substantial amount of risk. Stocks in large companies are sold in very liquid markets, but when you buy or sell a stock there is a delay of several days for the transaction to clear and payment to be made. Most stocks do not have maturity dates, so the time to maturity is infinite.
Although most large companies are owned by shareholders who can readily buy and sell shares of stock in organized stock exchanges, such as the New York Stock Exchange, many small businesses are directly owned by one or a few people. These businesses, which are directly owned by their proprietors,
are not incorporated and do not issue stock that can be traded on exchanges. Because there are no marketable shares of stock in these companies, it is difficult for the owners to quickly sell ownership in the companies, so this ownership is not very liquid. Indeed, because there are no marketable shares, it is difficult to measure accurately the value of the ownership stake in these companies. The return to the owners of the company takes the form of profits earned by the company plus the opportunity that they may someday sell the company.
For most homeowners, housing is their largest asset. The returns to owning a house come in two forms: (1) the benefits to the household in terms of shelter net of maintenance costs and property taxes and (2) the change in the value of the house (or the land it sits on) over time. For a time in the 2000s, many people seemed to think that there was no risk to investing in housing, and the United States and many other countries went through a tremendous boom in which millions of homes were built and it was very easy for home purchasers to get mortgage loans. But the risk turned out to be much higher than investors thought, and an unexpected downturn in housing prices led to a financial crisis, as we discuss in "In Touch with Data and Research: The Housing Crisis of 2007 to 2011." Compared with other assets, housing is very illiquid—it may take months or years for a household to sell its home, especially in a recession. However, the availability of home equity loans and home equity lines of credit permit households to quickly borrow money against a portion of the value of their house. There is, of course, no specified time to maturity on housing, as it is not a financial security.
Households also hold some of their assets in the form of consumer durable goods, such as automobiles and furniture. As in the case of housing, durable goods provide services (such as transportation) over a period of time but may also require maintenance expenditures and can depreciate over time. There is some risk to the value of consumer durables, and it may be difficult and costly to sell them, as the market for used consumer durables is not as well developed as the market for stocks and bonds. Thus, consumer durables are not very liquid, and, like housing, have no specified time to maturity.
Households must determine what mix of these various assets is ideal for them. Wealthier households generally purchase more financial assets (stocks and bonds) as a percentage of their total wealth than poorer households. Many households will also put aside funds for retirement by holding assets in pension funds, which hold stocks, bonds, and types of money (such as money-market mutual funds). Of course, their mix of different assets may change when market conditions change. For example, the housing crisis of 2007 to 2011 and the financial crisis of 2008 dramatically reduced the value of housing and stock holdings, as Table 7.2 indicates. The table shows the amounts of each type of asset that households (and nonprofit organizations) held at the end of 2006, at the end of the first quarter of 2009, and at the end of the fourth quarter of 2021. Note that the amount of currency and checkable deposits is far less than the amounts listed in Table 7.1 under M1 because much currency is held overseas (see "In Touch with Data and Research: Where Have All the Dollars Gone?") and because business firms have substantial holdings of currency and checkable deposits. The table also reports how much of each type of asset households held as a percentage of their total assets, so you can get a sense of how the relative amounts of each type of asset changed between 2006, 2009, and 2021.
TABLE 7.2
Household Assets, 2006, 2009, and 2021
Amounts in trillions of dollars Percentages of total assets
| 2006Q4 | 2009Q1 | 2021Q4 | 2006Q4 | 2009Q1 | 2021Q4 | |
| Real estate | 26.5 | 22.7 | 42.4 | 32.3 | 30.7 | 25.1 |
| Consumer durables | 4.3 | 4.6 | 7.3 | 5.2 | 6.2 | 4.3 |
| Currency and checkable | 0.3 | 0.5 | 4.1 | 0.4 | 0.6 | 2.4 |
| deposits | ||||||
| Time, savings, and other | 6.8 | 8.2 | 14.0 | 8.3 | 11.1 | 8.3 |
| deposits | ||||||
| Bonds | 3.8 | 5.2 | 4.3 | 4.7 | 7.0 | 2.5 |
| Stocks | 13.9 | 7.8 | 45.1 | 16.9 | 10.5 | 26.7 |
| Proprietors’ investment in | 8.3 | 6.8 | 15.1 | 10.1 | 9.2 | 9.0 |
| unincorporated | ||||||
| businesses | ||||||
| Pension funds | 15.5 | 15.4 | 31.8 | 19.0 | 20.8 | 18.8 |
| Other assets | 2.6 | 2.9 | 4.6 | 3.1 | 3.9 | 2.8 |
| Total assets | 81.9 | 73.9 | 168.6 | 100.0 | 100.0 | 100.0 |
Note: Numbers may not add to totals owing to rounding.
Source: Federal Reserve Financial Accounts of the United States, Statistical Release Z.1, March 10, 2022.
In Touch with Data and Research
The Housing Crisis of 2007 to 2011
U.S. households gained a tremendous amount of wealth in their houses throughout the late 1990s and early 2000s. The housing market was booming and the homeownership rate rose to a record level of 68.6 percent of households by 2007. But as people became more and more convinced that housing was a "can't miss" investment and housing prices spiraled ever upwards, mortgage lenders and homeowners began to make some serious mistakes, which would lead to a major financial crisis.
As housing prices moved higher and higher in the early 2000s, many people found themselves unable to afford to buy a home because the monthly mortgage payments would have been too high relative to their monthly incomes. Specifically, the lending standards of mortgage lenders required that borrowers have sufficient monthly income so that the monthly mortgage payment would not exceed a specified percentage of monthly income. But as housing prices increased rapidly, mortgage lenders began making loans to people who did not meet the lending standards. These people were known as subprime borrowers. The subprime mortgage market grew rapidly. To compensate the lenders for the additional risk and potential costs of lending to subprime borrowers, the interest rate on subprime mortgages was higher than the interest rate on conventional or prime mortgages. In many cases, subprime lenders even dispensed with the usual income verification of borrowers, thereby further subjecting themselves to the risk that the borrowers would not be able to repay. In addition, some loans had creative features that gave the appearance that the borrower could afford to make the monthly payments—at least for a while. For instance, most subprime loans were
(continued)
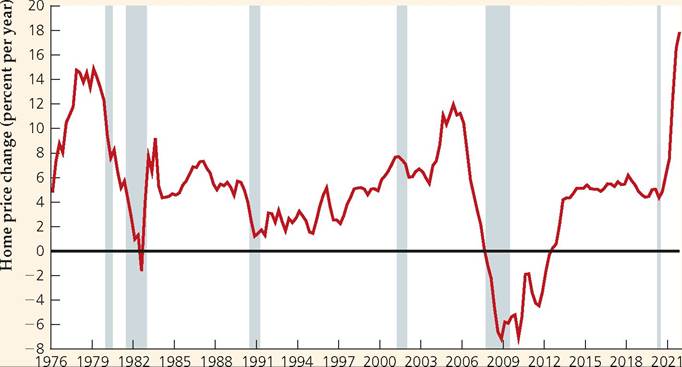
FIGURE 7.1
Increase in home prices from one year earlier, 1976Q1-2021Q4
The chart shows quarterly data on the percent increase in home prices from one year earlier, averaged across the United States, from the first quarter of 1976 to the fourth quarter of 2021. The appreciation in home prices averaged 4.7% per year over the entire period but exceeded 10% per year from early 2004 to early 2006. In 2007, the growth rate of home prices fell sharply, and in 2008, home prices began to decline, causing a crisis in mortgage markets. In 2021, following the pandemic recession, home prices rose almost 18%.
Source: Federal Housing Finance Agency, downloaded from Federal Reserve Bank of St. Louis FRED database, fred.stlouisfed.org/series/USSTHPI.
Year
adjustable-rate loans with a low initial interest rate that would increase after two or three years in a process known as mortgage reset.
Why were lenders willing to offer these risky loans to subprime borrowers, and why were borrowers willing to take on these risky obligations? To a large degree, the answer is that they expected house prices to continue to rise rapidly for the foreseeable future. As long as house prices kept rising substantially, a borrower who might otherwise have trouble making mortgage payments in the future could either sell the house for a profit and pay off the mortgage or could borrow against the house's equity value, which would be higher as house prices increased further. So, both borrowers and lenders thought they were insulated from risk.
The problem with subprime mortgages is that the borrower and lender are insulated from risk only as long as house prices continue to rise substantially. In 2005, as mortgage interest rates across the country began to rise, the rate of increase of house prices began to slow. In 2006, defaults on subprime mortgages began to increase, as borrowers who had counted on rapidly rising house prices to bail them out found that their houses were not worth as much as they expected. In addition, as mortgage resets began to set in at higher interest rates, more and more borrowers could no longer make their monthly mortgage payments and began to default on their mortgages. And as defaults began to occur in increasing numbers, banks started to tighten their lending standards, so that by mid-2007, they were making few if any subprime mortgage loans. But that, in turn, reduced the demand for houses, thus causing the increase in housing prices to be even smaller. House prices even began to decline in some areas of the country in 2007 and by 2008 began to fall for the nation as a whole, as shown in Figure 7.1.
Falling house prices caused a variety of problems, at both the micro level and macro level. Thousands of households that had bought houses with subprime mortgages lost their homes through foreclosure when they could not make their mortgage payments. Homeowners often found themselves owning homes whose value had fallen far below the amount they owed on their mortgage loans (a situation that came to be known as "underwater"), giving them the incentive to stop making mortgage payments and allow their homes to be repossessed. Financial institutions lost billions of dollars on such deals because they owned the rights to the mortgage payments, which would no longer occur. Because house prices had fallen, whoever came to own the house, usually a bank, would usually have to sell it for much less than the outstanding mortgage balance.
But what surprised many people about the problems in the mortgage market is that the impact was felt even more broadly. It turns out that most banks had sold bundles of their mortgages in the form of mortgage-backed securities (MBSs), and investors in MBSs suffered large losses. Once the losses began to materialize, investors all at once tried to bail out of such investments, driving their prices to very low levels. This, in turn, led to the financial crisis of 2008, when investors began to realize that many financial institutions had lost hundreds of billions of dollars through mortgage-related securities. Panic ensued, stock prices fell dramatically, especially for financial firms, and the government and Federal Reserve bailed out many financial firms, as we describe in more detail in the Application "Macroeconomic Consequences of the Boom and Bust in Stock Prices," in Chapter 4.
At the end of 2006, households had over $80 trillion in assets, with $26.5 trillion worth of real estate and about $14 trillion in stocks, as well as about $15.5 trillion in pension fund assets. The steep declines in house prices and stock prices and the drop in proprietors' investment in unincorporated businesses reduced household wealth by about $8 trillion by the first quarter of 2009. The value of real estate holdings declined by 14%, and the value of stock holdings fell by about 44% from the end of 2006 to early 2009. Over this period of time, households reallocated their portfolios, putting more of their wealth in the form of money (time and savings deposits) and bonds (especially government bonds with little default risk). By mid-2016, the value of real estate had surpassed its 2006 level, and households' wealth in stocks and pension funds was substantially higher than it was before the housing crisis.
Asset Demands
Typically, there is a trade-off among the four characteristics that make an asset desirable: a high expected return, safety (low risk), liquidity, and short time to maturity. For example, a safe and liquid asset with a short time to maturity, such as a checking account, is likely to have a low expected return. The essence of the portfolio allocation decision is determining which assets, taken together, achieve the wealth holder 's preferred combination of expected return, safety, liquidity, and time to maturity. In addition to the risk of each asset separately, the investor should also consider diversification, the idea that spreading out his or her investment in different assets with different characteristics can reduce overall risk because when one asset has a low return, another may have a high return.
The amount of each particular asset that a holder of wealth desires to include in their portfolio is their demand for that asset. Because all wealth must be held as some type of asset, the sum of a wealth holder's asset demands must equal their total wealth. For example, suppose that you have wealth of $10,000 and decide to hold $5000 in stock, $3000 in short-term bonds, $1000 in long-term bonds, and $1000 in cash. The sum of your four asset demands must equal your total wealth of $10,000.
7.3