The Overlapping Generations Model with Uncertainty
Let us now briefly consider the canonical overlapping generations model from Section 9.3 in Chapter 9. Time is discrete and runs to infinity. Each individual lives for two periods.
Suppose as in Section 9.3 that the utility of a household in generation t is given by
There is a constant rate of population growth equal to n, so that

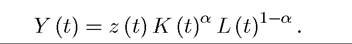
where L (0) is the size of the first generation. As in Section 9.3, we assume that the aggregate production technology is Cobb-Douglas but now also includes an aggregate stochastic shock z, which is assumed to follow a Markov process. Consequently, total output at time t is given by
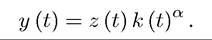
Expressing this in per capita terms
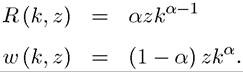
To simplify the notation, we also assume that capital depreciates fully, i.e., δ = 1. Factor prices clearly only depend on the current values of z and the capital-labor ratio k, and can 667
be expressed as (17.30)
The consumption Euler equation for an individual of generation t, then can be expressed as
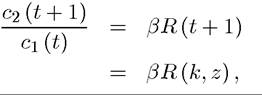
with R (k, z) given by (17.30). The total amount of savings at time t is then given by s (t) = s (k (t),z (t)) such that

which, as in the canonical overlapping generations model of Section 9.3 in Chapter 9 and also as in the baseline Solow growth model of Chapter 2, corresponds to a constant savings rate now equal to β/ (1 + β).
Now combining (17.31) with (17.29) and the fact that δ = 1, next date’s capital stock k (t + 1) can be written as
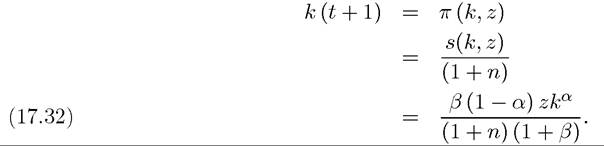
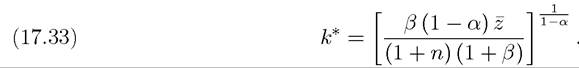
Clearly, if z = z, this equation would have a unique steady state with capital-labor ratio given by
However, when z has a non-degenerates distribution, (17.32) defines a stochastic first-order difference equation. As in the neoclassical growth model under uncertainty, the long-run equilibrium of this model will correspond to an invariant distribution of the capital stock. In this particular case, however, since (17.32) is very tractable, we can obtain more insights about the behavior of the economy with a diagrammatic analysis. Suppose that z is distributed between [zmin,zmax], then the behavior of the economy can be analyzed by plotting the stochastic correspondence associated with (17.32), which is done in Figure 17.1. The stochastic correspondence plots the entire range of possible values of k (t + 1) for a given value of k (t). The upper thick curve corresponds to the realization of zmax, while the lower thick curve corresponds to the realization of zmin. The dotted curve in the middle is for z = z. Observe that the curves for both zmin and zmax start above the 450 line, which is a consequence of the Inada condition implied by the Cobb-Douglas technology—the marginal product of capital is arbitrarily large when the capital stock is close to zero. The stochastic correspondence enables a simple analysis of the dynamics of stochastic models as in this case. For example, Figure 17.1 plots a particular sample path of capital-labor ratio in this economy, where starting with k (0), the economy first receives a fairly favorable productivity shock moving to k (1).
Following this, there is another moderately favorable productivity realization and the capital-labor ratio increases to k (2). In the following period, however, the realization of the stochastic variable is quite bad and the capital-labor ratio and thus output per capita decline sharply. This figure illustrates the type of dynamics that can emerge. Similar methods will be used in the next section in a somewhat richer model.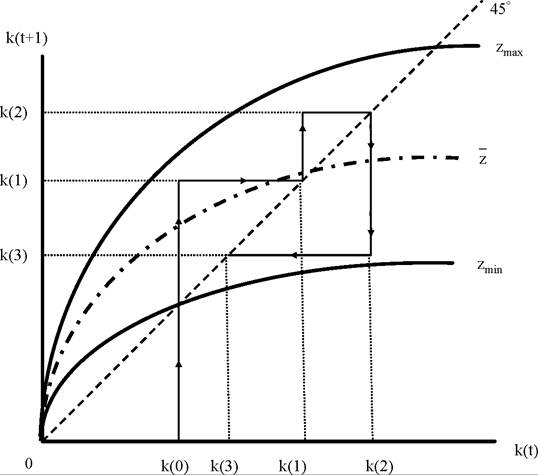
Figure 17.1. This figure shows the stochastic correspondence of the overlapping generations model. Any value for next period’s capital-labor ratio within the two curves marked ^mljll and zmax has positive probability. The path k (0) → k (1) → k (2) → k (3) illustrates a particular realization of the stochastic path of the equilibrium capital-labor ratio.
Another noteworthy feature of this model is that, together with the stochastic Solow model discussed in Exercise 17.3 and the specific form of the neoclassical growth model in Example 17.1, it provides a much simpler model of stochastic growth than the neoclassical growth under uncertainty. In the overlapping generations model and the Solow model, this is because saving decisions are “myopic” and remain unaffected by the distribution of stochastic shocks or even their realizations. Thus for the analysis of a range of macroeconomic questions, these more myopic models or the simple neoclassical model of Example 17.1 might provide a tractable attractive alternative to the full neoclassical growth model under uncertainty.
17.6.