The Sources of Economic Growth
Discuss the sources of economic growth and the fundamentals of growth accounting.
An economy's output of goods and services depends on the quantities of available inputs, such as capital and labor, and on the productivity of those inputs.
The relationship between output and inputs is described by the production function, introduced in Chapter 3:Y = AF (K, N). (6.1)
Equation (6.1) relates total output, Y, to the economy's use of capital, K, and labor, N, and to productivity, A.
If inputs and productivity are constant, the production function states that output also will be constant—there will be no economic growth. For the quantity of output to grow, either the quantity of inputs must grow or productivity
must improve, or both. The relationship between the rate of output growth and the rates of input growth and productivity growth is
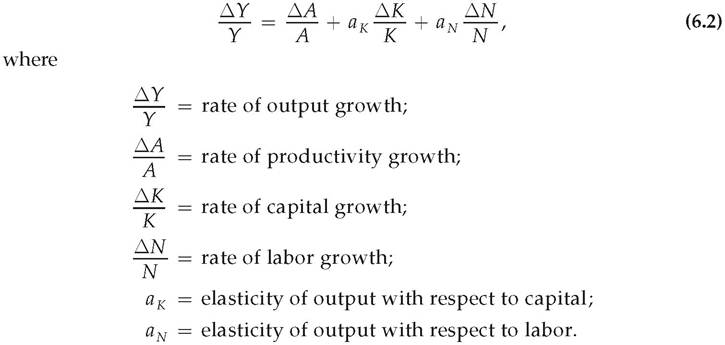
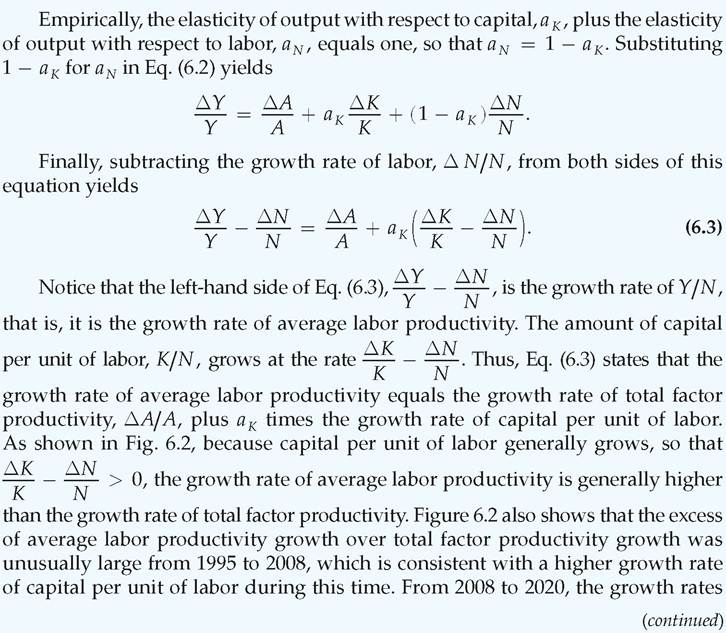
In Eq. (6.2) the elasticity of output with respect to capital, aκ, is the percentage increase in output resulting from a 1% increase in the capital stock, and the elasticity of output with respect to labor, aN, is the percentage increase in output resulting from a 1% increase in the amount of labor used. The elasticities aκ and aN both are numbers between 0 and 1 that must be estimated from historical data.[90]
Equation (6.2), called the growth accounting equation, is the production function (Eq. 6.1) written in growth rate form. Some examples will be helpful for understanding the growth accounting equation.
Suppose a new invention allows firms to produce 10% more output for the same amount of capital and labor. In terms of the production function, Eq. (6.1), for constant capital and labor inputs, a 10% increase in productivity, A, raises output, Y, by 10%.
Similarly, from the growth accounting equation, Eq. (6.2), if productivity growth, ∆A∣A, equals 10% and capital and labor growth are zero, output growth, ∆Y∕Y, will be 10%. Thus the production function and the growth accounting equation give the same result, as they should.Now suppose that firms' investments cause the economy's capital stock to rise by 10% (∆K∕K = 10%) while labor input and productivity remain unchanged. What will happen to output? The production function shows that, if the capital stock grows, output will increase. However, because of the diminishing marginal productivity of capital (see Chapter 3), the extra capital will be less productive than that used previously, so the increase in output will be less than 10%. Diminishing marginal productivity of capital is the reason that the growth rate of capital, ∆K∕K, is multiplied by a factor less than 1 in the growth accounting equation. For the United States this factor, aκ, the elasticity of output with respect to capital, is about 0.3. Thus the growth accounting equation, Eq. (6.2), indicates that a 10% increase in the capital stock, with labor and productivity held constant, will increase U.S. output by about 3%, or 0.3 ? 10%.
Similarly, the elasticity of output with respect to labor, aN, is about 0.7 in the United States. Thus, according to Eq. (6.2), a 10% increase in the amount of labor used (∆N∕N = 10%), with no change in capital or productivity, will raise U.S. output by about 7%, or 0.7 ? 10%.[91]
Growth Accounting
According to Eq. (6.2), output growth, ∆Y∕Y, can be broken into three parts:
1. that resulting from productivity growth, ∆A∕A,
2. that resulting from increased capital inputs, aκ ∆K∕K, and
3. that resulting from increased labor inputs, aN ∆N∕N.
Growth accounting measures empirically the relative importance of these three sources of output growth.
A typical growth accounting analysis involves the following four steps (see Table 6.2 for a summary and numerical example):■ Step 1. Obtain measures of the growth rates of output, ∆Y∕Y, capital, ∆K∕K, and labor, ∆N∕N, for the economy over any period of time. In the calculation of growth rates for capital and labor, more sophisticated analyses make adjustments for changing quality as well as quantity of inputs. For example, to obtain a quality-adjusted measure of N, an hour of work by a skilled worker is counted as more labor than an hour of work by an unskilled worker. Similarly, to obtain a quality-adjusted measure of K, a machine that can turn fifty bolts per minute is treated as being more capital than a machine that can turn only thirty bolts per minute.
■ Step 2. Estimate values for the elasticities aκ and aN from historical data. Keep in mind the estimates for the United States of 0.3 for aκ and 0.7 for aN.
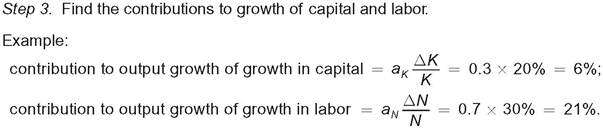
■ Step 3. Calculate the contribution of capital to economic growth as aκ ∆K∕K and the contribution of labor to economic growth as aN ∆N∕N.
■ Step 4. The part of economic growth assignable to neither capital growth nor labor growth is attributed to improvements in total factor productivity, A. The rate of productivity change, ∆A∕ A, is calculated from the formula
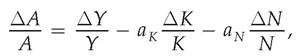
which is the growth accounting equation, Eq. (6.2), rewritten with ∆A∕A on the left side. Thus the growth accounting technique treats productivity change as a residual—that is, the portion of growth not otherwise explained.[92]
TABLE 6.2
The Steps of Growth Accounting: A Numerical Example
Step 1. Obtain measures of output growth, capital growth, and labor growth over the period to be studied.

Step 2. Using historical data, obtain estimates of the elasticities of output with respect to capital and labor, aκ and aN.
| Example: | aκ = 0.3 and aN = 0.7. |
Step 4. Find productivity growth as the residual (the part of output growth not explained by capital or labor).
Example:

Growth Accounting and Productivity Trends. What does growth accounting say about the sources of U.S. economic growth? Among the best-known research using the growth accounting framework was done at the Brookings Institution by Edward Denison. Table 6.3 summarizes Denison's findings for the period 1929-1982 and provides more recent data from the Bureau of Labor Statistics covering the period 1982-2020.
The last entry in column (4) shows that, over the 1929-1982 period, output grew at an average rate of 2.92% per year. According to Denison's measurements (column 4), the growth of labor accounted for output growth of 1.34% per year. The growth of labor in turn resulted primarily from an increase in population, an increase in the percentage of the population in the labor force, and higher educational levels, which raised workers' skills. (Offsetting these trends to a degree was a decline in the number of hours worked per person.) According to Denison, the growth of the capital stock accounted for output growth of 0.56% per year. So, taken together, labor and capital growth contributed 1.90% to the annual growth rate of output.
The difference between total growth (2.92%) and the amount of growth attributed to capital and labor growth (1.90%) is 1.02%. By the growth accounting method, this remaining 1.02% per year of growth is attributed to increases in productivity.
Thus, according to Denison, increased quantities of factors of productionTABLE 6.3
Sources of Economic Growth in the United States (Percent per Year)
| (1) 1929-1948 | (2) 1948-1973 | (3) 1973-1982 | (4) 1929-1982 | (5) 1982-2020 | |
| Source of Growth | |||||
| Labor growth | 1.42 | 1.40 | 1.13 | 1.34 | 0.94 |
| Capital growth | 0.11 | 0.77 | 0.69 | 0.56 | 1.23 |
| Total input growth | 1.53 | 2.17 | 1.82 | 1.90 | 2.18 |
| Productivity growth | 1.01 | 1.53 | -0.27 | 1.02 | 0.85 |
| Total output growth | 2.54 | 3.70 | 1.55 | 2.92 | 3.02 |
Sources: Columns (1)-(4) from Edward F. Denison, Trends in American Economic Growth, 1929-1982, Washington, DC: The Brookings Institution, 1985, Table 8.1, p. 111. Column (5) from Bureau of Labor Statistics website, Total Factor Productivity Trends, available at www.bls.gov/productivity/tables/total-factor-productivity- major-sectors-historical.xlsx.
and improvements in the effectiveness with which those factors were used both played an important role in U.S.
growth after 1929.Data for three shorter periods are given in columns (1)-(3) of Table 6.3. This breakdown highlights a striking conclusion: Productivity growth during 1973-1982 was negative (fourth entry in column 3). In other words, Denison estimated that any combination of capital and labor would have produced less output in 1982 than it could have in 1973! (See the Application "Waves of Productivity Growth over Time," for various hypotheses to explain this drop in productivity.) Comparing columns (2) and (3) reveals that the decline in U.S. productivity growth between the 1948-1973 and 1973-1982 periods of 1.80 percentage points (1.53 minus -0.27) accounts for the bulk of the overall slowdown in output growth between those periods of 2.15 percentage points (3.70 minus 1.55).
The slowdown in productivity growth after 1973 reported by Denison was confirmed by other studies, both for the United States and for other industrialized countries. This slowdown generated widespread concern, because a sustained reduction in the rate of productivity growth would have an adverse effect on future real wages and living standards. In addition, to the extent that future Social Security benefits will be paid by taxing the wage income of future workers, a longterm productivity slowdown would threaten the future of the Social Security system. But will the productivity slowdown continue? To shed light on this question, the final column of Table 6.3 extends Denison's calculations by adding 38 years of more recent data. During the period 1982-2020, productivity grew at an average annual rate of 0.85%. Although the return to a positive rate of productivity growth was a welcome development, the 0.85% growth rate was less than two-thirds of the productivity growth rate seen during the 25-year period preceding the 1973 slowdown. But beginning in the second half of the 1990s, productivity growth increased. From 1995 to 2007 (before the financial crisis), it averaged 1.33% per year, which is only 0.20 percentage points lower than it was from 1948 to 1973. For more details, see the Application "The Rebound in U.S. Productivity Growth."
Although advances in information technology continue, gains in total factor productivity since 2007 have been meager (only 0.27% per year from 2007 to 2020, according to the Bureau of Labor Statistics (BLS), as compared to 1.33% per year from 1995 through 2007). What's going on? It's too soon to know for sure, but it may be that the financial crisis from 2008 to 2009 and the pandemic recession in 2020 hampered productivity growth. For example, with credit tight in the years after the crisis, firms were less inclined to invest in research and development or to upgrade their plant and equipment. There were also many fewer new firms starting up, which impeded the introduction of new products and production techniques. Moreover, high rates of unemployment may have caused the skills of some workers to deteriorate. Each of these factors could lead to slower growth in productivity, at least for a time.
Application
The Rebound in U.S. Productivity Growth
Our discussion of productivity growth in Table 6.3 showed that although productivity growth slowed in the period from 1973 to 1982 (indeed total factor productivity growth was negative), it began to grow more rapidly after 1982. In the late 1990s, labor productivity grew far more rapidly than it had for the preceding 20 years. Since then, labor productivity (output per hour in the nonfarm business sector) and total factor productivity (A in Eq. 6.1) have continued to grow, and economists have developed new explanations for that growth.
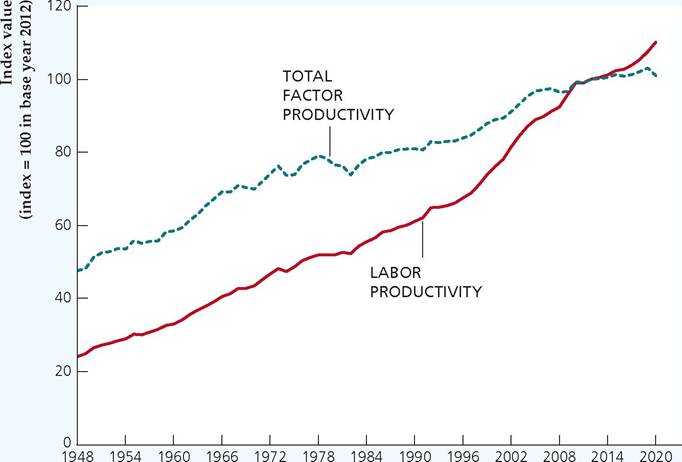
Figure 6.1 shows that both labor productivity and total factor productivity grew fairly steadily since bottoming out in 1982, until the financial crisis began in 2008, when the economy slowed abruptly along with total factor productivity. Labor productivity has grown somewhat faster than total factor productivity. (Note that both of the variables are indexed to have a value of 100 in year 2012. So, the levels of the indexes themselves have no inherent meaning.)
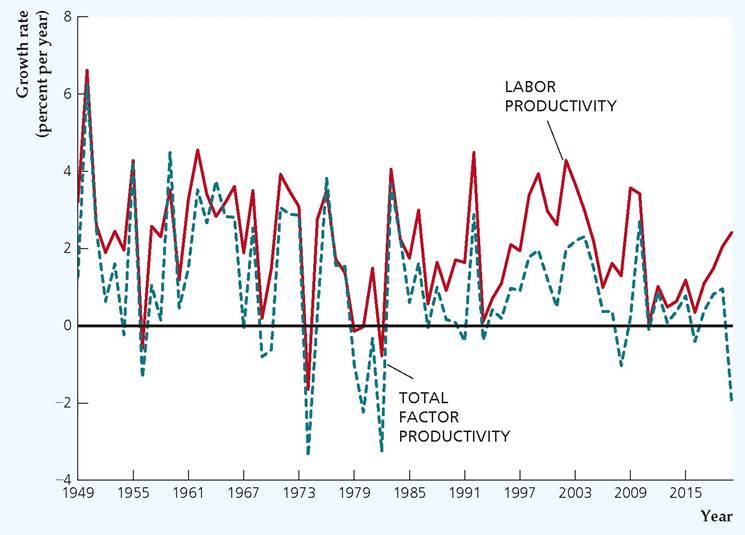
Figure 6.2 shows the growth rates of the productivity measures and illustrates a widening gap between labor productivity growth and total factor productivity growth from 1995 to 2008. After 2008, productivity growth slowed substantially for both productivity measures. To understand the relationship between the growth rates of total factor productivity and average labor productivity, recall Eq. (6.2), which is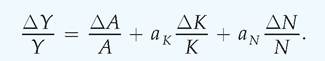
FIGURE 6.1
Productivity levels, 1948-2020
The chart shows annual values for labor productivity (output per hour in the nonfarm business sector) and total factor productivity (variable A in Eq. 6.1) for the period 1948-2020.
Sources: Labor productivity: Bureau of Labor Statistics, Nonfarm Business Sector:
Output Per Hour of All Persons, available at fred. stlouisfed.org/series/OPHNFB. Total factor productivity: Bureau of Labor Statistics, Total Factor Productivity Trends, available at www.bls.gov/ productivity/tables/total-factor- productivity-major-sectors.xlsx.
Year
FIGURE 6.2
Productivity growth, 1949-2020
The chart shows annual values of labor productivity growth and total factor productivity growth for the period 1949-2020.
Sources: Same as Fig. 6.1.
of capital and labor were similar, so the gap between the growth rates of the two productivity measures is much smaller than it was earlier.
The rise in labor productivity growth in the second half of the 1990s has mostly been attributed to the revolution in information and communications technologies (ICT). Recently, research by economists has challenged that view. One reason why economists have looked more carefully at this issue is that many other countries also invested heavily in ICT but did not reap the same labor productivity rewards as in the United States.
Why did the United States see an appreciable gain in labor productivity from ICT, but Europe did not? Researchers have discovered a number of reasons.[93] European firms are subject to substantially more government regulations than U.S. firms and consequently are slower to adopt new technologies. Government- owned firms in Europe often stifle innovation because of a lack of competitive pressure. Government regulations have also prevented the existence in Europe of "big box" retail outlets that efficiently provide goods to consumers, as in the United States. Shortages of workers in Europe who have the skills needed to use the new technologies have also slowed their adoption. In the United States, adaptable capital markets and research universities that foster innovation have contributed to the adoption of new technologies.
Another puzzle that has occupied researchers studying productivity is that, although economists attribute productivity gains to ICT investment, the timing is strange: There appears to be a long lag between investment in ICT and a rise in productivity. U.S. firms invested heavily in computers in the 1980s, but productivity growth did not rise very much—not nearly as much as it has since 1995. In addition, ICT investment fell sharply in 2000, but productivity growth remained strong. As we discussed in the Application "Waves of Productivity Growth over Time," this weak link in timing between ICT investment and productivity improvements may arise because the use of ICT requires more than just buying computers—it takes research and development expenditures, reorganization of the firm, and training of workers. These activities, which economists call investment in intangible capital, take time and may temporarily cause a firm's output to decline rather than to rise. Thus, investment in intangible capital can help explain the lag between increases in ICT investment and productivity growth.
Is the increase in productivity from 1995 to 2008 unique in U.S. history? Not at all. In fact, researchers have identified three similar periods in our past: 1873 to 1890, following the Civil War; 1917 to 1927, following World War I; and 1948 to 1973, following World War II.[94] In each of these episodes, productivity improvements led to a substantial increase in the U.S. standard of living. New technologies included steam power, railroad transportation, and communication by telegraph in the late 1800s; electrification in factories after World War I; and the transistor after World War II. Each of these periods was characterized not only by new technology but also by changes in how business firms were organized and by investments in workers (education and training).
Beginning around 2008, productivity growth slowed. Economists have debated the causes of this slowdown, with three main explanations: measurement issues, a lack of important technological innovations, and firms failing to keep up with technology. First, government statisticians may have trouble keeping up with technology, especially accounting properly for intangible investment.[95] Second, major technology improvements may have been exhausted, so the economy is in a phase with low productivity growth.[96] Third, firms may simply be unable or unwilling to keep up with technological change, perhaps because of a lack of competition between firms.[97]
In the Internet age, the apps on our smartphones certainly make it seem that we are in a new era of enhanced productivity. But the benefits of technology may help people in ways that do not show up in the GDP or productivity statistics. As David M. Byrne of the Federal Reserve Board, John G. Fernald of the Federal Reserve Bank of San Francisco, and Marshall B. Reinsdorf of the International Monetary Fund note, "Consumers are more productive in using their nonmarket time to produce services they value. These benefits raise consumer well-being but do not imply that market sector production functions are shifting out more rapidly than measured."[98] Thus, the reasons for the slowdown in productivity growth are less about mismeasurement than just a change in the structure of the goods and services that consumers use.
The lesson from history is that productivity growth varies over time, as innovations and the ability of U.S. firms to adapt and use new technology changes. Though comparisons to historical periods suggest that productivity growth has been very slow since 2008, consumer welfare may actually be improving substantially.
9See Carol A. Corrado and Charles R. Hulten, "How Do You Measure a 'Technological Revolution'? American Economic Review, May 2010, pp. 99-104.
10See Robert J. Gordon, 2016. The Rise and Fall of American Growth. Princeton: Princeton University Press.
11See Martin Neil Baily and Nicholas Montalbano, "Why Is U.S. Productivity Growth So Slow? Possible Explanations and Policy Responses," The Brookings Institution, Hutchins Center Working Paper #22, September 2016.
12"Does the United States Have a Productivity Slowdown or a Measurement Problem?" Brookings Papers on Economic Activity, Spring 2019, pp. 109-182.
6.2
More on the topic The Sources of Economic Growth:
- Background Context
- Hansen and the Keynesian Network
- The Representative Firm
- Conclusion
- Sources of Contemporary Institutionalist and Evolutionary Theory: Four Unconventional Economists
- Bibliography
- Problems of Economic Dynamics
- References and Literature
- Building a GoodJobs Economy
- Joseph Alois Schumpeter