Equity Markets
The growth in China’s stock markets is evident in Table 8.3, which reveals the expansion in the number of listed companies, total market capitalization, and trading volume over the 1992-2006 period.
Relative to the size of China’s economy, however, as reflected in GDP data, the upward trend is seen to temporarily break down after 2000. Despite a big increase from 2005 to 2006, total market capitalization remained, at just over 42% of GDP, still lower than in 2000 - when it exceeded 48%. In percentage terms the biggest advances, in both market capitalization and trading volume, occurred in 1993 and 1996. The 1993 gains, of course, occurred as the stock exchanges were just getting going and so built upon only a very small base. Meanwhile, the 1996 advance saw market capitalization nearly triple from RMB 347 billion to RMB 984 billion, while annual trading volume - for the Shanghai and Shenzhen markets combined - rose from 70 billion shares in 1995 to 253 billion shares in 1996. In retrospect, this was a major volume jump, with trading volumes subsequently increasing much moreTable 8.3. The Growth of China’s Stock Markets, 19922006
| Year | Number of Listed Companies | Total Market Capitalization (billions of renminbi) | Total Market Capitalization as Percentage of GDP | Total Trading Volume (millions of shares) |
| 1992 | 53 | 104.81 | 3.89% | 3,795 |
| 1993 | 183 | 353.10 | 9.99% | 23,422 |
| 1994 | 291 | 369.06 | 7.66% | 201,334 |
| 1995 | 324 | 347.43 | 5.71% | 70,547 |
| 1996 | 530 | 984.24 | 13.83% | 253,314 |
| 1997 | 745 | 1,752.92 | 22.20% | 256,079 |
| 1998 | 851 | 1,950.56 | 23.11% | 215,411 |
| 1999 | 949 | 2,647.12 | 29.52% | 293,239 |
| 2000 | 1,088 | 4,809.09 | 48.47% | 475,840 |
| 2001 | 1,160 | 4,352.22 | 39.69% | 315,229 |
| 2002 | 1,200 | 3,832.91 | 31.85% | 301,618 |
| 2003 | 1,263 | 4,245.77 | 31.26% | 415,808 |
| 2004 | 1,353 | 3,705.56 | 23.18% | 582,773 |
| 2005 | 1,357 | 3,243.03 | 17.71% | 662,373 |
| 2006 | 1,411 | 8,940.39 | 42.69%a | 1,614,523 |
Note: Data include Shanghai “A” and “B” shares and Shenzhen “A” and “B” shares.
a Based on preliminary data from China's National Bureau of Statistics.
Sources: Great China Database; National Bureau of Statistics of China (http://www.stats.gov.cn/ english); People's Bank of China (http://www.pbc.gov.cn); Organisation for Economic Cooperation and Development (2003); and author's calculations.
gradually and remaining below 500 billion shares until 2004. Ironically, the 1996 advance may well have been tied to the aforementioned bond futures trading suspension in May 1995. Poon, Firth, and Fung (1998) identify an improvement in equity market liquidity following the May 1995 intervention - with the gains derived from a forced shift of investors away from the closed bond futures market seemingly offsetting any loss of investor confidence owing to the suspension.
The short history of China's stock exchanges is, in fact, dominated by the effects of government administrative measures that have produced sudden - actual or anticipated - jumps in the supply and demand for shares. Almost from the outset, both the Shanghai and Shenzhen stock markets had two initially quite separate classes of shares: “A” shares for domestic residents and “B” shares for foreigners. Trading of “B” shares commenced on February 21,1992 in Shanghai - quoted and settled in US dollars - and February 28, 1992 in Shenzhen - in this case quoted and settled in Hong Kong dollars. Companies wishing to issue “B” shares had to meet stricter requirements, including having an audit performed by an international accounting group
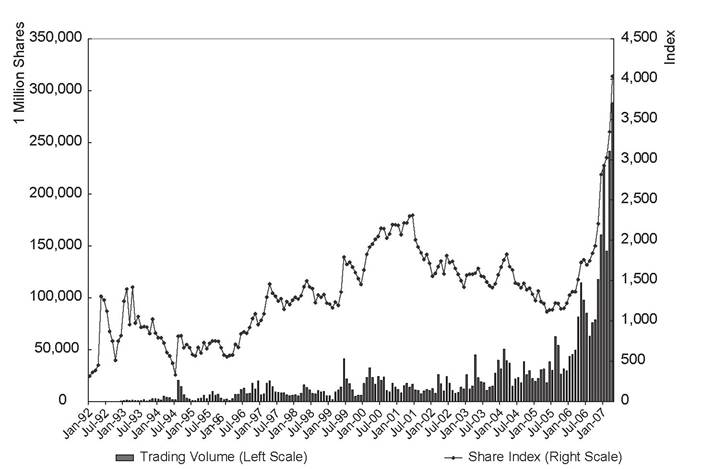
Figure 8.1. Shanghai “A” Share Index Values and Trading Volume. Source: Great China Database.
as well as demonstrating a proven record of profitability or minimum return on capital (see Ma, 1996). Substantially lower “B” share prices, relative to “A” shares of the same company, raised the possibility of more speculative, less risk-averse market sentiment among local investors.
Ma (1996) finds a significant role for this sentiment effect in accounting for some of the “B” share discount but also points to stronger reactions to regulatory changes on the part of local investors. For example, an austerity plan adopted to rein in inflation in 1993, which had the effect of restricting the flow of funds into the nation’s stock markets, produced much larger declines in “A” shares than in “B” shares, narrowing the discount. Meanwhile, the market rescue plan adopted on July 30, 1994, which temporarily froze new equity issues as well as allowing more money into the market, produced a much larger advance in the “A” shares than in the “B” shares. Indeed, as Ma (1996, p. 237) points out, the Shanghai “A” share index rose by over 100% in a single week after this plan was announced. This advance at the end of July 1994, as well as the preceding sharp decline in the “A” share index, can also be seen in Figure 8.1, which plots the movements in the Shanghai “A” share index, and corresponding trading volumes, over the January 1992-April 2007 period. Wang, Burton, and Power (2004, p. 439) find that greater volatility in “A” shares relative to “B” shares persisted over the August 1994-July 2000 period - with “A” shares revealing a consistently stronger tendency to overreact to both good and bad news.
Later policy changes have removed the strict separation between the “A” and “B” share markets. The purchase of “B” shares by domestic individuals was legalized in February 2001, whereas limited foreign investor entry into the “A” share market was approved in December 2002. Correlations between “A” and “B” shares increased sharply after the February 2001 opening up of the “B” share market, rising above 65% for both Shanghai and Shenzhen over the 2001-2003 period compared to a less than 30% correlation earlier on (Chiu, Lee, and Chen, 2005, p. 278).[132] Another major regulatory change was the relaxation of restrictions, starting from September 1999, on the purchase of equities by state-owned enterprises (SOEs) and other institutional investors (Wong, 2006, pp.
398-399). The sharp stock market advance during 1999-2001 was likely significantly influenced by these developments. As shown in Figure 8.1, the Shanghai “A” share market rose from around 1,200 in early 1999 to nearly 2,500 in the summer of 2001. However, after rising in the face of a new source of government-led demand for equities, the markets then declined substantially on fears of a government-led influx of new supply. This involved the June 2001 announcement of China’s State Council’s plans to sell off substantial portions of the government’s remaining ownership stake in listed SOEs.The government had previously kept share supply under tight control, using an explicit quota on total IPO issuance from 1993-1998 - a selfimposed restriction that began to be relaxed in 1999 but was not formally abolished until 2001 (see Wong, 2006). The market continued to fall even after the sell-off plan was officially scrapped in June 2002, with the Shanghai “A” share index dropping back to 1990s levels by early 2005. This drop likely reflected fresh worries about increased government-led share supply in 2003-2005. The government’s new push to privatize some of its SOEs - which were typically more than 95% government-owned - threatened to unleash large amounts of additional traded shares onto the market. Chow (2007, p. 250) states that the “government had to stop such selling several times and design schemes to prevent its significant depressing effect on the prices of traded shares.”
A major rule change in January 2006 sought to finally resolve the market overhang represented by the large set of nontradable shares that, unlike the “A” and “B” shares, cannot be transferred without special administrative approval. Such shares still accounted for approximately two-thirds of total Shanghai and Shenzhen stock market capitalization in 2005. During 2005, the government began implementing a plan to convert such shares into tradable “A” shares (Shenzhen Daily, November 7, 2005).
Econometric evidence of favorable investor reaction to the earlier stages of the nontradable share reform process arises from Feng and Xu (2007) - who identify significant abnormal returns for a small set of “pilot” companies that began the process of releasing nontradable shares onto the market on April 29, 2005.[133] The government took further steps to deepen the market on January 31, 2006 by allowing “strategic” foreign investors to purchase “A” shares rather than being restricted to nontradable shares. Such foreign investors, who had typically remained shut out of the “A” share market before, were not only allowed entry but permitted to purchase stakes of more than 10% - albeit subject to a three-year “lockup” period. Dyer (2006, p. 17) points to this pending rule change as a “factor behind [the]... rebound in China’s stock market, which [rose]... 13 per cent in... two months [during November 2005-January 2006] after a four-year slump.”Needless to say, the advance that began in late 2005 subsequently accelerated in 2006-2007. It is important to note, however, that this rally came after an extended period of nonperformance. As shown in Figure 8.2, the Shanghai “A” share index in June 2006, even after more than six months of gains off the 2005 lows, was still almost unchanged from its January 2000 value. Even in mid-2006, the Shanghai index still marginally lagged the performance of Hong Kong’s Hang Seng index since January 2000, while only slightly bettering the performance of the US S&P 500 index. The near 130% advance from June 2006-June 2007 seems less remarkable when one considers that this figure also represents almost all the total gains realized over the preceding seven and a half years - for an overall impressive but far from unprecedented average of around 20% per year.
More on the topic Equity Markets:
- Article 6.8 Great Portland strikes with convertible bond
- The Role of Finance and Financial Markets
- References
- Testing Modigliani-Miller for Banks
- Conclusion
- Bibliography
- Fligstein Neil. The Banks Did It: An Anatomy of the Financial Crisis. Harvard University Press,2021. — 334 p., 2021
- References