Exchange Rate Expectations, Capital Flows, and Pressure for Appreciation
The market for forward contracts in a currency, with prices agreed upon now for delivery at a set future date, can provide useful insights into exchange rate expectations. Expectations of currency depreciation typically lead forward contracts forthat currency to trade at values below today’s spot market price, that is, producing a forward exchange discount, while expectations of currency appreciation should be associated with a forward exchange premium.
Mainland China’s own foreign exchange market has offered little beyond spot market transactions, however. The interbank foreign exchange market established in 1994 did not provide for forward and swap transactions until August 2005, following the new exchange rate regime adopted in the preceding month. Meanwhile, daily turnover in China’s foreign exchange market reached only $US 0.83 billion in 2004, compared to $US 102 billion in Hong Kong, $US 125 billion in Singapore, and $US 199 billion in Japan (Zhang and Liang, 2006, p. 71). Individuals and businesses seeking to hedge their exposure to renminbi have typically had to rely upon offshore markets, therefore, where an alternative “nondeliverable” forward market emerged in the late 1990s, with quite active trading in Hong Kong and Singapore and, increasingly, the United States.The nondeliverable forward market for the renminbi is a cash-settled futures contract, whose value reflects the expected exchange rate of the renminbi in terms of the US dollar. Expectations of renminbi appreciation are first evident in the RMB/$US forward data from November 13, 2002, when the renminbi moved from a forward discount to a forward premium (Figure 1.4). The new forward premium for the renminbi implied that market participants expected the US dollar to exchange for fewer renminbi in the future (i.e., at less than the old 8.28 pegged rate) and was followed by an increase in the daily contract volume to over $US 600 million (Fung, Leung, and Zhu, 2004).
The implied expected appreciation peaked around 6% in the first half of 2005 before falling back somewhat in the face of the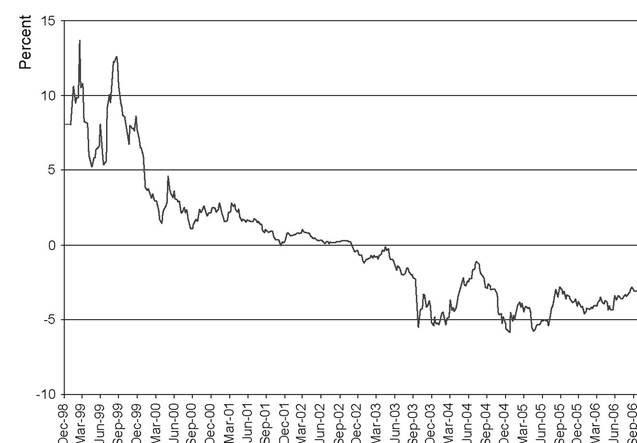
Figure 1.4. Expected Change in the RMB/$US Exchange Rate (One Year Nondeliverable Forward Contract). Source: Bloomberg.
actual 2.1% appreciation imposed by the Chinese authorities on July 21, 2005. An earlier spike in revaluation pressure occurred in September- December 2003 in the midst of rising US emphasis on renminbi revaluation reflected in congressional initiatives and a series of strong statements by administration officials - as well as an October 7, 2003 rumor from Japan that renminbi revaluation was imminent (see Zhang, 2004, p. 246).[8]
The expected appreciation implied by the nondeliverable forward market persistently exceeded actual appreciation over the 2002-2006 period. As pointed out by Higgins and Humpage (2005), this likely reflects the effects of the so-called “peso problem,” whereby market participants seek protection against a possible sudden, large adjustment. In the case of the renminbi, attaching even a small probability to major revaluation would be sufficient to push the appreciation implied by the nondeliverable forward market persistently above the actual exchange rate moves. Although the
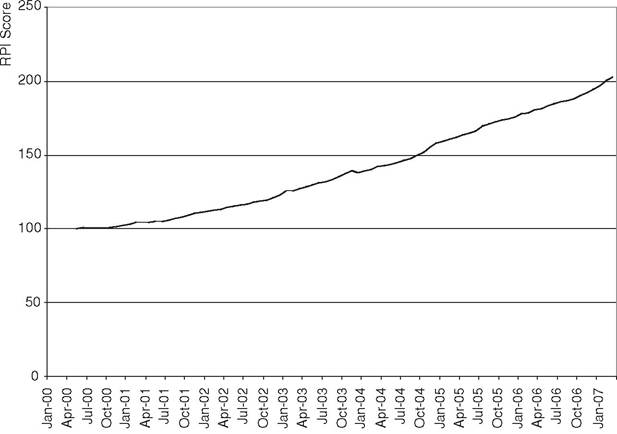
Figure 1.5. Renminbi Pressure Indicator. Source: Milken Institute.
emergence of this effect in 2002 preceded the actual policy move by three years, there was certainly tangible evidence of rising pressure for renminbi appreciation at the time. The falling real exchange rate discussed earlier was accompanied by rising levels of capital inflows and growing foreign exchange reserves.[9] According to the “Renminbi Pressure Indicator” developed jointly by Xinhua Finance and the Milken Institute, the pressure for appreciation rose by over 25% between 2000 and 2002 before further intensifying to a level of 202.7 in March 2007 relative to its base of 100.0 in 2000 (see Figure 1.5).[10] Although this rise in the indicated pressure level takes into account exchange rate changes and domestic interest rate changes, the largest contributor became the soaring level of foreign exchange reserves, which reached $US 1.33 trillion in June 2007 for a 41.6% year-on-year increase.
A key policy question is whether this reserve buildup reflects a fundamental imbalance that justifies more substantial renminbi appreciation or that it has, instead, been made up of more speculative capital inflows hoping to benefit either from self-fulfilling expectations of a further shift in exchange rate policy or from participation in mainland China’s recently explosive asset markets.Just as expectations of renminbi revaluation first emerged in 2002, so too did errors and omissions in China’s balance of payments turn positive in that year after many years of deficit. This latter development suggested that prior capital flight out of the renminbi had reversed and is likely indicative of unrecorded capital inflows into China. Although the renminbi was made fully convertible for current account transactions in 1996, mainland China’s official capital account has remained officially closed other than to FDI and a small range of other transactions.[11] The ongoing restrictions have kept China’s capital account ranked as the most closed in the Asian region (Anderson, 2006b, pp. 18-19). To the extent that flows of funds into and out of China take place outside the formally authorized range of activities, they will be captured only in the errors and omissions section of the official balance of payments statistics. Anderson (2006b, p. 24) describes how some of these unauthorized flows have been engineered:
[D]uring the 1990s trading companies routinely overstated the value of import shipments in order to take money out of the country, and banks and firms shuttled a great deal of unrecorded cash across borders as well. In the first half of this decade, banks took strong advantage of regulatory loopholes to borrow offshore and repatriate the funds to invest in China.
The deficit in the errors and omissions category peaked at $US -22.1 billion in 1997 during the Asian financial crisis (see Table 1.3). The subsequent movement into positive territory during 2001-2004 reached $US 26.8 billion in 2004, with waning demand for dollar deposits by Chinese residents offering further evidence of expected future renminbi strength (Hu, 2005, p.
364). The errors and omission category returned to deficit in the year of the July 21, 2005 exchange rate reform, however, accompanied by a decline in China’s capital account surplus that set in just as the current account surplus was accelerating. After standing at over $US 100 billion in 2004, the capital account surplus was just $US 10 billion in 2006, with strong portfolio outflows nearly offsetting FDI of $US 63 billion (see Cohen, 2007). These developments have occurred on the heels of an apparent riseTable 1.3. MainlandChinaBalanceofPaymentsandReservesPosition, 19902006
Foreign Exchange Net Errors and
| Exports | Imports | Reserves | Omissions | |
| 1990 | 62,091 | 53,345 | 29586.2 | -3205.17 |
| 1991 | 71,910 | 63,791 | 43674.3 | -6766.93 |
| 1992 | 84,940 | 80,585 | 20620.4 | -8211.15 |
| 1993 | 91,744 | 103,959 | 22386.9 | -10096.40 |
| 1994 | 121,006 | 115,614 | 52914.1 | -9100.25 |
| 1995 | 148,780 | 132,084 | 75376.7 | -17823.20 |
| 1996 | 151,048 | 138,833 | 107039.0 | -15504.00 |
| 1997 | 182,792 | 142,370 | 142762.0 | -22121.80 |
| 1998 | 183,712 | 140,237 | 149188.0 | -18901.80 |
| 1999 | 194,931 | 165,699 | 157728.0 | -17640.50 |
| 2000 | 249,203 | 225,094 | 168278.0 | -11747.90 |
| 2001 | 266,098 | 243,553 | 215605.0 | -4732.46 |
| 2002 | 325,596 | 295,170 | 291128.0 | 7503.53 |
| 2003 | 438,228 | 412,760 | 408151.0 | 17985.40 |
| 2004 | 593,326 | 561,229 | 614500.0 | 26834.20 |
| 2005 | 761,953 | 659,953 | 821514.0 | -16440.60 |
| 2006 | 969,380 | 791,605 | 1068490.0 | n.a. |
Source: All data are as reported in the International Monetary Fund's International Financial Statistics database and are in millions of US dollars.
stayed relatively low.[12] An asset bubble in the stock market did seem to be a real danger later on, however, even though available data suggest that the “hot flows” dissipated after the July 21, 2005 policy move. The main Shanghai index rose by 130% in 2006 in a strong advance that continued into 2007, as discussed further in Chapter 8.
More on the topic Exchange Rate Expectations, Capital Flows, and Pressure for Appreciation:
- Exchange Rate Expectations, Capital Flows, and Pressure for Appreciation
- The Evolution of the People’s Republic’s Exchange Rate Policy