PORTFOLIO CONSTRUCTION
We have already learned that the type of contractual agreement is based on a fixed rated annuity type of financial instrument where the obligor pays out a stream of principal and interest payments where their sum is always equal through the payment time intervals.
Therefore, the payments of interest (i.e., income) are decreasing, and payments of principal capital are increasing through time.To construct a portfolio that contains loans with a certain target allocation, we first modeled a direct approach to portfolio construction, where an investor invests in a certain number of loans and funds them fully. We investigated a portfolio that allocates capital across the toprated rating classes A to G according to the target allocation recommended by Lending Club. Table 13.2 shows this target allocation.10
To simulate the direct investment approach, we select loans from each loan grade from the entire population of loans. For example, to arrive at an allocation of 27 percent of A-rated loans, we randomly select 270 A-rated loans from the entire Lending Club loan book. To make sure that they contain each sub-rating, we split the selection evenly across sub-grades A1 to A5, which turns out to be 52 loans of each sub-grade for A-rated loans (270 divided by 5). Then we follow the same procedure for the remaining loan grades and selected 420 B-rated loans, 130 C-rated loans, 100 D-rated loans, 50 E-rated loans, 20 F-rated loans, and 10 G-rated
TABLE 13.2 Recommended target allocation across loan grades
| Loan grade | Target allocation |
| A | 27% |
| B | 42% |
| C | 13% |
| D | 10% |
| E | 5% |
| F | 2% |
| G | 1% |
Data source: Lending Club, as of May 21, 2015
loans, again evenly distributed across sub-grades.
We end up with a portfolio consisting of 1,000 loans spread across all sub-ratings.11 This is a simplification to approximate the target allocation, which is somewhat imprecise because the nominal amounts of each loan vary in size. Still, it approximates the exposure of institutional investors to marketplace lending.Conversely, private investors practice an indirect investment approach. They allocate capital across several loans in small tranches. For example, an investor may choose to allocate an amount of capital across different rating classes with a tranche of $25 per loan. To model the indirect approach, we need to make sure that lenders have equal exposure to each loan, so we multiply the expected profit or loss with a weighting factor that corresponds with equal exposure. To model the indirect approach, we sum the loans of each loan grade and calculate their share of the entire portfolio. Then we adjust this share to match the target allocation from Table 13.2. We now hold a portfolio with partial loans that models how a retail investor might invest in Lending Club.
For simplicity’s sake, we assume that investors allocate their capital all at the same time and then hold the portfolio until the term of the last loan has completed. We understand that lenders will re-invest capital when it becomes available, but we have omitted this here to keep things tidy. Figure 13.2 shows the distribution of the capital investment for 1,000 sample portfolios in the indirect investment approach.
13.3.1 Portfolio exposure
Because marketplace loans are unsecured, the exposure of the portfolio is inherently collateralized, or recovered, by using the interest income. In this case, the net exposure is correlated to interest income and counterparty risk12 that is when a counterparty defaults it will directly impact the degree of net exposure; in other words the portfolio is also exposed to specific wrong way risk. On the other hand, due to the fact that the market interest rates are fixed, market volatilities will not impact the net exposure.13 As we already discussed, markets, i.e., interest rates, drive the net exposure and counterparty risk. Figure 13.3 shows the exposure of one sample portfolio that consists of 1000 randomly selected Lending Club loans across loan grades A1 to G5. Net credit exposure indicates the expected credit losses in the event of default. As can be observed from Figure 13.3 the greatest degrees of exposures appear in contracts 350 to 700 which are rated between B and C. Contracts with ratings B and C make up the lion’s share of portfolios of marketplace loans. As a result, when borrowers with credit ratings B and C underperform, portfolio performance suffers disproportionately.
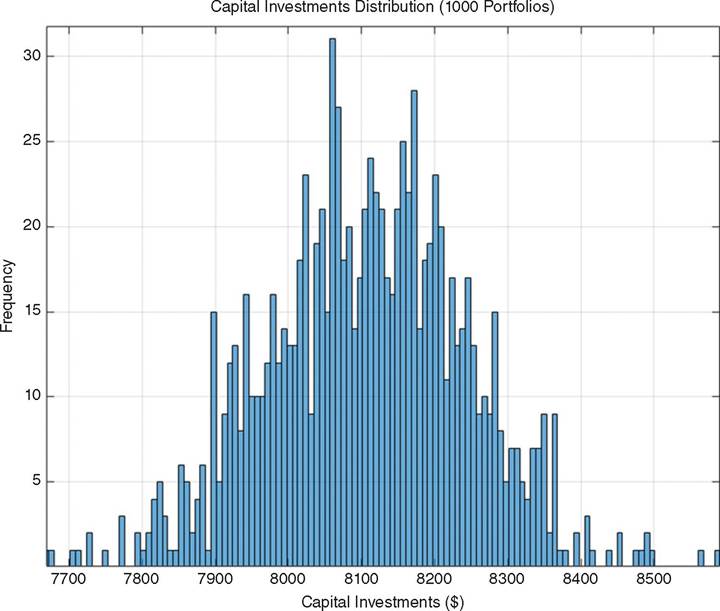
FIGURE 13.2 Distribution of capital investment, of 1,000 sample portfolios
13.4