The United States vs. China
China’s rise to prominence both in terms of global trade and bilateral trade with the United States has been quite extraordinary. China became the world’s third largest exporter in 2005, and in 2006 overtook Japan to become the United States’ second largest trading partner (after Canada).
As has been widely noted, the pegged exchange rate of 8.28 renminbi per dollar maintained by China until July 21, 2005, meant that dollar depreciation could not make US goods cheaper in China in the way that US goods prices were falling in terms of euros, pounds, or yen. Concern that the renminbi remained too cheap in dollar terms in spite of the post-July 2005 appreciation ensured that “China bashing” remained very much in vogue in 2007-2008, threatening, in fact, to surmount the heavy level of “Japan bashing” that emerged in the 1980s. As further confirmation of the changing world situation, the United States’ former role as Japan’s largest trading partner was, for the first time, surmounted by mainland China over the fiscal year ending in March 2007. In contrast to the mushrooming US bilateral trade deficits with China, Japan actually enjoyed a bilateral surplus even as its imports from China reached an all-time high, rising by 13% over the year (Nakamoto, 2007, p. 5). Other East Asian economies have also generally run bilateral trade surpluses with China. To some extent this reflects Asian neighbors like Korea and Taiwan, as well as Japan, using China as the final assembly point for their own US-bound exports - leading Jin and Li (2007 - emphasis added) to argue that “China’s trade surplus with the U.S. actually represents the trade surplus of the [East Asian] region.”[17]As discussed further later, there is a whole array of reasons why the actual size of the United States’ own bilateral trade deficit with China may be substantially overstated in official US statistics, which show the overall bilateral trade deficit reaching $232.5 billion in 2006.
The rapid growth in bilateral trade is undeniable, however, and, as shown in Figure 2.1, the monthly level of Chinese imports nearly tripled over the 2001-2006 period, reaching approximately $24.2 billion in December 2006 (for a cumulative total of $287.8 billion over the preceding twelve months). US exports to China have actually been growing nearly as quickly as Chinese imports, with US exports growing by an average of 23% a year over the 2001-2006 period.[18] The problem is that the disparity in the starting levels means that US exports would have to grow nearly six times faster than imports to close the bilateral trade deficit in dollar terms. In comparison, the highest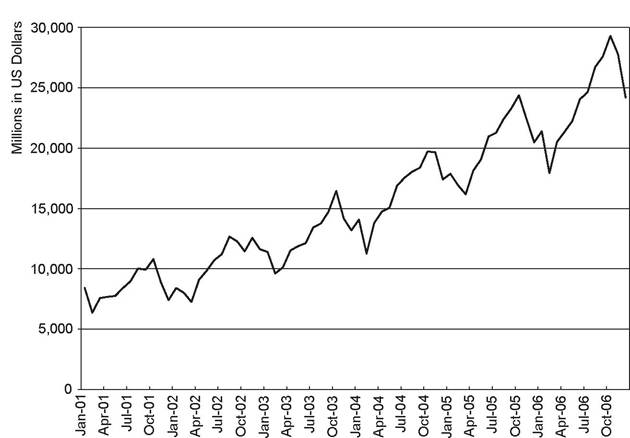
Figure 2.1. US Imports from China, Mainland, Customs Basis (in millions of dollars). Source: US Department of Commerce: Bureau of Economic Analysis, US Department of Commerce: Census Bureau; Federal Reserve Bank of St. Louis.
import-export ratio faced against Japan in the mid-1980s was only three- to-one (Hufbauer, Wong, and Sheth, 2006, p. 8).
It should be emphasized, however, that mainland China’s economic openness to both imports and foreign direct investment (FDI) is, in quantitative terms, substantially higher than Japan’s. Indeed, while the share of imports in China’s economy soared from just 5% in 1978 to 30% in 2005, the import ratio has remained closer to 15% for the United States and 10% for Japan (Bergsten et al., 2006, p. 84). Meanwhile, as noted by Siebert (2007, p. 905), net FDI inflow into China has steadily risen from an average of just $US 1.4 billion per year during the 1980s, to $US 26 billion in the 1990s, and $US 48.3 billion over the 2000-2005 period. The annual growth rate of FDI inflows accelerated after China joined the World Trade Organization in 2001 (see Whalley and Xin, 2006) and stood at $US 63 billion in 2006. Accordingly, whereas Japan’s large bilateral trade surpluses of the 1980s largely reflected sales by domestic corporations, more recent Chinese surpluses incorporate substantial exports by US, European, and other non-Chinese multinational corporations. Whalley and Xin (2006) illustrate the rapid growth in exports by foreign-invested enterprises, which accounted for 57% of China’s total exports in 2004 - as opposed to less than 2% in 1985.
As discussed next, reexporting by US multinationals, in particular, implies that a significant portion of China’s bilateral surplus with the United States reflects the activity of US, rather than Chinese, firms.In 2004 the Bush administration and the Kerry campaign found agreement in asserting that the US trade deficit was primarily a Chinese problem, deriving from the Chinese currency, the renminbi, being too cheap relative to the US dollar and thereby making Chinese goods overly cheap as well. Former Treasury Secretary John Snow’s September 2003 call for Chinese exchange rate adjustment was followed by increasingly vehement rhetoric during the 2004 election year and a series of individual congressional initiatives culminating in the June 2005 proposal by Senators Charles Schumer and Lindsey Graham that threatened a 27.5% tariff on Chinese imports. A new flurry of bills threatening punitive action against China for its currency policy followed in 2007.[19] As argued later, even assuming that such actions proved to be effective in improving the US bilateral trade balance with China, it is simply not plausible that any such moves could reverse the recent trends toward widening overall US trade deficits. The merchandise trade deficit reached $765 billion during 2006 (representing approximately 5.6% of the total US economy) and the deteriorating trend is readily apparent in Figure 2.2. US attempts to dictate the renminbi’s value against the US dollar seem singularly inappropriate given the uncertainty that surrounds the whole question of renminbi undervaluation, as discussed in Chapter 1.[20] Indeed, McCary and Batson (2007, p. A4) point out that “ [m]ost of the antiChina bills introduced so far would impose penalties until the currency was no longer deemed ‘misaligned,’ but don’t specify what that level is.”
Considering that the United States has recently been accounting for more than 70% of the world’s current account deficits, it seems rather doubtful that all the imbalances could be on the Chinese side.[21] Indeed, in only five advanced economies (Greece, Iceland, New Zealand, Portugal, and
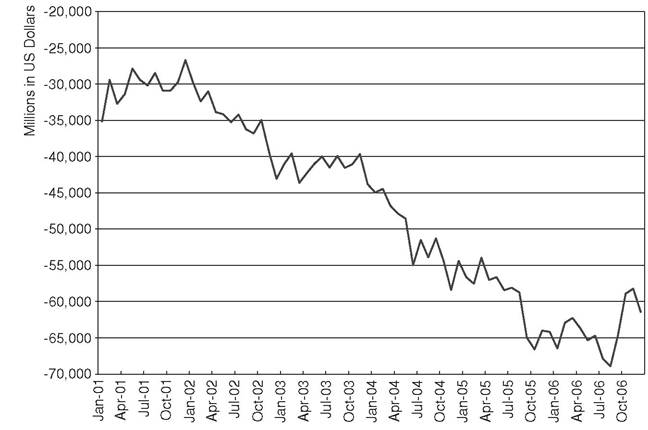
Figure2.2.
USTradeBalance: GoodsandServices, BalanceofPayments Basis (in millions of dollars). Source: US Department of Commerce: Bureau of Economic Analysis, US Department of Commerce: Census Bureau; Federal Reserve Bank of St. Louis.Spain) was the 2006 current account deficit a bigger percentage of the economy than the US case. And, in absolute terms, the $856.7 billion 2006 US current account deficit was nearly eight times that of the runner-up, Spain, with $108.0 billion (International Monetary Fund, 2007, pp. 248249). China’s trade surplus, although large, is by no means such an outlier as the United States’ deficit. As discussed in the previous chapter, the US trade deficit has also continued to rise unabated even while the dollar depreciated considerably after 2001. By the time of China’s July 2005 exchange rate policy change, the dollar had lost nearly a quarter of its value on average against other major world currencies in little over three years, even after including the short-lived “bounce” in the first half of 2005. With China still only accounting for 11.9% of total US trade in 2006, one has to wonder whether any plausible adjustment of the Chinese currency could, on its own, yield any sustained reversal of this trend.
More on the topic The United States vs. China:
- China’s Wise Teacher
- Rape
- The Era of the Beijing Government (1912-1927)
- The First World War in East Asia
- Most crimes eventually became understood as collective problems to be solved by the state acting on society's behalf.
- STAN ULAM’S CHALLENGE
- National Survival: Constitution-Making in a Failed State
- CLUSTERF**K!
- Decolonization, the Cold War regime and postwar East Asian growth
- In 1750, the majority of the world’s population lived in the great agrarian empires of Eurasia, spanning the globe from China to Austria but also covering large swathes of Spanish America.