BODY COMPOSITION
Although of little importance in assessment of growth, it is noteworthy to remember following changes in body composition with age:
• Decrease in total body water from ~75% at birth to ~60% in adults, as well as its redistribution with gradual decrease in extracellular water and increase in intracellular water.
• Increase in skeletal muscle mass, from ~25% at birth to ~45% in adults.
• Changes in adipose tissue mass, which is higher in infancy and adolescence, i.e. ~25%, as compared to mid-childhood, i.e. ~20%.
• Changes in chemical composition of lean body mass, due to accumulation of various minerals.
• Changes in visceral size, which usually follow the changes in body size with some exceptions, e.g. postnatal regression of thymus.
2.4 GROWTH NORMS AND GROWTH CHARTS
Normal or reference values for common growth parameters in healthy children are obtained by longitudinal or cross-sectional surveys of the selected population with an appropriate sample size. However considering individual variations even in healthy population, data obtained during these surveys is further analyzed by various statistical methods to disregard normal variations, in terms of medians, percentiles and Z- scores.
Medians, Percentiles and Z-scores: When a parameter, e.g. weight of the large number of children is recorded in a given population with comparable age and sex, values are expected to differ from each other but all variations are not abnormal. When this data is arranged in an ascending or descending order, it is expected to form a bell-shaped curve (Gaussian distribution) with maximum values clustered around the center of this curve and fewer values at both ends.
Median value: If the data, (e.g. weight/height) from a sample population of 100 children is arranged in ascending or descending order, the weight/height of the 50th child is likely to be essentially normal and reflects the median value.
On the other hand, children at the extremes of this arrangement are more likely to be abnormal.Percentiles mean the location of a child's value in above arrangement. For example, the anthropometric value of 3rd, 25th, 50th, 75th or 97th child in this series is designated as 3rd, 25th, 75th and 97th percentile respectively. Values between 3rd and 97th percentile cover 95% of children and correspond with 2 standard deviations (SD) of mean value on Gaussian distribution—a universally acceptable limit for variations. For information, one SD covers 68% of values (16th-84th percentile) and three SD covers 97% of values in this data series (2nd-98th percentile).
In practice, 50th percentile is considered as ideal value, 3rd percentile as the lowest acceptable limit of normal value and 97th percentile as highest acceptable normal value. Thus, children with weight, height or other parameters below the 3rd percentile or above the 97th percentile are considered as potentially abnormal, while those within these limits are considered as potentially normal.
Z-score is another common term used to denote deviation of observed value from the median value and calculated as follows-
Observed value - Median value/standard deviation.
A Z-score of 2 means that the difference between observed value and expected reference value is 2 times of standard deviation in reference population, with prefix +/- sign (+1,+2,+3 Z-score or -1,-2,-3, Z-score) denoting the observed value being more or less than the reference values. A Z-score between +2 and -2 covers 95.4% of observations and is generally considered as limits of normalcy.
Growth norms and Growth charts: Results of these surveys, after statistical analysis, are depicted eiher in numerical tabular form (Growth norms) or visual graphic form (Growth charts).
Thus, growth norms or charts reflect normal anthropometric values in healthy children of different ages and gender, within the acceptable limits of individual variations.Standard vs Reference norms: While the term standard norms and reference norms for growth are often used interchangeably, two terms have different connotations.
• Reference norms for growth are derived from the local population with similar environmental, socioeconomic and nutritional characteristics and represent that - 'how does the concerned population grow ?'.
• Standard norms for growth, on the other hand, are derived from the much healthy population, relatively free from common constraints, e.g. malnutrition of infections. And denote that 'How should the child grow?', If not constrained by other factors.
WHO vs IAP Growth norms: WHO, in 2006, published Standard growth norms for children below 5 years, derived from a multicenteric study of six countries in different regions of the world - Brazil, India, Ghana, Norway, Oman and United States. Study included populations with healthy practices, e.g. breastfeeding and no maternal smoking during pregnancy.
WHO standard growth norms are available for many anthropometric parameters including those for weight, length/height, weight for height, head circumference and body mass index in the tabular as well as graphic forms (Appendix 2.1-2.8). Government of India has adopted WHO growth standards for use in children to detect changes in growth parameters over a period of time. Growth monitoring helps in early identification of high-risk children for growthfaltering and institute early remedial measures.
Indian Academy of Pediatrics (IAP) recommends periodic growth assessment at - (a) birth, (b) during each immunization visits at 6, 10, 14 weeks and 6, 9 and 15 months, (c) every 6 months from 18 months to 8 years of age and then d) annually during 9-18 years. While weight and length/height must be recorded during all visits, head circumference should be recorded till 3 years, body mass index (BMI) from 6 year onwards and sexual maturity rating (SMR) from 9 year onwards.
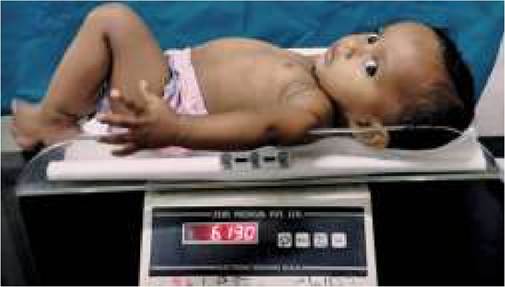
Fig.
2.2: Weighing an infant.• Place the beam/digital balance on a firm and stable surface to avoid toppling while weighing.
• Check the zero error and correct, if necessary, using the calibrating screw.
• Remove clothing, including diapers, of the infant and place him/her in the center of pan.
• Allow the time to stabilize him/her on the pan, to avoid errors due to swaying.
• Read the scale with eyes perpendicular to the display/dial to avoid errors.
Growth assessment is a four-step process including:
a. Recording of appropriate anthropometric growth parameter (Observed value).
b. Comparing this observed value with standard or reference growth norms for corresponding age and sex (Expected value).
c. Serial recording of assessed parameters (observed values) on growth charts to assess growth velocity.
d. Interpretation and conveying the information to parents as well as suitable remedial action (growth monitoring and promotion).
Step I. Selecting and recording appropriate growth parameter, depends on the purpose of assessment. In regular practice, three growth parameters are commonly recorded in children - weight, length/height and head circumference.
Weight is the best indicator of acute growth insult, though rapid fluctuations during health and disease render it unsuitable for long-term growth assessment. It should be measured on a digital balance or beam balance with minimum accuracy of 20 gm in infants and 100 gm in older children (Figs. 2.2, 2.3). Spring balances, e.g. bathroom scale or salter-spring balance tend to provide false values due to loss of spring elasticity after repeated use and should be avoided.
Length/height is a better indicator of long-term growth, affected only after prolonged illnesses and remains abnormal for a long time after recovery. It should be recorded in recumbent position (length) in infants growth curve, with WHO/IAP reference norms.
Step III. Serial record of assessed parameters on growth chart aims to evaluate the trend of growth over a period of time and identify a deviation from normal growth as early as possible, even in children with previous borderline values.
This objective is achieved by plotting the serial anthropometric values on a growth chart and joining all the dots to develop a child-specific growth curve.Location and shape of this child's growth curve as compared to reference curves provides important information about the trend of growth in child under assessment. Any child's growth curve, which runs flatly below the lowest reference curve or plateaus/dips after initially being above the reference curve is a cause of concern.
Growth velocity is defined as “rate of growth or change in a growth parameter over unit period of time.” For example, since length at birth is 50 cm and at one year is 75 cm, growth velocity in first year is 25 cm/ yr. Growth velocity is not uniform throughout the childhood and a baby has different growth velocity at different ages and for different parameters.
Growth velocity is calculated by serial recording of selected parameter at different time intervals, i.e. monthly or yearly and then dividing the change in parameter by the time, interval. Reference values for different growth velocities at various age intervals are also available, termed as reference velocity norms in tabular form and reference velocity curves in graphic form.
Step IV. Interpretation of growth records, conveying the information to parents and taking suitable remedial actions: The main objective of growth assessment is not only to detect the growth abnormality, but also to make the mother (and family) realize its significance and take timely action. This process of continuous check and timely action is strategically described as growth monitoring and promotion, discussed later.
Growth monitoring and promotion (GMP): Growth monitoring aims not only to track the growth of a child over time but also to enable mother/caregiver to visualize growth or lack of growth in their children and to provide specific, relevant and practical guidance for remedial measures, also termed as growth monitoring and promotion).
While WHO/IAP growth charts may be used for growth monitoring in facility setting, many simplified growth charts are also available for field use, including the widely popular one "Road-to-health card". However, recently, Mother-to child protection card has replaced most of them, being used routinely in all national health programs.
Mother to Child Protection Card
Since the adoption of WHO growth standards in 2009, a new mother and child protection card has been developed under National Health Mission, which also includes two gender-specific growth charts for boys and girls below 3 years of age (Fig. 2.9A and B).
These charts have three differently colored zones based on weight-for-age as per WHO standard norms - top green zone between 50th percentile and - 2 SD values (normal), second yellow zone between -2 SD and -3 SD values (underweight) and bottom red zone for values or stepping reflex, must disappear before the corresponding voluntary function, e.g. voluntary grasp or standing is achieved. Persistence of a neonatal reflex beyond the expected age of its disappearance, by itself indicates developmental problem, as seen in cerebral palsy.
• Generalized mass activity is gradually replaced by more specific and purposive response, e.g. while an infant of 3-4 months squeals and excitedly moves all the limbs when offered a toy, an older child may simply smile and reach-out to it with one hand.
2.6.2