Cerebrospinal fluid analysis
CSF was first used as a diagnostic medium more than 100 years ago (Garma-Aviña, 2004). As one of the few readily available means of testing the CNS in a minimally invasive manner, CSF analysis is still commonly employed to better understand the pathology associated with neurologic disorders.
Production and circulation
The role of CSF is to cushion the nervous tissue and provide nutritional support (Elias & Brown, 2008). CSF is an ultrafiltrate of plasma produced by choroid plexus and ependymal cells in the ventricular system of the brain and subarachnoid space (Di Terlizzi & Platt, 2006). Fluid production is dependent on an active transport system and is therefore fairly constant. The pia mater, the layer that forms the CSF–brain interface, is highly permeable and allows easy equilibrium of constituents in the CSF with the interstitial fluid of the nervous system and vice-versa (Bagley, 1996). This allows the CSF to stand as a representative of the CNS parenchyma in some conditions.
Cells lining the arachnoid villus function like valves and allow drainage of CSF into the venous sinuses using transcellular mechanisms (Di Terlizzi & Platt, 2006). Fluid, protein, and even particles as large as red blood cells (RBCs) can be removed from the CSF using this mechanism (Rosenberg et al., 1980). The overall direction of CSF flow in the healthy state is from cranial to caudal (Rosenberg et al., 1980; Elias & Brown, 2008). This has led to the recommendation to collect fluid caudal to the primary lesion (Thomson et al., 1990; Lampe et al., 2020b). Although this is likely a wise choice, diagnostically useful samples can also be obtained cranial to the lesion location.
Indications and contraindications
Indications for collection and evaluation of CSF include clinical suspicion of neoplasia, inflammation, trauma or other causes of hemorrhage, degenerative disorders, or infection within the brain or spinal cord (Elias & Brown, 2008; Di Terlizzi & Platt, 2009).
In one large study, an etiologic diagnosis was provided by CSF analysis in only 2% of 256 canine cases; however, 75% of cases with diseases typically producing CSF abnormalities provided evidence to support the final diagnosis or pathologic process (Bohn et al., 2006). Based on this evidence, CSF analysis should be viewed primarily as a means of furthering understanding of the pathology occurring, with determination of a definitive diagnosis seen as an added bonus. For example, CSF analysis can often be helpful in distinguishing an inflammatory process from a neoplastic one, but only rarely will the cause of the inflammation be evident by CSF analysis alone (Bohn et al., 2006).
With increasing access to advanced diagnostic imaging, MRI techniques are commonly used prior to, or in tandem with, CSF analysis. This combination allows evaluation of the structure (MRI) and biochemical/cellular components (CSF) of the nervous system. Normal imaging findings should not be used as a reason to omit CSF analysis from the diagnostic work up. Abnormal CSF findings can be encountered in cases with normal MRI evaluation. CSF abnormalities are more common than MRI changes in cases of inflammation, degenerative myelopathies, and idiopathic epilepsy/vestibular disease (Bohn et al., 2006; Hugo et al., 2014). Predominant cell types on CSF cytology have been associated with MRI changes, with large mononuclear pleocytosis being almost 23 times more likely to have MRI changes compared to lymphocytic/small mononuclear or neutrophilic pleocytosis (Hugo et al., 2014). Additionally, CSF analysis may not contribute to a diagnosis when MRI findings provide obvious evidence of intervertebral disk disease (IVDD) or vertebral malformation/instability. However, CSF analysis can aid in the determination of severity and prognosis in these settings (Bohn et al., 2006; Chamisha et al., 2015). CSF analysis has also been recommended prior to contrast studies when meningitis is suspected. Radiopaque contrast medium can exacerbate meningitis-associated clinical signs; a finding supportive of an inflammatory process by CSF could be a contraindication for contrast studies (Wamsley, 2013).
Appropriate timing of sample collection can improve the diagnostic utility of CSF analysis. For example, in dogs with idiopathic epilepsy, both CSF and MRI findings should be normal except, perhaps, following a seizure event (Mellema et al., 1999; Hasegawa et al., 2004; Bohn et al., 2006; Creevy et al., 2013). Therefore, it might be less diagnostically useful to evaluate CSF in a post-ictal patient and pursuing CSF analysis after a seizure-free interval is recommended. As previously mentioned, radiologic contrast dyes will cause an inflammatory response, so sampling after contrast administration would be less diagnostically useful than sampling before contrast administration.
CSF collection in small animals requires general anesthesia. The diagnostic benefits of analysis must be weighed against the anesthetic risk of collection when making diagnostic plans, especially in severely debilitated or compromised patients. Alternative anesthetic protocols, especially ones that do not increase CSF pressure, may be appropriate.
The most common complication associated with CSF collection is hemorrhage. This may be a small amount of hemorrhage associated with transit through a dural or extradural blood vessel, or significant disruption of one of the ramifications of the vertebral plexi. Incidental transit through a dural blood vessel is seen as a flash of blood present at the beginning of sample collection, which clears as CSF is allowed to flow during collection. This amount of hemorrhage is typically not clinically meaningful but can pose a diagnostic challenge in some cases.
Puncture and trauma to the brainstem or spinal cord has been reported, but only rarely (Platt et al., 2005; Lujan-Feliu-Pascual et al., 2008). Patients suspected of atlantoaxial subluxation, Chiari-like malformation, or cervical trauma may be at higher risk of trauma due to CSF collection; care should be taken with these cases (Di Terlizzi & Platt, 2009). Additionally, strict compliance to aseptic technique is critical to avoid introduction of infectious agents into the CNS.
Bacterial and fungal infections secondary to CSF collection have occurred. As would be expected, CNS complications in these cases can be terminal, although many reported patients have shown gradual recovery.Respiratory distress due to kinking of endotracheal tubes during positioning for collection is possible. This is essentially only seen with cerebellomedullary collections where the neck must be flexed. Kinking of the tube can be avoided by using a guarded or reinforced tube. Likewise, careful attention to endotracheal cuff pressure during flexion of the neck is recommended to prevent trauma to the trachea.
Increased intracranial pressure (ICP) is often listed as a specific contraindication for CSF collection. ICP can be increased due to intracranial space-occupying lesions (most commonly neoplasia), trauma, hydrocephalus, or inflammatory lesions (Tipold, 2003). Elevation of the head can cause decreased ICP at the cerebellomedullary cistern and increased ICP on lumbar puncture (Carlson et al., 2003). It is believed that the sudden focal release of pressure on puncture of the subarachnoid space for CSF collection can cause herniation and subsequent trauma (Rand et al., 1994b). The true magnitude of this risk has been questioned.
Collection technique
In dogs and cats, CSF can be collected from the cerebellomedullary cistern and the lumbar space. The lumbar space is more likely to have blood contamination. Choice of cerebellomedullary or lumbar puncture should be based on the location of the suspected lesion, an assessment of potential complications, and the comfort of the clinician. Collection as close to and distal to the lesion is recommended (Lampe et al., 2020b). A quick synopsis of CSF collection techniques is provided in Table 14.1.
Table 14.1 Basic overview of CSF collection techniques
| Cerebellomedullary cistern | Lumbar space | |
| Patient positioning | Lateral recumbency Spine at edge of table Head flexed at 90° angle Median plane of nose parallel to table | Lateral recumbency Spine at edge of table Pelvis flexed |
| Puncture location | Atlanto-occipital space | L6–L7 intervertebral space in cats L5–L6 intervertebral space L4–L5 intervertebral space in large dogs |
| Landmarks (intersection of lines drawn between) | Wings of axis Occipital crest and dorsal arch of axis | Ilial crests Lumbar spinous processes (L6–L7 interspinous space) |
| Needle position | Perpendicular to spinal cord Bevel facing cranium | 45° angle (hub closer to tail) Bevel facing cranium |
| Collection site | Cerebellomedullary cistern (dorsal to spinal cord) | Ventral subarachnoid space (needle passes through cauda equina) |
For collection from both sites, a wide area is clipped and surgically scrubbed.
A 22- to 25-gauge 40–90 mm spinal needle can generally be used (Elias & Brown, 2008; Di Terlizzi & Platt, 2009). The stylet included with spinal needles will prevent sampling of tissue during insertion of the needle, but will also block the initial flash of CSF seen on penetration of the dura. This initial flash can be used as a cue that the correct location has been accessed. If a stylet is present, it can be removed after advancing the needle close to the appropriate depth. This will help detect penetration to the correct location and aid the inexperienced collector (Di Terlizzi & Platt, 2009).Approximately 1–2 ml of CSF should be collected if possible, and is usually sufficient for most diagnostic purposes. As much as 1 ml of CSF for every 5 kg of body weight can be safely collected (Elias & Brown, 2008). CSF should be collected into plain, noncoated, plastic collection tubes. Glass tubes should be avoided as cells tend to adhere to glass. EDTA containing tubes can be used but are typically not needed for anticoagulant purposes; CSF does not routinely clot. Furthermore, EDTA has a bacteriostatic effect that will interfere when culturing the sample and EDTA itself may alter results of other diagnostic testing.
Collection of CSF might not always be achieved on the first try. If bone is encountered, the needle can be pulled back and redirected along a new trajectory until the appropriate space is located. If blood is present in the needle prior to puncture of the cistern, or if frank hemorrhage is encountered, a new needle should be used. If blood is noted after puncture of the cistern, it will often clear if CSF is allowed to flow through the needle. The initial blood-contaminated sample can be collected into an EDTA containing tube to prevent clotting. When blood contamination has visually cleared, a fresh anticoagulant free tube should be used.
Cerebellomedullary cistern
With the patient in lateral recumbency, the area is clipped and scrubbed and the patient positioned with the spine at the edge of the table.
This allows sufficient room for CSF to drop out of the needle hub and into the collection tube. Right-handed individuals will typically find it easiest to position the patient with the head to the right. The neck should be flexed until the head is at an approximate right angle to the spine. This will open up the atlanto-occipital space. Padding to keep the median plane of the nose parallel to the table will help prevent axial rotation of the spinal column and ensure proper alignment of nervous tissue structures surrounding the cistern.The insertion point for the needle is along the midline at the level of a line drawn between the wings of the axis. The midline can be located by palpation of the occipital crest and the dorsal arch of the axis (Figures 14.1a, b). A skin incision with a hypodermic needle or scalpel blade may help in thick skinned animals. The needle is advanced along the median plane with the bevel of the needle facing cranially. In medium to large breed dogs, resistance will be felt during penetration of the dura. After passing through the dura, slight advancement through the meninges will position the needle in the cistern. In smaller animals, resistance at the ligament may not be felt; removal of the stylet from the needle will allow visualization of CSF in the hub on entering the cistern. CSF should begin to flow freely, although sometimes slowly, from the hub and can be caught in a plain, additive-free tube. Suction is generally not recommended or needed. If the needle is passed through the cerebellomedullary cistern, it will penetrate the spinal cord and may cause damage.
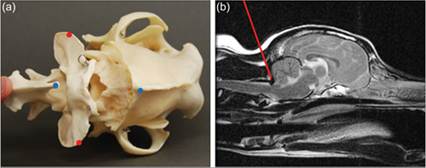
Figures 14.1a,b Needle placement for a cerebellomedullary cisternal tap. (a) A dorsal view of the caudal aspect of the skull (right), atlas (center), and axis (left) is presented. The neck is in proper flexion for a CSF tap; this opens up the foramen magnum and allows access to the cistern. Red dots indicate the wings of the axis. Blue dots indicate the occipital crest (right) and the spinous process of the axis (left). Needle insertion is approximately at the location where a line connecting the red dots and a line connecting the blue dots would intersect. (Courtesy Neurology Department, College of Veterinary Medicine and Biomedical Sciences, Colorado State University.) (b) T2-weighted mid-sagittal MR image of the head and neck of a dog (rostral is to the right). The red line represents a needle accessing the cerebellomedullary cistern. Note that the bevel is facing cranially. The patient’s neck was not maximally flexed when positioning for this image. (MR image obtained and reviewed by a Diplomate of the American College of Veterinary Radiologists at Colorado State University, Fort Collins, Co.)
Lumbar cistern
The clipped and scrubbed patient is placed in lateral recumbency with the spine along the edge of the table. This allows sufficient room for CSF to drop out of the needle hub and into the collection tube. Right-handed individuals will usually find it easiest to position the patient with the head to the right. The pelvis is flexed to help open up the intervertebral spaces.
The insertion point is along the midline at the level of the L6–L7 interspinous space in most patients (Figures 14.2a, b). In larger dogs, the L5–L6 interspinous space may be used. A line drawn between the iliac crests will fall at the level of the L6–L7 interspinous space and can be used as a landmark to help find where to palpate. A skin incision with a hypodermic needle or scalpel blade can be used in thick skinned animals. The needle is advanced along the median plane at a 45° angle to the spine, with the hub of the needle closer to the tail. With skin penetration at the level of the L6–L7 interspinous space and this angle of approach, the needle actually passes through the L5–L6 intervertebral space. Similarly, the L5–L6 interspinous space will allow access to the L5–L4 intervertebral space. The bevel of the needle faces cranially. Because there is less risk of trauma at the lumbar site, the stylet can be left in place until after penetration of the dura. After passing through the dura, the needle typically continues through the cauda equina; this may cause a tail or leg twitch. Although slightly unsettling if it is not expected, this should not lead to significant damage. With a lumbar puncture, CSF is typically collected from the ventral vertebral sinus; if fluid can be obtained from the dorsal space there is less chance of causing trauma. However, sampling from the dorsal space is typically not feasible.
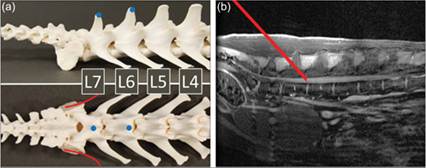
Figures 14.2a,b Needle placement for a lumbar tap. (a) Lateral (top) and dorsal (bottom) views of the caudal spine are presented (cranial is to the right). The pelvis has been removed for ease of visualization. The approximate locations of the crests of the ilium are marked with red lines. Blue dots indicate the spinous processes of L6 and L7. Needle insertion is at the L6–L7 interspinous process, approximately at the location where a line connecting the ilial crests and a line connecting the blue dots would intersect. (Courtesy Neurology Department, College of Veterinary Medicine and Biomedical Sciences, Colorado State University.) (b) T2-weighted mid-sagittal MR image of the lumbosacral spinal of a dog (cranial is to the right). The red line represents a needle accessing the vertebral sinus with skin puncture at the level of the L6–L7 interspinous space. The needle travels along a 45° angle with the bevel facing cranially to enter at the L5–L6 intervertebral space. When positioning for a CSF tap, flexing the pelvis will help to open up the intervertebral space. (MR image obtained and reviewed by a Diplomate of the American College of Veterinary Radiologists at Colorado State University, Fort Collins, Co.)
Cerebrospinal fluid handling
Immediately after collection, any tubes containing CSF should be labeled with a minimum of patient ID, sample material (CSF), and volume and type of additive, if used.
CSF is a highly labile material; delays in sample handling can drastically alter test results and should be avoided (Bienzle et al., 2000; Fry et al., 2006). Immediate refrigeration and some form of processing or stabilization of the cellular component of the sample should be instituted within 1 hour of collection (Cook & DeNicola, 1988).
Stabilization of the cellular component of CSF is most important in samples with a protein concentration 50 mg/dl was shown to be fairly stable with just refrigeration for up to 12 hours, while samples with lower protein levels demonstrated an increase in unrecognizable cells and alterations in cell percentages during that same time period and conditions (Fry et al., 2006). Of more concern is the finding that not all cell populations are affected equally by delayed sample handling. Large mononuclear cell percentages decrease and unrecognizable cell percentages increase as early as 2 hours after collection when no preservation other than refrigeration is used (Fry et al., 2006). Small mononuclear cells demonstrate a slower but significant degeneration with prolonged refrigeration. Neutrophils seem least affected by delayed processing. The amount and type of cellular degeneration observed with delayed sample handling will adversely affect the accuracy of the cytologic interpretation. If a sample cannot be analyzed within 24 hours, addition of a preservative is recommended.
Oncotic agents have been recommended as preservatives of the cellular components of CSF samples. Addition of 20% (v/v) fetal calf serum (~3.5 g/dl [35 g/l] protein), a 1:1 volume of hydroxyethyl starch, or three drops of autologous serum for every 0.25 ml of CSF can be recommended (Bienzle et al., 2000; Fry et al., 2006). Serum appears to preserve small and large mononuclear cells better than neutrophils. Hydroxyethyl starch appears to stabilize neutrophils and small mononuclear cells better than large mononuclear cells. CSF samples collected in EDTA tubes have not been shown to influence nucleated cell count or cell preservation (Koch et al., 2019). Addition of 11% autologous serum has shown significant positive results in improving and maintaining cell morphology up to 48–72 hours. Higher concentrations (29%) may create a protein precipitate artifact that could interfere with cytologic evaluation in samples with elevated protein levels. Noted findings include condensation of large mononuclear cells and confusion with small mononuclear cells/lymphocytes, which could affect nucleated cell counts. However, addition of higher concentrations may be helpful for preservation of samples with low protein levels (Bienzle et al., 2000). A recent equine study also confirmed the reliability of autologous serum as a promising preservative up to 96 hours (Quattrini et al., 2023). Studies with larger sample sizes, especially with feline patients, are needed.
Previously, 10% neutral buffered formalin, 50% alcohol, or 90% alcohol have been recommended as preservatives. These agents alter cellular morphology and make cytologic evaluation more challenging. Their use is no longer recommended. A recent study has also revealed the commonly used colloid Vetstarch to be an unreliable stabilizing agent for CSF (Peterson et al., 2020).
Addition of a preservative will have a dilutional effect on the sample. The additive should be reported to the laboratory performing cell counts or other analysis so that proper adjustment for the dilution can be made. As expected, autologous or calf serum will also alter the protein content. A preservative-free aliquot should be submitted concurrently to be used for non-cell related analysis. If an additive is needed, great care should be used to ensure sterility. Considerable bacterial growth can occur during sample transit; such growth will cause alteration in sample cellularity and interpretation (Figure 14.3).
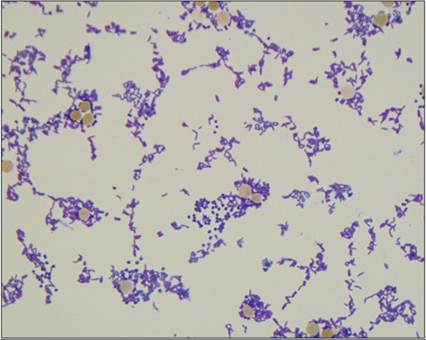
Figure 14.3 CSF from a 10-year-old Golden Retriever. TNCC = 1 cell/μl, CSF TP = 72 mg/dl. Sample was in transit 3 days before analysis. Note the large number of mixed bacteria present and the lack of an inflammatory population. This is suggestive of bacterial overgrowth; alternatively, it is possible that the inflammatory cells degenerated during shipping (Wright–Giemsa, 1,000? magnification).
CSF should not be frozen until after evaluation of cellularity has been performed. Freezing will destroy the cells. Freezing can be used as long-term storage for further biochemical testing; however, this is typically only needed in research settings. Unaltered CSF shows no significant change in total protein (TP) when refrigerated at 4°C for up to 48 hours (Fry et al., 2006).
Laboratory analysis
Multiple laboratory tests can be performed on CSF. As reference laboratories become more readily accessible, processing of CSF samples in a clinical setting is becoming a less common event. Often, more advanced analytical techniques can be used in a reference laboratory. Such laboratories also tend to employ more thorough quality control protocols than are practical for in-clinic laboratories. Basic analytical procedures are outlined here to help the reader understand the analytical principles involved and their inherent variability. Some of these techniques can be used in-clinic if needed.
Macroscopic evaluation
Typically, CSF is grossly very bland. Color and turbidity are usually assessed as the first step of analysis. CSF should be clear and colorless.
Turbidity
CSF turbidity is normally graded as clear, turbid, or cloudy (Figure 14.4). Clear CSF means that it is very easy to read newsprint through the sample. Turbid or cloudy CSF can be due to several causes, although it is almost always associated with increased cellularity. Estimates indicate that turbidity is visible when cell counts are >500 cells/μl (0.5 ? 109/l) (Di Terlizzi & Platt, 2009).
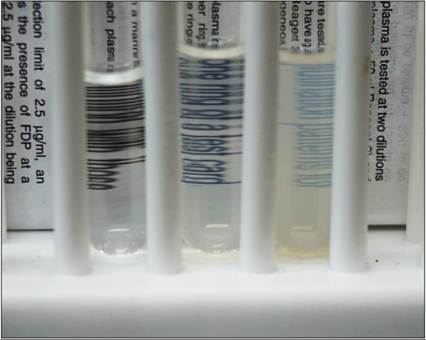
Figure 14.4 The tube to the far left is clear – print can easily be read through the sample. The tube in the middle is turbid – print is readable but hazy. The tube to the far right is cloudy – print is visible through the fluid but not readable.
Color
Visual detection of changes in CSF color is limited. Holding the sample up against a white background can help highlight subtle color deviations in the CSF. Pink to red discoloration may be seen with hemorrhage. Yellow discoloration of CSF is termed xanthochromia and is typically associated with chronic in-vivo hemorrhage (Figure 14.5). As hemoglobin breaks down it first forms oxyhemoglobin and then progresses to bilirubin (Shah & Edlow, 2002). The conversion to oxyhemoglobin can occur both inside and outside the body. The conversion from oxyhemoglobin to bilirubin only occurs in vivo. Bilirubin imparts a yellow color to the fluid. Therefore, only pathology that causes red cells to enter the CSF in vivo is expected to lead to xanthochromia. Measurement of CSF bilirubin, oxyhemoglobin, and total protein (CSF TP) is used as a more sensitive test for in-vivo hemorrhage than visual detection of xanthochromia in human medicine (Falconer et al., 2015).
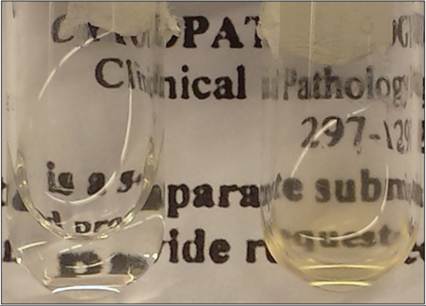
Figure 14.5 The tube on the left contains CSF with normal gross findings: clear and colorless. The tube on the right is both xanthochromic and turbid. Note how the printing on the paper behind the normal sample is crisp, while the printing behind the turbid sample is hazy.
Serum bilirubin is typically prevented from entering the CNS (Ostrow et al., 2004). However, in extreme hyperbilirubinemia, unconjugated bilirubin can accumulate in nervous tissue. This condition is called kernicterus and causes both bilirubin-associated CNS toxicity and xanthochromia (Belz et al., 2013).
Cell counting
Due to the low cell concentration in most CSF samples, the gold standard for cell counting remains the hemocytometer. This is true in spite of the potentially high variability in repeated measurements of the same sample. One study measuring total nucleated cell count (TNCC) over time with various preservation techniques found a majority of samples had at least one TNCC that was higher 2–48 hours after collection than when the same sample was counted immediately on collection (Fry et al., 2006).
Automated counting techniques have been investigated for CSF (Andrews et al., 2005; Becker et al., 2008; Ruotsalo et al., 2008; Romero-Fernandez et al., 2020; Ortiz-Nisa et al., 2021). These methods have several advantages for highly cellular CSF but have historically had poor performance in samples with low cellularity, which make up the majority of samples. Recent studies on newer generation automated hematology analyzers have shown promising data supporting high sensitivity and specificity in quantification of low cellularity CSF samples in dogs, though they still recommend manual cytologic evaluation to perform differential cell counts (Romero-Fernandez et al., 2020; Ortiz-Nisa et al., 2021). Even studies that advocate counting by automated means provide recommendations for when a hemocytometer count is necessary.
Hemocytometer count
The first step in performing a hemocytometer count is to ensure that the hemocytometer and weighted coverslip are lint free. This is done by rinsing the components with alcohol and allowing the alcohol to evaporate. A humidity chamber is also needed to prevent the sample from drying during preparation. This can be made with a Petri dish lined with a damp sponge or piece of filter paper. A pair of wooden tongue depressors or wooden cotton-tipped swab handles laid over the damp material will elevate the hemocytometer and make sample handing easier (Figure 14.6).
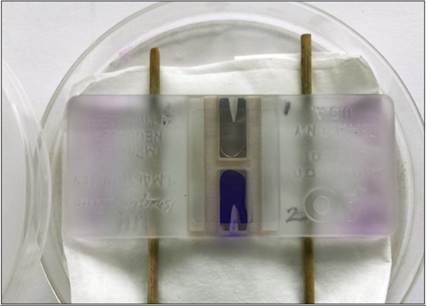
Figure 14.6 A simple humidity chamber for a hemocytometer can be constructed with a Petri dish, absorbent material, and wooden cotton-tipped swab handles. The upper chamber (labeled 1) is loaded with unstained CSF. The lower chamber (labeled 2) is loaded with new methylene blue-stained CSF. Typically, only stained or unstained sample will be used, not both.
The CSF is gently mixed by inverting the sample tube 15–20 times. Ten μl of CSF is loaded under the coverslip into each side of the hemocytometer. Except in cases of extremely high cell counts, CSF does not need dilution prior to loading in a hemocytometer. After loading, the hemocytometer is allowed to rest in the humidity chamber for 5 minutes so that the cells will settle to the bottom of the counting platform before placing the hemocytometer under a microscope for counting. Turning down the illumination and dropping the condenser will allow easier distinction of the cells and facilitate counting. Nucleated cells and erythrocytes in all nine large squares are counted on both sides of the hemocytometer (Figures 14.7a, b, 14.8a). The mean count of the two sides multiplied by 1.1 will provide the TNCC/μl and RBC/μl of the sample, respectively.
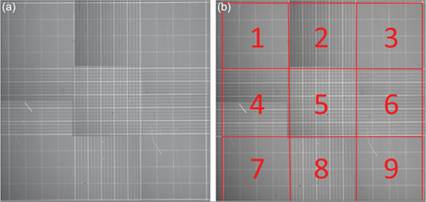
Figures 14.7a,b (a) A hemocytometer grid contains precisely measured lines which, with use of the appropriate weighted coverslip, define the volume of fluid within each square. (b) Each of the outlined and numbered squares contains 0.1 μl of fluid. For CSF cell counting, the number of cells in all nine of the numbered squares is counted and multiplied by 1.1 to adjust to the desired units of cells/μl (1 μl/0.9 μl = 1.1).
A new methylene blue staining technique has been described and can aid in identification of cells during counting (Figure 14.8b; Fry et al., 2006). With this technique, new methylene blue stain is drawn into a microhematocrit tube until one-third of the tube is filled. The stain is then drained out of the tube by blotting on a gauze sponge, essentially removing the major volume of stain and any dilutional effects. The opposite end of the tube is used to draw up CSF until the tube is half filled. The microhematocrit tube is carefully rocked several times to mix the residual stain into the CSF. After 1–5 minutes of incubation, the tube is rocked again to ensure complete mixing of the sample and the hemocytometer can be loaded as usual. With this staining technique, nucleated cells should be easier to distinguish from RBCs; most, but not all, RBCs will not stain while the nucleated cells should stain blue (Becker et al., 2008).
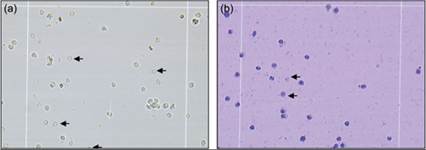
Figures 14.8a,b (a) 200? view of a hemocytometer loaded with unstained CSF. Red blood cells are smaller, round, slightly red, and lack internal structures. Three red blood cells in the image are denoted by arrows; several other red blood cells are present in the field. Nucleated cells are larger and contain an internal structure. (b) 200? view of a hemocytometer loaded with new methylene blue-stained CSF. Two red blood cells are denoted by arrows. They are round, pale blue, and lack nuclear structures. Nuclei stain a deep blue. Although the cell types cannot be differentiated with this technique, distinguishing between red cells and nucleated cells is easier.
Protein quantification
CSF contains very low amounts of protein. CSF TP is typically measured as mg/dl while serum protein is measured as g/dl. Neither protein determination by refractometer nor the chemical technique used to measure protein in serum is sensitive enough for CSF protein evaluation. For this reason, alternative methods must be used to accurately measure the protein content of CSF. Several dye binding microprotein analytical techniques have been developed but are not usually available outside the reference laboratory. These techniques produce slightly different results from each other and require their own reference intervals for accurate interpretation (Riond et al., 2013). Most, but not all, of these techniques are equally sensitive to both albumin and globulins. This is an advantage. Normal CSF protein is predominantly albumin. Globulin concentrations can increase dramatically secondary to pathology. Differentiation of albumin and globulin has not proven any more sensitive than an accurate TP analysis; therefore, a method that detects both protein groups is recommended (Behr et al., 2006).
A semiquantitative measurement of CSF TP can be made using the protein pad of a urine dipstick (Behr et al., 2003). Most urine dipstick manufactures provide a conversion of the Trace to ++++ scale to a semiquantitative protein value. This method was fairly well correlated with dye binding techniques (Jacobsen et al., 2012). However, urine test strips have their limitations. One study found that test strips were unable to detect globulins when present at 1 g/l, a concentration much greater than would be expected in most abnormal CSF samples (Behr et al., 2003). Ultimately, dipstick measurement is semiquantitative at best and cannot be recommended, except as a screening tool or in an emergency situation.
Historically, qualitative tests such as the Pandy test and the Nonne-Apelt test have been used as more sensitive tests for globulins. Currently, these tests are not routinely used in reference laboratories because of their subjectivity and have largely been replaced by quantitative tests.
Protein electrophoresis
Further classification of CSF protein into albumin and alpha-, beta-, and gammaglobulin fractions can be made using electrophoretic techniques. Both high-resolution electrophoretic techniques and electrophoresis after concentration have been evaluated (Behr et al., 2006; Gama et al., 2007). In a study of 100 high-resolution electrophoretic profiles of canine CSF, electrophoretic evaluation for calculation of albumin quota was highly correlated with TP determination. Significantly, the protein pattern was not associated with any specific pathologic process and albumin quota was no more sensitive for blood–brain barrier dysfunction than CSF TP alone (Behr et al., 2006). These findings suggest that electrophoresis may not be a valuable ancillary diagnostic tool in canine neurologic diseases.
Miscellaneous testing
Many ancillary tests have been proposed for use on CSF. Some of these tests have a clear utility in specific diagnostic settings, while the clinical worth of others is still under investigation. Some of these tests, their potential use, and a limited reference list can be found in Table 14.2.
Table 14.2 Commonly used or proposed ancillary tests performed with CSF. Diagnostic utility of some of these tests is still under investigation
| Test | Description | Reported utility | References |
| Albumin quotient | Ratio of CSF albumin to serum albumin: AlbCSF/Albserum | Detects blood–brain barrier disruption | Sorjonen, 1987; Behr et al., 2006; Pancotto et al., 2010 |
| Neurofilament light chain (NfL) | Neuron-specific cytoskeletal proteins released with axonal damage associated with MUE | Potential biomarker for MUE and evaluating response to therapy | Yun et al., 2021 |
| IgG index | Ratio of the CSF IgG: serum IgG ratio to albumin quotient: eq001 | Detects intrathecal production of immunoglobulin; may support encephalic inflammation | Mejias et al., 2008; Tipold & Stein, 2010 |
| IgA | Quantification of IgA in CSF by various methods | High levels are correlated with steroid-responsive meningitis–arteritis | Tipold & Stein, 2010 |
| Autoantibody testing | Detection of various autoantibodies | Can be elevated in GME, NME, and other diseases | Matsuki et al., 2004; Shibuya et al., 2007 |
| Glucose | Direct concentration of CSF glucose or ratio | Decrease may indicate sepsis, neoplasia, | Di Terlizzi & Platt, 2006; Witsberger et al., 2012; |
| CSF glucose/serum ratio | With serum glucose: glucoseCSF/glucoseserum | or post-ictal states. Increase may indicate disruption of blood–brain barrier or nutraceutical administration | Galan et al., 2013; Tumani et al., 2015 |
| Serology and molecular | Detection of infectious agents (antigen, | Various infectious agents including: | Nghiem & Schatzberg, 2010; Perez et al., 2011 |
| testing | antibody, or DNA/RNA based tests) | Toxoplasma, Neospora, Ehrlichia, Anaplasma, Rickettsia, Coccidiodes, Cryptococcus, Bartonella | |
| Culture | Bacterial and fungal culture | Various agents | Nghiem & Schatzberg, 2010 |
| Flow cytometry | Cytometric evaluation of cells in fluid | Differentiation of the mononuclear cell population. Used for B-cell/T-cell differentiation and characterization in human lymphoma. Questionable use in veterinary medicine | Duque et al., 2012; Pittman et al., 2013; Liu et al., 2015 |
| Matrix metalloproteinase MMP-9, MMP-2 | Concentrations may alter with intracranial | Mariani et al., 2013 | |
| neoplasia | |||
| Neurotransmitters | GABA or glutamate | May be associated with seizure activity | Hasegawa et al., 2004; Creevy et al., 2013; Platt et al., 2013 |
| Fibrinolytic activity | D-dimers | Increased with inflammation. May be marker for steroid-responsive meningitis–arteritis | De la Fuente et al., 2012 |
| Metabolites | Lactate, pyruvate | May be markers for senile dementia or altered metabolism, possibly associated with infectious agents | Pugliese et al., 2005; Joffe, 2007; Galan et al., 2013 |
| Lysosomal storage | Various storage materials | Detect GM-1 gangliosidosis, GM-2 | Johnsrude et al., 1996; |
| disease testing | gangliosidosis, possibly others | Satoh et al., 2011 | |
| Enzyme activity | Lactate dehydrogenase, aspartate transferase, various proposed uses | Rand et al., 1994a; | |
| Creatine kinase | Rand et al., 1994b; Ferreira, 2016; Mariani et al., 2020; Lampe et al., 2020a; Brune et al., 2022 | ||
| Clusterin | Western blot analysis for clusterin | Chronic spinal cord damage: degenerative myelopathy and chronic IVDD | Shafie et al., 2014 |
Cytologic sample preparation and evaluation
Cytologic evaluation of CSF is recommended and may prove useful any time CSF is collected, even when the TNCC is within normal limits (Di Terlizzi & Platt, 2006). Due to the extremely low cellularity of CSF, cell concentration is required. In the reference laboratory setting, this is typically done with a specialized cytocentrifuge and funnels, which remove excess fluid and concentrate the cells into a small area of the slide (Figure 14.9). Unless a clinic performs a large number of fluid analyses, purchasing a specialized cytocentrifuge is not likely to be a wise business decision. Handmade sedimentation chambers can be attempted, but they have shown poor correlation between cellular percentages and may cause decreased cell counts compared to appropriately cytocentrifuged samples (Wamsley, 2013). Utilizing the remaining CSF in the needle shaft and hub to make a direct line smear has shown strong correlation with samples evaluated in a commercial pathology lab and can help provide rapid, clinically meaningful information prior to evaluation by a clinical pathologist (Newton et al., 2017).
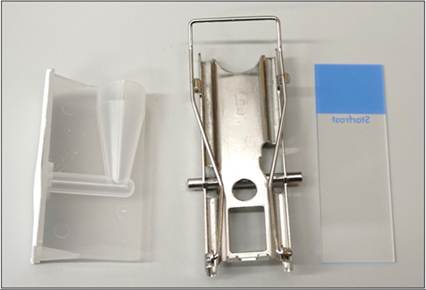
Figure 14.9 The funnel (left) and slide (right) are held together by the clamp (middle). Fluid is loaded into the funnel and then a special centrifuge is used to spin the fluid into a small area on the slide. In the process, excess fluid is absorbed by the pad on the face of the funnel. The end result is considerable concentration of the cellularity into a small area of the slide for cytologic evaluation.
Romanowsky-type stains, such as Wright–Giemsa or quick-type Romanowsky stains, have been used for routine cytologic evaluation of CSF. Cells are typically designated as small mononuclear cells, large mononuclear cells, surface epithelial cells, neutrophils, eosinophils, plasma cells, or mast cells.
Small mononuclear cells have a scant amount of deeply basophilic cytoplasm and round condensed nucleus; in the normal patient they are small lymphocytes (Figure 14.10). Interestingly, during flow cytometric analysis of normal CSF in the dog, only 60% of the small mononuclear cells that are classified as lymphocytes by cell size and cytoplasm characteristics can be labeled with lymphoid markers (Duque et al., 2012). This may simply reflect a deficiency in our ability to label all canine lymphocytes. Additional immunophenotyping studies with larger sample sizes are needed to further examine the breakdown of normal CSF mononuclear populations.
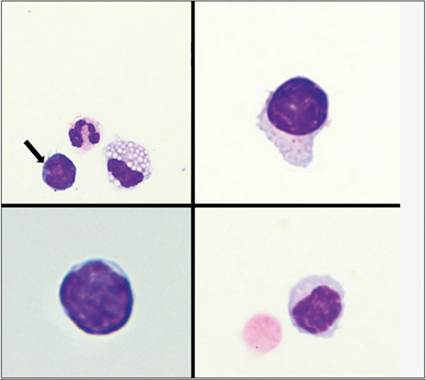
Figure 14.10 Cells counted as small mononuclear cells/lymphocytes have a minimal amount of basophilic cytoplasm, a round nucleus with condensed to clumped chromatin, and lack a visible nucleolus. Nuclei are approximately the size of a red blood cell, as seen in the bottom right image. These cells may also display an increased rim of cytoplasm and contain few punctate, magenta cytoplasmic granules as shown in the top right image. The bottom left image is from a cat, remaining images are from a dog [Wright–Giemsa, 500? magnification (top left image), 1,000? magnification (remaining images)].
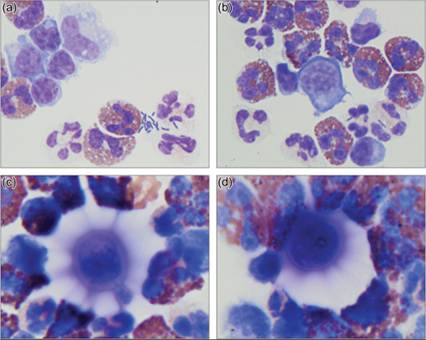
Large mononuclear cells are morphologically consistent with monocytes from the peripheral blood (Figure 14.11). They have more abundant lightly basophilic cytoplasm, which is often vacuolated, and a round to indented to ameboid nucleus.
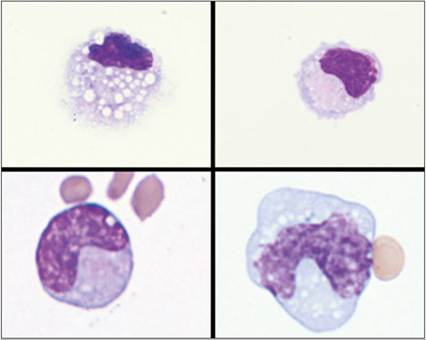
Figure 14.11 Cells counted as large mononuclear cells have an abundant amount of basophilic cytoplasm, an indented to banded to ameboid nucleus, and often contain cytoplasmic vacuoles or a frilled cytoplasmic margin. Cells on the top row from a dog. Cells on the bottom are from a cat (Wright–Giemsa, 1,000? magnification).
‘Surface epithelial cells’ is a general descriptor for a group of choroid plexus epithelial cells, ependymal cells, endothelial cells, and meningeal cells of mesenchymal origin that look cytologically similar (Figure 14.12; Wessmann et al., 2010). They are small uniform cuboidal to columnar cells with moderate to abundant amounts of lightly basophilic finely granular cytoplasm and an eccentrically located small round nucleus with granular to coarse chromatin. Rarely, they are slightly spindloid or are cytologically similar to bland mesothelial cells.
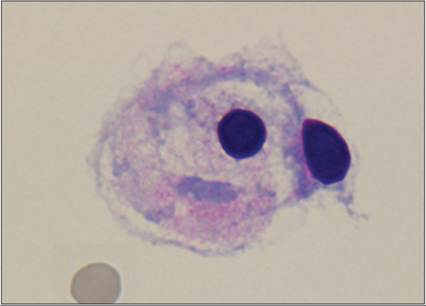
Figure 14.12 Two surface epithelial cells are presented. These cells have basophilic to pink granular cytoplasm and a condensed eccentrically placed nucleus. Surface epithelial cells describe a group of cells that look morphologically similar and typically have no diagnostic significance when found in low numbers (Wright–Giemsa, 1,000? magnification).
The remaining inflammatory cells look similar in CSF and peripheral tissues (Figures 14.13–14.15). If a cytocentrifuge is used for preparation, there will be some attenuation, or splattering, of the cells, which may accentuate a dispersed, hypersegmented, or botryoid appearance (Figure 14.16). Similar effects occur with any sample subjected to cytocentrifugation; experienced cytopathologists learn to read through this artifact.
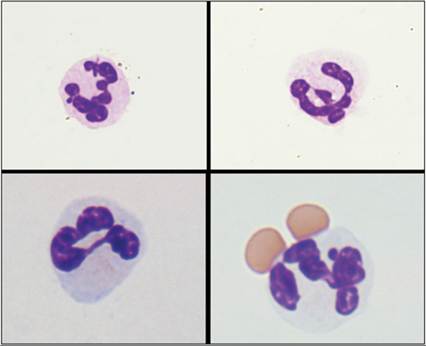
Figure 14.13 Neutrophils in CSF look similar in shape and size to neutrophils found elsewhere in the body. They have a segmented nucleus, moderate amount of pale basophilic cytoplasm, and few fine pink cytoplasmic granules. Cells on the top row are from a dog. Cells on the bottom are from a cat (Wright–Giemsa, 1,000? magnification).
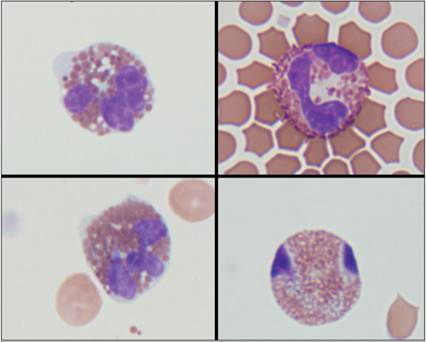
Figure 14.14 Eosinophils are only rarely found in CSF. When present, they have abundant amounts of eosinophilic granules within clear to lightly basophilic cytoplasm, and a lobulated nucleus. Cells on the left are from a dog. Cells on the right are from a cat. Note the distinct variation in granulation between the canine and feline eosinophils (Wright–Giemsa, 1,000? magnification).
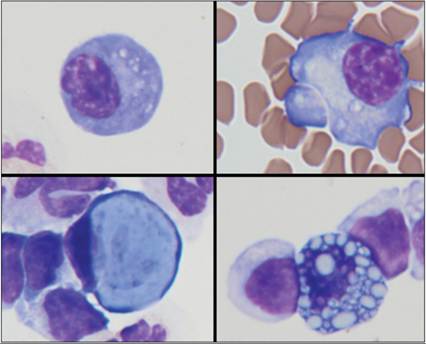
Figure 14.15 Plasma cells can be present when a pathologic process induces intrathecal immunoglobulin production. Two plasma cells are present in the top row of the image; they have small eccentrically placed nuclei with clumped chromatin, basophilic cytoplasm, and a paranuclear clear zone. Two Mott cells with distinct Russell bodies are present in the bottom row. The bottom left Mott cell contains a single large powder blue Russell body, while the bottom right Mott cell displays a more common morphology of multiple smaller Russell bodies. The cell in the upper right corner is from a cat. All other images are from dogs (Wright–Giemsa, 1,000? magnification).
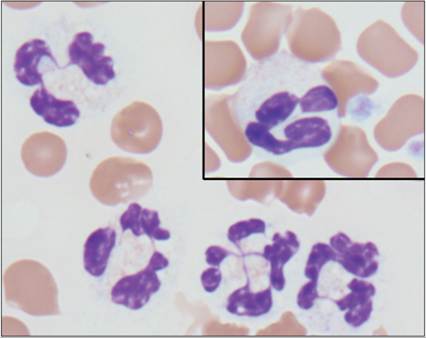
Figure 14.16 Cytocentrifugation concentration techniques often cause mild cell distortion. In this image a peripheral blood neutrophil (upper right) is compared with neutrophils in a cytocentrifuged CSF sample. The attenuated cytoplasm and botryoid nuclear morphology (multiple segments connected by central thin strands of nuclear material) is not uncommon in these types of preparations and should be interpreted carefully. Similar, but less dramatic, distortion can be seen in all cells subjected to cytocentrifugation (Wright–Giemsa, 1,000? magnification).
It is best to perform a 100-cell differential count on every case; however, even a concentrated preparation of a very low cellularity fluid may not contain 100 cells for counting. In such situations, counting all of the cells present on the slide and consideration of the limitations associated with counting very few cells in the differential are recommended.
Additional stains can be used in special cases. These include Gram stain for bacteria, new methylene blue for many organisms, and Luxol fast blue for myelin. Prussian blue staining can help to confirm the presence of iron. Rarely, immunocytochemical staining for specific agents (e.g. feline coronavirus antigen) has been applied to help further identify specific structures or cells in conjunction with other tests (Gruendl et al., 2019).
Normal findings
Due to the slight variations in analytical method, local population, and environment, reference intervals should be established by the laboratory in which the testing is performed for all clinical pathology tests, including CSF analysis. General recommendations are provided in Table 14.3. These are based on published literature and are likely inferior to laboratory-derived intervals (Chrisman, 1992; Di Terlizzi & Platt, 2009).
Table 14.3 Commonly reported normal findings for canine and feline CSF. Reference intervals provided by the laboratory performing the testing are preferred
| Color | Colorless |
| Clarity | Clear |
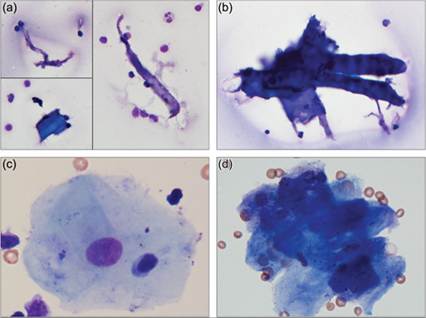
| CSF TP | Cerebellomedullary cistern: 1992). On differential count, these are predominantly mononuclear cells comprised of small mononuclear cells consistent with small lymphocytes and large mononuclear cells consistent with monocytoid cells. There have been conflicting reports regarding whether small mononuclear cells or large mononuclear cells predominate in canine and feline CSF (Rand et al., 1990a, b; Chrisman, 1992; Di Terlizzi & Platt, 2009; Duque et al., 2012; Wamsley, 2013). It is generally accepted that up to 8–10% of the cell count can be nondegenerate neutrophils in normal canine and feline samples with minimal blood contamination (Rand et al., 1990a, b; Chrisman, 1992; Rand et al., 1994a). Similarly, eosinophil counts can be as high as 1% in normal CSF samples. Very rare mitotic figures may be seen. Surface epithelial cells are the most common CNS cells found in CSF cytology samples which may be present in variable numbers depending on the collection technique and other factors (Wessmann et al., 2010). In one retrospective study, the presence of surface epithelial cells was not associated with a specific disease process, TNCC, CSF TP, or inflammatory cell population on cytologic investigation. The suggestion was that these cells are most commonly an incidental finding acquired during needle puncture of the leptomeninges (Wessmann et al., 2010). Surface epithelial cells are usually rare enough that they do not affect the TNCC. Rarely, myelin, neuropil, or neurons have been observed following puncture at either the cerebellomedullary or lumbar location in patients without degenerative diseases (Fallin et al., 1996; Lujan-Feliu-Pascual et al., 2008). A small amount of this material is most suggestive of incidental puncture of the spinal cord and, although not ideal, may not be a pathologic finding. Contaminants Post-collection contaminants are often encountered, including desquamated keratin flakes, cytocentrifuge filter fibers, glove powder, dust, and debris (Figures 14.17a, b). Low numbers of squamous epithelial cells, muscle, or fat are most likely to be contaminants included during collection or sample handling (Figure 14.17c). Large aggregates of anucleate squamous epithelial cells could also suggest an epidermoid cyst (Figure 14.17d). Aspiration of hematopoietic tissue suggestive of bone marrow has been reported following lumbar puncture in the dog (Christopher, 1992). This could be seen following penetration of the hematopoietic cavity within the vertebral bodies during needle placement. Alternatively, the telencephalon is a site of hematopoiesis during embryogenesis. The choroid plexus is derived from these telencephalic tissues and can host hematopoietic tissues well into adulthood, if the need arises (Bienzle et al., 1995). Collection of myeloid tissue is very rarely seen and inclusion of pieces of vertebral bone or cartilage in the sample is rare. Figures 14.17a–d Commonly encountered contaminants in CSF preparations. (a, b) Noncellular debris is commonly found in CSF samples and likely originates from lint and particulate matter that fall into the sample or filter fibers that are shed from the sedimentation apparatus. These are post-collection artifacts and can be ignored (Wright–Giemsa, 500? magnification). (c) Cellular components, such as this nucleated keratinocyte, can be included in a CSF sample during either collection or sample processing. Inclusion of this type of material is not completely avoidable, but care should be taken to minimize contamination from any causes (Wright–Giemsa, 500? magnification). (d) A large aggregate of mature keratin debris is present in a patient that does not have evidence of a cystic lesion on imaging. This is most suggestive of surface epithelial cell contamination (Wright–Giemsa, 1,000? magnification).
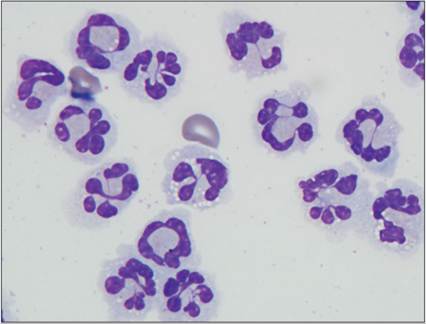
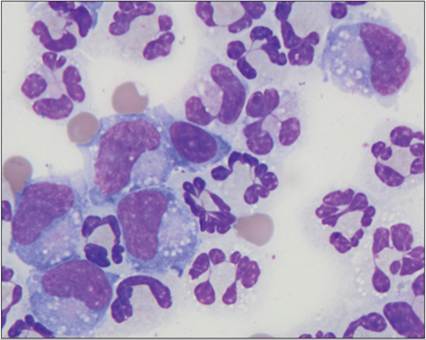
Categories of cerebrospinal fluid abnormal findings Elevated cerebrospinal fluid protein Elevated CSF protein is typically caused by disruption or increased permeability of the blood–brain barrier, including physical damage to the barrier itself, extradural compressive lesions (e.g. IVDD, stenosis), necrosis, exudative processes, or intrathecal production of immunoglobulins (Riond et al., 2013). Protein elevations are suggestive of pathology but not highly sensitive at distinguishing a specific etiology. Dogs with neoplasia, degenerative myelopathy, IVDD, neurovascular disorders, and inflammatory disease have been shown to have higher protein than dogs with idiopathic diseases (Bohn et al., 2006). One study in the cat found that CSF TP 200 mg/dl was highly suggestive for feline infectious peritonitis (FIP) while CSF TP 100 mg/dl was seen with neoplasia, viral disease other than FIP, degenerative disease, and ischemic encephalopathy (Rand et al., 1994a). Iatrogenic hemorrhage during sample collection may also increase CSF protein; this will be discussed later in this chapter (see ‘Hemorrhage’ section). Historically, elevated CSF protein without a concurrent increase in cellularity has been termed ‘albuminocytologic dissociation’. This term is somewhat misleading in that protein and cells enter the CSF through differing, though often concurrent, mechanisms. Increased CSF protein without increased cellularity would suggest that (1) the insult is not drastic enough to induce diapedesis of cells, (2) disruption of the blood–brain barrier is deep enough in the parenchyma that cells crossing the barrier cannot reach the CSF, or (3) pathologic cells originating within the blood–brain barrier are not superficial enough to slough into the CSF. This is evident in several cases where CSF analysis only found elevated TP and histologic evaluation found CNS disease deep in the nervous tissue (Snyder et al., 2006; Lane, 2012b). If a sophisticated single word term for increased CSF protein is desired, the term proteinorrhacia could be accurately used. A recent retrospective study of 497 dogs found 16.5% of dogs met criteria for albuminocytological dissociation or proteinorrhacia, which were most commonly associated with cranial nerve neuropathies, underlying brain neoplasms, brain vascular events, and idiopathic vestibular disease. (Suñol et al., 2021). Altered cell percentages Occasionally, the TNCC will be within normal limits but the percentages of cell types will be outside the expected ratio. If a sufficient number of cells are available to provide an accurate differential and there are no concerns over sample handling or peripheral blood contamination, the increased percentage of a specific cell type may be suggestive of a similar pathology, such as a true pleocytosis of that cell type. It should be remembered, however, that a delay in sample processing will cause changes in cell percentages, even when preservative agents are used. Pleocytosis The Greek-derived term ‘pleocytosis’ is used to describe an increased cell count in the CSF; it means an increase in cells. Pleocytosis is typically categorized based on the major cell type, or combination of cell types, causing the increase. This type of categorization helps to narrow down the pathologic process in play but is rarely definitive for a specific etiology. For example, a neutrophilic pleocytosis is the most common finding with IVDD. However, large mononuclear, eosinophilic, or even lymphocytic pleocytosis can be found in some patients with IVDD. Additionally, a neutrophilic pleocytosis is commonly found in neoplastic and infectious diseases. A typical progression of the predominant inflammatory cell population occurs in the CSF as elsewhere in the body. A more acute or ongoing inflammatory process is likely to contain neutrophils. With chronicity, there is a shift to large mononuclear cells and small mononuclear cells/lymphocytes. Neutrophilic pleocytosis Neutrophilic pleocytosis, or an increased number of neutrophils in the CSF, is seen in cases with an acute inflammatory process (Figure 14.18). Possible causes include nervous tissue trauma (including IVDD and fibrocartilaginous embolus), hemorrhage, infectious agents, neoplasia, steroid-responsive meningitis–arteritis (SRMA), and necrotizing vasculitis. Infectious agents include bacterial (Pseudomonas spp., Streptococcus spp., Mycobacteria spp., and Bartonella henselae and related species), rickettsial (Rickettsia rickettsii, Ehrlichia canis, E. ewingii), fungal (Aspergillus spp., Cryptococcus neoformans, Blastomyces dermatitidis, Fusarium solani, and causes of phaeohyphomycosis), parasitic (Cuterebra spp.), and viral (canine distemper virus and FIP) causes among others. Although protozoal infections are typically expected to produce an eosinophilic pleocytosis, Neospora caninum in dogs and feline protozoal diseases (such as sarcocystosis and toxoplasmosis) have presented with marked neutrophilic or mixed pleocytosis (Lavely & Lipsitz, 2005; Bisby et al., 2010; Gunn-Moore Reed, 2011). Additionally, a suppurative reaction to myelography dyes commonly occurs 24 hours after administration (Widmer et al., 1992). Figure 14.18 An increased cell count with a predominance of neutrophils is termed a neutrophilic pleocytosis (Wright–Giemsa, 1,000? magnification).
As would be expected, a neutrophilic pleocytosis was observed in a study of seven dogs with spinal epidural empyema (Lavely et al., 2006). All CSF samples collected in this study had evidence of disease, independent of which location the sample was collected from. This indicates that sampling CSF cranial to a lesion can be diagnostically useful. However, the mean TNCC of cerebellomedullary samples was much lower than that found on lumbar punctures (15.3 cells/μl and 212.5 cells/μl, respectively). Eosinophilic pleocytosis Eosinophilic pleocytosis has been described in both veterinary and human medicine when eosinophil percentages are >10%, irrespective of what cell type makes up the predominant cell population (Figure 14.19; Levine et al., 2014). In human medicine, >10 eosinophils/μl is seen as an indication of an eosinophilic process (Hughes et al., 2003). This is not to imply that all cases with an eosinophilic pleocytosis will have a low number of eosinophils. Eosinophil percentages as high as 95% with mean TNCC of 84 cells/μl and a maximum cell count of 4,740 cells/μl have been reported in dogs with eosinophilic meningoencephalitis (Windsor et al., 2009). Figure 14.19 Increased number or percentage of eosinophils, which cannot be explained by peripheral blood contamination, is a significant finding, even if the eosinophil population is not the predominant cell type, as in this image (Wright–Giemsa, 1,000? magnification).
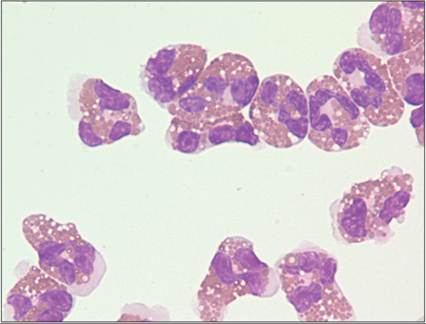
Because low numbers of eosinophils are seen as more significant than low numbers of other cells, care should be taken to ensure that the eosinophils present in a CSF sample are not simply a reflection of peripheral blood contamination. In one study of neurologically healthy cats, eosinophil numbers in CSF were associated with CSF RBC numbers and likely only represented peripheral blood contamination (Chrisman, 1992). In the dog, an association between peripheral eosinophilia and CSF eosinophilia was not found, but likely still exists (Smith-Maxie et al., 1989). Eosinophilic pleocytosis has been identified with infectious agents, IVDD, paraneoplastic processes, and idiopathic eosinophilic meningoencephalitis. Infectious agents reported in the dog include bacteria, Cryptococcus neoformans, Neospora caninum, Balisascaris procyonis, Spirocerca lupi, Toxoplasma gondii, Angiostrongylus cantonensis, Prototheca zopfii, canine distemper virus, and rabies virus (Windsor et al., 2009; Galgut et al., 2010; Lane et al., 2012a; Lunn et al., 2012; Miglio et al., 2013; Chai et al., 2018). Steroid-responsive meningoencephalomyelitis with a predominance of eosinophils has been described in both the dog and the cat (Chrisman, 1992). Eosinophilic meningoencephalitis has been reported in the cat (Rand et al., 1994a). Eosinophil activity has been implicated in autoimmune-mediated neurologic processes and may be the underlying cause of idiopathic eosinophilic meningoencephalitis (Correale Fiol, 2004; Windsor et al., 2009). One case of persistent eosinophilic pleocytosis in a dog with primary intracranial histiocytic sarcoma has been described (Corsini et al., 2022). Lymphoma/leukemia, carcinoma, and several drug reactions have been reported to cause eosinophilic pleocytosis in human medicine (Hughes et al., 2003). Large mononuclear pleocytosis Cells counted in the large mononuclear category are largely members of the monocyte/macrophage lineage (Figure 14.20). A large mononuclear pleocytosis therefore is typically seen in cases with a chronic disease process. Bacterial meningitis usually presents initially with a neutrophilic pleocytosis, which may progress to a large mononuclear pleocytosis as antibiotic therapy is instituted and healing begins. It should also be noted that several primary CNS tumors, such as astrocytomas, liberate cells that are cytologically very similar to macrophages and can be misclassified as large mononuclear cells. Figure 14.20 A large mononuclear pleocytosis is diagnosed when the predominant cell type is large mononuclear cells (Wright–Giemsa, 1,000? magnification).
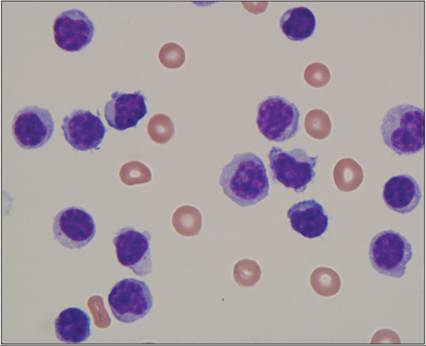
Potential causes of a large mononuclear pleocytosis include chronic trauma (including IVDD), infectious agents, inflammatory processes (granulomatous meningoencephalitis [GME], necrotizing meningoencephalitis [NME], and necrotizing leukoencephalitis [NLE]), and neoplasia. Infectious etiologies reported to produce a large mononuclear pleocytosis include chronic/healing bacterial meningitis and fungal (Histoplasma capsulatum and Blastomyces dermatitidis) agents (Bromel et al., 2005; Lavely & Lipsitz, 2005). Small mononuclear/lymphocytic pleocytosis Cells classified as small mononuclear cells visually resemble small lymphocytes (Figure 14.21). Indeed, most are lymphoid in origin. Very rarely, normal CNS cells and neoplastic cells will have a ‘lymphoid’ appearance in CSF (Spriggs, 1954). For most cases, classifying an increase in small mononuclear cells as a lymphocytic pleocytosis is appropriate, although the rare exception should be remembered. Figure 14.21 When small mononuclear cells consistent with lymphocytes are the most common cell seen, a lymphocytic pleocytosis should be diagnosed (Wright–Giemsa, 1,000? magnification).
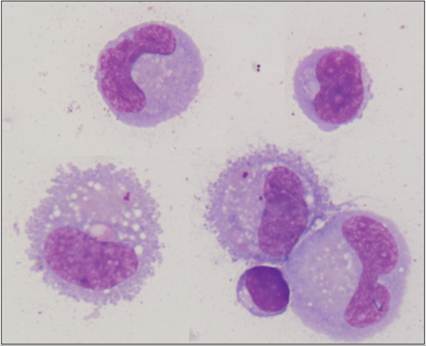
A lymphocytic/small mononuclear pleocytosis can be seen with traumatic (including IVDD), infectious, or inflammatory (GME, NME, and NLE) processes. Infectious causes include viral (canine distemper virus, rabies virus, Borna disease, feline leukemia virus, and others), bacterial (after institution of antibiotics), rickettsial (Ehrlichia spp.), fungal (Coccidiodes immitis), and protozoal (Trypanosoma evansi and possibly Hepatozoon canis) agents (Chrisman, 1992; Lavely & Lipsitz, 2005; Marchetti et al., 2009; Gunn-Moore Reed, 2011; Defontis et al., 2012). Mixed cell pleocytosis A mixed cell pleocytosis by definition does not have a specific cell type that is most predominant. It is typically a mixture of neutrophils, large mononuclear cells, and small mononuclear cells, and possibly includes plasma cells or eosinophils (Figure 14.22). This mixture of cells usually denotes either a transition from an acute to chronic inflammatory process or a process that has been present for an extended period of time but which is still active. Figure 14.22 A mixed pleocytosis is defined by an increased cell count that lacks a single predominant cell type. In this image, neutrophils, small mononuclear, and large mononuclear cells are present. Plasma cells and eosinophils, among others, can also be found in a mixed pleocytosis (Wright–Giemsa, 1,000? magnification).
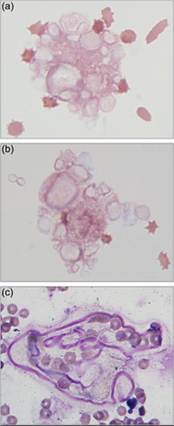
Common causes of a mixed pleocytosis include trauma (IVDD and other spinal cord insults), infectious agents, neoplasia, vascular diseases/infarction, hemorrhagic myelomalacia, and inflammation (GME and steroid-responsive meningoencephalomyelitis). Infectious agents include fungal (Cryptococcus neoformans, Coccidiodes immitis, Blastomyces dermatitidis, and Aspergillus spp.), protozoal (Toxoplasma gondii, Neospora caninum, Babesia spp., and Leishmania spp.) and viral (canine distemper virus and FIP virus) etiologies (Chrisman, 1992; Lavely & Lipsitz, 2005; Lester et al., 2011; Marquez et al., 2013). Bacterial meningitis can rarely display a mixed pleocytosis if the patient is sampled during the transition from a neutrophilic to large mononuclear phase. One such case involving Mycobacterium haemophilum has recently been described in a dog (De New et al., 2023). Nervous tissue Sampling of the solid components of the CNS and its supporting structures during CSF collection is very rare but can occur, either as an incidental, pathologic, or iatrogenic event. As stated previously, surface epithelial cells are the most common CNS cells found and are usually not indicative of pathology. Myelin-like material has been reported in 20% of canine CSF cases (Figures 14.23a, b; Lujan-Feliu-Pascual et al., 2008; Zabolotzky et al., 2010). After Romanowsky-type staining, this material is a pink to purple extracellular foamy to frothy material. It can contain internal circular structures or long ribbon-like filaments that may represent damaged cytoplasmic membranes (Figure 14.23c). Myelin should stain positive with Luxol fast blue stains. The significance of myelin on a cytologic preparation is somewhat ambiguous. Intracellular and extracellular myelin has been reported in a few cases with histologically confirmed degenerative myelopathy, myelomalacia, and IVDD (Fallin et al., 1996; Mesher et al., 1996; Bauer et al., 2006). A much larger retrospective study of 98 dogs found no correlation with any specific disease (Zabolotzky et al., 2010). Instead, extracellular myelin was more commonly found in lumbar punctures and from smaller dogs that showed clinical recovery atypical of myelomalacia. This could suggest that most often extracellular myelin is an artifact. A larger group of dogs with imaging, with or without histologic confirmation of myelomalacia, did not describe myelin specifically, but did indicate that most cases had xanthochromia (Okada et al., 2010). Myelomalacia caused by fibrocartilaginous embolism in five cats failed to show myelin figures; instead a neutrophilic pleocytosis was present in some of the cases (Mikszewski et al., 2006). Neurons and neuropil can occasionally be present in CSF samples (Fallin et al., 1996). These look similar in CSF cytology to their appearance on cytologic smears of brain tissue (see ‘Central Nervous System Cytology’ for a detailed description of these structures). Inclusion of neuropil in the CSF sample is most often an iatrogenic event; however, degenerative and traumatic causes could also be considered. Although significant complications have been observed in some patients when nervous tissue is present in CSF, the presence of these structures should not be equated with ‘pithing’ the patient, as many cases never develop clinical changes following collection (Lujan-Feliu-Pascual et al., 2008). Figures 14.23a–c (a, b) The large aggregate of pink to purple extracellular material is myelin. Note the many round inclusions and lack of overt cellular structure. Crenated red blood cells are also present in the images. (c) Pink to purple ribbon-like material and lighter pink foamy material supportive of myelin are present entrapping red blood cells (Wright–Giemsa, 1,000? magnification).
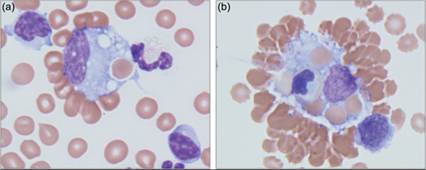
Hemorrhage Increased RBC numbers or RBC breakdown products in a CSF sample can be caused by iatrogenic/collection-associated hemorrhage, trauma, cerebrovascular accidents, or other pathologic processes that cause extravasation of erythrocytes such as neoplasia, vasculitis, and infectious diseases such as leptospirosis, toxoplasmosis, and cryptococcosis. By far the most common cause is contamination during collection. Several clues can help distinguish the presence of RBCs due to peripheral blood contamination from true hemorrhage. A traumatic CSF tap can cause the CSF to appear visually discolored in the needle hub. Often this small amount of hemorrhage will resolve if CSF is allowed to continue to flow out of the needle. If the initial fluid obtained after puncture is red or discolored, collection into at least two tubes is recommended. CSF analysis should be performed on the final tube collected. As mentioned previously, xanthochromia is predominantly caused by in-vivo hemorrhage and should not occur outside the body; a xanthochromic sample can support a diagnosis of hemorrhage in a patient that does not have peripheral hyperbilirubinemia (see Figure 14.5). The presence of erythrophagocytosis, hemosiderin, or hematoidin has been suggested as confirmation of in-vivo hemorrhage (Figures 14.24a, b). Sample handling and time between collection and slide preparation should be considered when using these clues. Erythrophagia, hemosiderin, and hematoidin formation can occur in a very short period of time. Prussian blue staining can be used to confirm the presence of iron and hemosiderin. Interestingly, neither evidence of erythrophagocytosis nor xanthochromia was noted in cats with known, or suspected, CNS trauma (Rand et al., 1994b). Instead, increased numbers of erythrocytes and a mild neutrophilic pleocytosis were noted. A recent case report noted significant evidence of hematoidin and hemorrhage associated with cerebral vascular hamartoma in a 9-week-old Irish Setter puppy (Williams et al., 2023). Attempts to quantify the effects of hemorrhage on other components of the CSF analysis have been contradictory. One retrospective study did not find a correlation between the number of RBCs and TNCC or TP in samples with iatrogenic blood presence in neurologically normal dogs (Hurtt & Smith, 1997). A more recent study in dogs found that serial dilutions with whole blood up to 8,500 RBC/µL did not cause any significant changes in TNCC or protein concentration, and no correlations were appreciated retrospectively in blood contaminated samples up to 210,000 RBC/µL (MacNeill et al., 2018). Other studies support alterations in TNCC or the cellular differential count with much lower degrees of blood contamination (Becker et al., 2008; Doyle & Solano-Gallego, 2009). Several formulae to predict the effect of RBC contamination on cellularity and CSF TP have been suggested (Rand et al., 1994a). Given the apparently poor correlation between RBC counts in blood-contaminated CSF samples, TNCC, and TP across studies, use of correction formulas is not currently recommended (MacNeill et al., 2018). Iatrogenic blood contamination may also affect CSF enzyme concentrations (e.g. LDH, CK) ( Brune et al., 2023). Figures 14.24a,b (a) The central large mononuclear cell is erythrophagocytic. Note how the red cell is within a distinct vacuole. (b) This large mononuclear cell displayed erythrophagia and leukophagia (Wright–Giemsa, 1,000? magnification). (Note: erythrophagocytosis can be used to support a diagnosis of in-vivo hemorrhage. However, if a delay in sample handling occurs, erythrophagocytosis by itself could be caused by collection-associated blood contamination and ex-vivo phagocytosis.)
Infectious agents Direct observation of infectious agents on cytologic samples is both very exciting (for the microscopist) and imminently useful (for the clinician). Bacteria (Streptococcus spp., Staphylococcus spp., Mycobacterium spp.), fungi (Blastomyces dermatitidis, Histoplasma capsulatum, Cryptococcus neoformans, and Aspergillus spp.), protozoa (Toxoplasma gondii, Sarcocystis neurona, and Neospora caninum), and parasites (Angiostrongylus cantonensis, Dirofilaria immitis, Balisascaris procyonis, Taenia spp., Spirocerca lupi, and Cuterebra spp.) have been found on cytologic preparations of CSF (Figures 14.25a–d). These structures look cytologically similar independent of where they are found in the body. As with much of cytology, failing to visualize the organism does not rule out the diagnosis. If post-collection contamination can be ruled out, observation of organisms can be diagnostically useful. Figures 14.25a–d CSF from a 3-year-old, spayed female yellow Labrador Retriever. TNCC = 4,100 cells/μl, CSF TP = 147 mg/dl. (a, b) A mixed pleocytosis consisting of neutrophils, eosinophils, large mononuclear, and small mononuclear cells was found on CSF evaluation. Intracellular and extracellular rod-shaped bacteria are present in the lower right corner of both of these images. The eosinophil population is not commonly encountered in a sample with only bacteria present (Wright–Giemsa, 1,000? magnification). (c, d) A thorough evaluation of the preparation found the cause of the eosinophilia. Large yeasts with narrow based budding and thick mucoid capsule, consistent with Cryptococcus neoformans, were present (Wright–Giemsa, 1,000? magnification; additional digital enlargement used to help display cytologic features of the yeast).
Neoplastic cells in cerebrospinal fluid/neoplastic pleocytosis CSF abnormalities are seen in approximately 90% of cases with intracranial tumors (Platt et al., 2002). A neoplastic population, or suspected neoplastic population, is occasionally found on CSF cytology evaluation. More commonly, an increased CSF TP, inflammatory pleocytosis, and a conspicuous lack of a neoplastic cell population are found in cases with proven CNS neoplasia. Care should be taken not to confuse normal surface epithelium present in low numbers with a neoplastic cell population. Neoplastic cells in fluid can look like they do in their primary site. For example, large cohesive clusters containing up to 200 cells have been observed in CSF with choroid plexus carcinoma (Pastorello et al., 2010). Also, psammoma bodies are found in CSF of some cases with meningioma (Wessmann et al., 2010). Lymphoma in CSF looks similar to lymphoma diagnosed elsewhere in the body although it may not exfoliate as well into CSF, with a recent study revealing that only few CSF samples confirm CNS lymphoma (Durand et al., 2022). However, neoplastic cells in fluid will often take on an altered appearance. Some of the cellular signaling pathways that lead to cytoplasmic differentiation are dependent on interaction with extracellular structures such as basement membranes, stroma, or surrounding cells. Cells deprived of these location-based signals often lose some of their cytoplasmic differentiation. Cytologically, this means that neoplastic cells in fluid are often rounded and occasionally can only accurately be described as discrete cells of unknown origin (Behling-Kelly et al., 2010). A definitive diagnosis of the tissue of origin or possible cell lineage can sometimes be very challenging without immunocytochemical staining for specific cell structures and receptors (Stowe et al., 2012; Cian et al., 2013). Even in cases where many cells are rounded and fairly nondescript, very occasional cell–cell junctions or other cytologic clues can be found that hint at a possible histogenesis. It is wise to carefully evaluate a suspect population. Neoplastic pleocytosis from meningioma, choroid plexus carcinoma, histiocytic sarcoma, lymphoma, and ependymoma have been reported in dogs and cats, among others (Rand et al., 1994b; Dickinson et al., 2006; Harms et al., 2009; Pastorello et al., 2010; Toyoda et al., 2020; Durand et al., 2022). Meningioma is the most prevalent primary intracranial tumor and appears to be the most common cause of a neoplastic pleocytosis. This may not reflect how readily the cells shed into the CSF; in humans, gliomas, including anaplastic astrocytoma and glioblastoma multiforme, are more likely to exfoliate than meningiomas (Chhieng et al., 2002). Additionally, metastatic cancers can be found on CSF evaluation. Further examples of specific CNS neoplasms will be discussed in detail later in this chapter.
More medical literature on Medic.Studio
More on the topic Cerebrospinal fluid analysis:
-
Infectious diseases -
Internal diseases -
Obstetrics and Gynaecology -
Pediatrics -
Veterinary medicine -
-
Conflictology -
Ecology -
Economy -
Finance -
History -
Law -
Medicine -
Philosophy -
Religious studies -
|