Core biopsy processing
Core biopsies may be collected first from the same site used subsequently for aspiration, or from a different site. Once the core has been extruded retrogradely from the needle lumen, it should be handled gently to avoid introducing artifact.
The length of a fresh core should be at least 1.5 cm in cats and small dogs, and 2–3 cm in medium to large dogs, to yield an adequate sample prior to formalin fixation, which induces ~10% tissue shrinkage. Cores from normal marrow are reddish (Figure 19.10 [top]), and those from fibrotic or leukemic marrow are typically whitish. Histologically, good quality biopsy sections should contain at least 3 inter-trabecular spaces free of artifact; therefore, larger cores are likely of better diagnostic quality since they contain a greater number of inter-trabecular spaces (Abrams-Ogg et al., 2012).Biopsy sections of marrow allow determination of cellularity, cell density and adequacy of iron stores, and identification of fibrosis, lymphoid aggregates, megakaryocyte clustering, metastatic tumors, and other focal lesions. Myelofibrosis is rarely identified in marrow aspirates since samples from fibrotic marrow are typically poorly cellular, and the extent of fibrosis cannot be determined without core biopsy. Individual hematopoietic cell identification is more challenging on hematoxylin and eosin (H&E) stained sections than on cytology preparations. Marrow cellularity is a measure of the ratio of hematopoietic to adipose tissue, and correlates with hematopoietic activity. While marrow adipose tissue morphologically appears relatively homogeneous, differential responsiveness to metabolic hormones, reciprocal effects on bone density, interaction with marrow stromal cells, and regulation of hematopoiesis have recently been recognized (Li & MacDougald, 2021b). Neonates normally have marrow cellularity exceeding 90%, and with progressive age this percentage decreases to approximately 10% in healthy geriatric animals (Travlos, 2006).
Increased cellularity or hyperplasia is usually a response to increased peripheral cell demand because of the shortened lifespan of blood cells (e.g. immune-mediated anemia) or chronic inflammation (e.g. pyoderma). Decreased cellularity or atrophy (often inaccurately called ‘hypoplasia’) results from toxic, autoimmune, infectious, drug-mediated, or other injury to hematopoietic precursor cells. 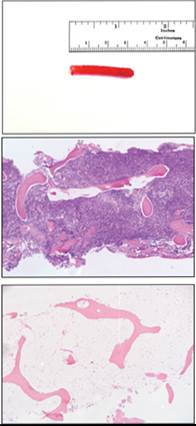
Figure 19.10 (top) A good quality marrow core should be reddish and at least 2 cm in length. (middle) Hypercellular marrow from adult dog with non-regenerative immune-mediated anemia. The sample is >95% cellular, with little to no visible fat. (bottom) Hypocellular marrow from a dog with severe hematopoietic atrophy. Cellularity is of homeostatic hematopoiesis. Maturing post-mitotic granulocytes and late stage rubricytes predominate, with fewer immature cells and relatively few blasts (Table 19.1). The granulocytic-to-erythrocytic cell ratio (G:E) is more accurately determined from differential cell counts rather than estimates. The G:E is sometimes referred to as the myeloid-to-erythroid (M:E) cell ratio; however, since ‘myeloid’ refers to all marrow cells that are descended from common precursors and have plasticity in morphological features, the term ‘G:E’ is more precise and preferred by the authors. The G:E for healthy dogs and cats ranges from ~0.8 to 2.0. An increased G:E cell suggests granulocytic hyperplasia and/or erythrocytic atrophy, while a decreased G:E suggests granulocytic atrophy or erythrocytic hyperplasia.
Table 19.1 Differential cell counts in bone marrow aspirate smears of healthy dogs and cats
| Cell type | Dogs; n = 92, mean % ± SDa | Dogs; n = 43, mean % ± SDb | Cats; n = 7, mean % ± SDc |
| Neutrophil segmenter | 3.32 ± 1.85 | 13.59 ± 4.3 | 12.86 ± 4.85 |
| Neutrophil band | 26.1 ± 5.82 | 11.31 ± 2.87 | 14.1 ± 1.30 |
| Neutrophil metamyelocyte | 5.80 ± 1.71 | 7.65 ± 2.46 | 10.06 ± 3.20 |
| Neutrophil myelocyte | 2.76 ± 0.98 | 5.64 ± 2.15 | 4.31 ± 2.49 |
| Promyelocyte | 2.27 ± 0.99 | 3.23 ± 1.40d | 1.74 ± 1.04 |
| Myeloblast | 0.11 ± 0.14 | 0.08 ± 0.16 | |
| Eosinophil segmenter | 0.20 ± 0.22 | 1.95 ± 0.88e | 0.6 ± 0.20 |
| Eosinophil band | 1.30 ± 0.97 | 0.49 ± 0.40 | |
| Eosinophil metamyelocyte | 0.85 ± 0.62 | 0.54 ± 0.39 | |
| Eosinophil myelocyte | 0.57 ± 0.47 | 0.60 ± 0.42 | |
| Rubriblasts and prorubricytes | 4.43 ± 1.23 | 2.48 ± 1.06 | 1.17 |
| Early rubricytes | 5.06 ± 2.66 | 23.05 ± 5.48f | 4.02g |
| Late rubricytes | 26.0 ± 6.20 | ||
| Metarubricytes | 9.53 ± 3.63 | 21.90 ± 5.67 | 17.57 |
| Monoblasts/promonocytes | 0.37 ± 0.34 | 1.02 ± 0.55 | NR |
| Macrophages | 0.22 ± 0.24 | NR | NR |
| Plasma cells | 2.98 ± 1.65 | 1.46 ± 1.01 | 0.8 |
| Lymphocytes | 6.39 ± 3.75 | 4.38 ± 1.76 | 16.13 |
| Basophils | 0 ± 0.01 | NR | 0.4 |
| Megakaryocytes | 0.13 ± 0.13 | 20.07 ± 11.39g | NR |
| G:E ratio | 1.08 ± 0.61 | 0.89 ± 0.28 | 1.63 ± 0.35 |
| a Mischke & Busse, 2002. | |||
| b Tan et al., 2014. | |||
| c Jain, 1993. | |||
| d Promyelocytes and myeloblasts enumerated together. | |||
| e Enumerated together as ‘eosinophils and precursors’. | |||
| f Enumerated together as ‘rubricytes’. | |||
| g Per non-contiguous 100? magnification field. | |||
| NR = not reported. | |||