Intermediary metabolism: processing and pathways
Now that we have an appreciation for the processing of glucose to make ATP, we will explore some of the alternatives for storing glucose for situations when it is not immediately required for ATP generation, as well as pathways involved in mobilizing carbohydrate reserves.
Similarly, we will also consider pathways that allow other important nutrients, that is, proteins and lipids, to be processed for ATP production. As we shall see, the glycolysis, Krebs cycle, and electron transport chain are central to the capacity to Catabolize many different nutrients.Glycogenesis, gluconeogenesis, and glycolysis
While much of the available glucose is used to produce ATP, when energy demands are reduced, ATP production also declines. Cells have little capacity to "store" ATP; in fact, as ATP concentrations in cytoplasm rise, this produces allosteric inhibition of the regulatory enzyme PFK. So what happens to excess glucose? Fortunately, this rise in ATP stimulates reaction pathways that act to convert excess glucose molecules into glycogen and into fat. Animals have much more capacity to store fat than to store glycogen, but glycogen stores are nonetheless critical, especially for acute energy demands. We will consider fatty acid synthesis (Iipogenesis) and catabolism (lipolysis) in a subsequent section.
When glycolysis is inhibited but glucose is available, this initiates glycogenesis (glyco = sugar + genesis = origin). Like the case with glycolysis, the first step depends on the uptake of glucose and conversion to
glucose 6-phosphate by the ubiquitous enzyme hexo- kinase. However, instead of progressing through the glycolysis pathway, the glucose 6-phosphate is converted to its isomer glucose 1-phosphate by the action of glucose 6-phosphomutase. Interestingly, the ability of this enzyme to bind glucose to its active site is substantially less than for hexokinase.
In other words, its binding site has much less affinity for glucose. This means that when concentrations of glucose are low (likely also associated with a need for energy), then the hexokinase reaction pathway is favored because of the higher-affinity binding site. Of course, high concentrations of ATP also allosterically inhibit PFK. As glucose concentration increases, the law of mass action promotes the activity of the mutase enzyme, thus favoring the path toward glycogen synthesis. The enzyme glycogen synthase catalyzes the attachment of glucose-1-phosphate molecules to growing glycogen chains (see Figure 2.22).As energy demands increase, stored glycogen molecules can be hydrolyzed to provide glucose for use by the cells. This process is called glycogenolysis and is catalyzed by the enzyme glycogen phosphorylase. This regenerates glucose-1-phosphate, which can then be converted to glucose-6-phosphate and processed for glycolysis. In most tissues (muscle cells, for example), the glucose-6-phosphate is effectively trapped in the cells since it cannot interact with membrane carrier proteins. This means that for most cells, glycogenolysis can supply energy for specific cells with stored glycogen only. However, liver cells along with some intestinal and kidney cells express the enzyme glucose-6-phosphatase, which catalyzes the removal of the phosphate group. In these cells, when intracellular concentrations of glucose are increased, some of the glucose can pass back out of cells and into the bloodstream. The capacity of the liver to utilize some of its glycogen stores to replenish blood glucose is critical for homeostasis. Pathways associated with glycogenesis and glycogenolysis are illustrated in Figure 3.10.
Describing gluconeogenesis completes our discussion of glucose metabolism. As we have seen, glucose and its intermediates from glycolysis and Krebs cycle are essential. Maintenance of blood glucose concentrations within relatively narrow boundaries is vital to the homeostasis and health of our livestock and pets.
However, in some situations (especially acute for ruminants), either rations do not supply sufficient carbohydrate or situations of high demand or depleted glucose reserves occur. Fortunately, there is a kind of metabolic backup system. Gluconeogenesis effectively protects the body, and especially the nervous system, which has an absolute requirement for glucose, from hypoglycemia. Fortunately, many nonessential amino acids and some other intermediates can be converted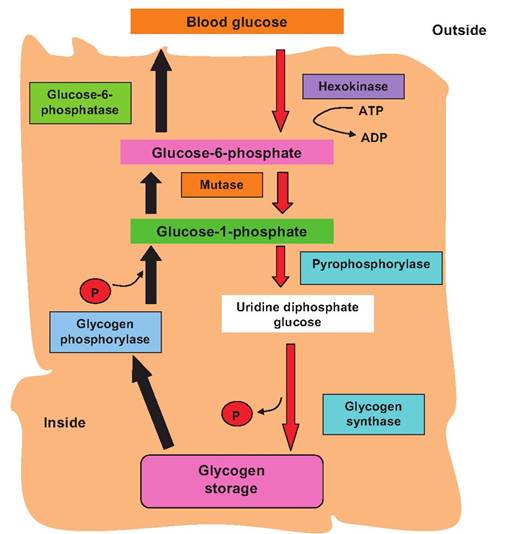
Fig. 3.10. Glycogenolysis and glycogenesis. Biochemical pathways for glycogenesis (red arrows) and glycogenolysis (black arrows) are illustrated. When glucose is abundant, some of the excess is converted into glycogen. When demand for ATP subsequently increases, glycogen is cleaved to provide glucose-6-phosphate for ATP generation. The conversion of glucose-6-phosphate to glucose that can then leave the cell occurs only in some cell types but is especially important in liver cells. Because of the mass of the liver and capacity to store glycogen, hepatocytes can be called upon to maintain blood glucose concentrations.
into glucose. This conversion is acutely driven by increases in stress-related hormones (epinephrine and glucocorticoids) and over longer periods by increased secretion of growth hormone and triiodothyronine. These topics will be covered in greater detail when we consider endocrinology (Box 3.1).
Before we leave carbohydrate metabolism, it is worth considering one of the major pathways that is an offshoot of glycolysis. It is called the hexose monophosphate shunt or pentose phosphate pathway. Its major functions are to provide NADPH (similar to NADH), which is needed for many reactions, particularly fatty acid synthesis, and to supply ribose, which is essential for DNAand RNAsynthesis. This sequence of reactions begins with glucose-6-phosphate, which is converted by the enzyme glucose-6-phosphate dehydrogenase into 6-phosphogluconate with the simultaneous conversion of NADP+ (oxidized) into NADPH (reduced).
The next step catalyzed by the enzyme 6-phosphogluconate dehydrogenase produces another molecule of NADPH, frees CO2, and yields a molecule of the pentose sugar ribulose 5-phosphate. This provides a direct precursor forBox 3.1 Biochemical pathways and "real life"
Are you thinking, "Is the study of all this biochemistry and all of these pathways really relevant to the feeding and care of my animals? Do producers or industry professionals use this information?"
In the dairy industry, concern with the transition period in cows is a topic of intense interest to producers, veterinarians, dairy scientists, and others. The transition period refers to the time from late pregnancy into calving and early lactation. For mature animals, this period is when the majority of mastitis, reproduction issues, and metabolic diseases occur. The same is true for beef, sheep, and pig farmers. The physiological changes and adjustments required for successful birth and lactation put tremendous pressure and stress on new mothers.
Chronic metabolic diseases linked to transition animals directly impact energy production, lipid mobilization, absorption of nutrients, neural regulation of feeding behavior, and intake. Mulligan and Doherty (2008) review the various production diseases of the transition cow, and Contreras and Sordillo (2011) discuss the negative impacts of lipid mobilization on inflammatory responses and functions of leukocytes in transition cows.
Phosphoenolpyruvate carboxykinase (PEPCK) and pyruvate carboxylase (PC) are rate-limiting enzymes that are necessary for hepatic gluconeogenesis and of course de novo synthesis of glucose essential in ruminants. White et al. (2012) reported that selection of cows for increased production alters the expression of these important liver enzymes.
Bionaz and Loor (2012) have described a systems biology approach to understand how gene expression changes are coordinated between the liver, adipose tissue, and the mammary gland during transition as well as in response to various feeding levels.
It is evident that entire classes of related genes (pathways) differentially change in these three tissues to support predominant physiological functions.Interest in biochemical pathways and ultimately the genes that code for the synthesis of the enzymes that drive the pathways, the role of microRNAs, and the transcription factors that regulate gene expression has never been greater.
ribose or deoxyribose synthesis. One way to appreciate the significance of these reactions is to consider how dramatically the activities of selected enzymes change with physiological conditions. For example, Table 3.5 shows the activity of several metabolically important enzymes in mammary tissue from cows just
Table 3.5. Activities of several enzymes involved in NADPH production and fatty acid synthesis in mammary tissue of cows 2 weeks before and 2 weeks after calving.
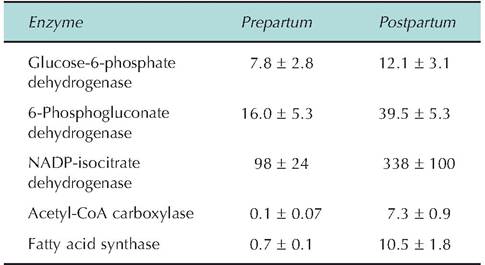
The first two enzymes are part of the pentose phosphate shunt pathway and are involved in generation of the NADPH required for fatty acid synthesis. Isocitrate dehydrogenase, one of the Krebs cycle enzymes, is also involved in NADPH production in ruminants. Acetyl- CoA carboxylase catalyzes reactions between acetyl-CoA and CO2 to form malonyl-CoA, also required for fatty acid synthesis. As the name suggests, fatty acid synthase is directly involved in condensation of malonyl-CoA with acetyl-CoA for addition of two carbons at a time to growing fatty acid chains. Data are adapted from Akers et al. (1981).
Table 3.6. Data for rates of acetate and glucose use for energy production (CO2) and for fatty acid synthesis by bovine mammary tissue slices before and after calving.
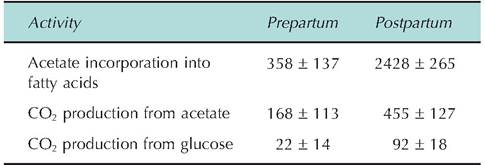
Rates of fatty acid synthesis or CO2 production were calculated from rates of incorporated measures for radiolabeled [2-14Q-acetate or radiolabeled [U-14CFgIucose and are expressed as nanomoles of substrate converted into product per hour per 100mg of tissue.
Data are adapted from Akers et al. (1981).before and after parturition. Remember, this is a time of dramatic changes in the synthetic activity of the mammary gland as lactation is initiated. The corresponding needs for energy and precursors for milk component biosynthesis are also elevated. Similarly, Table 3.6 shows metabolic flux data for bovine mammary tissue slices during the same period. Specifically, rates of oxidation of acetate and glucose as well as use of these substrates for milk component biosynthesis are shown. Do the changes in enzyme activities and metabolism reflect your reasoning of what the physiological status of the mammary tissue would be at these times? Remember this is just one selected example; during periods of rapid growth, work, and so on, many tissues exhibit dramatic changes in tissue and cell activity.
Lipogenesis and lipolysis
Although storage of glucose in the form of glycogen is critical, for longer-term energy needs, lipids sequestered in the adipocytes of adipose tissue supply the bulk of the fuel necessary for ATP synthesis. Depending on immediate needs, a variable amount of the carbohydrate of the diet is also converted into triglycerides before ultimately being catabolized. For many tissues, presentation of the fatty acids removed from storage provides the major carbon source for energy generation. As the principal form of energy storage in the body, triglycerides have distinct advantages over both proteins and carbohydrates. The first is that the caloric value -38.9 kJ/g of a triglyceride is more than twice that of either glucose or protein. Second, storage in adipocytes is dense, compact, and occurs with much less water. Third, the catabolism of fatty acids provides metabolic water when oxidized, a distinct advantage to animals living in dry environments. The formation of triglycerides is called Iipogenesis, and the breakdown of triglycerides is called lipolysis. Let us consider how fatty acids are catabolized for energy production.
Whether they are derived from the diet or from storage, fatty acids are broken down into acetyl-CoA which, as we saw with glucose oxidation, enters the Krebs cycle for subsequent processing. Fatty acid oxidation first requires activation of the fatty acid. This reaction occurs both inside the mitochondria and in the cytoplasm. If it occurs in the cytoplasm, activated fatty acids cross the membrane in a process that requires carnitine. Carnitine is a lysine derivative that markedly stimulates the oxidation of fats. The subsequent cleavage of the fatty acids takes place inside the mitochondria as two carbon units (essentially acetic acid or acetate molecules) are produced and fused with CoA to produce acetyl-CoA molecules. These acetyl-CoA molecules transit the Krebs cycle to produce a small amount of ATP by substrate-level oxidation but, more importantly, reduced coenzymes (NADH + H and FADH2) as illustrated in Figure 3.7. This process is called beta-oxidation because the carbon atom in the third or beta position of the fatty
acid chain is oxidized with each cleavage step. This reaction sequence is illustrated in Figure 3.11. Table 3.7 summarizes the total ATP produced from the oxidation of a common fatty acid, 18-carbon oleic acid. Although the most common fatty acids from stored triglycerides are typically longer than six carbons, even the oxidation of the 6-carbon fatty acid caproic acid is more efficient(44 vs. 38 ATP) than the oxidation of glucose (also six carbons). Fatty acids are activated via hydrolysis of ATP coupled with CoA. If first activated in the cytoplasm, the fatty acid is passed into the mitochondria by carnitine for further processing. With each cleavage cycle, this generates one molecule
Table 3.7. Summary of ATP production from β-oxidation of the 16-carbon oleic acid.
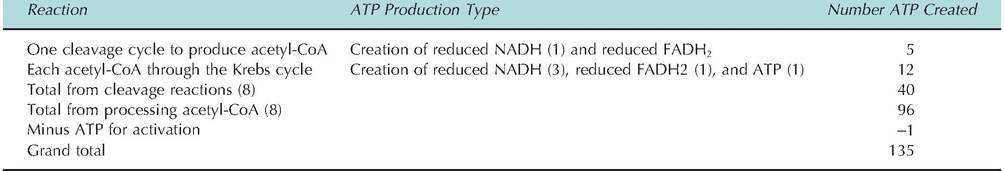
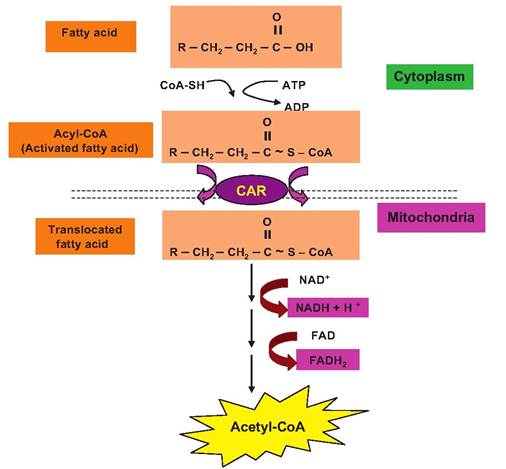
Fig. 3.11. Overview of β-oxidation. Fatty acids are activated via hydrolysis of ATP coupled with coenzyme A. If first activated in the cytoplasm, the fatty acid is passed into the mitochondria by carnitine (CAR) for further processing. With each cleavage cycle, this generates one molecule of reduced NAD, one of reduced FAD, and finally, cleavage of the 2-carbon end group to produce acetyl-CoA. This process repeats until the final four carbons of the fatty acid chain are cleaved to make two additional molecules of acetyl-CoA.
of reduced NAD, one of reduced FAD, and, finally, cleavage of the 2-carbon end group to produce acetyl- CoA. This process repeats until the final four carbons of the fatty acid chain are cleaved to make two additional molecules of acetyl-CoA. In this manner, long- chain fatty acids are degraded completely into these 2-carbon acetyl-CoA units. The β-oxidation pathway oxidizes fatty acids with an odd number of carbon atoms until 3-carbon (propionyl CoA) residue remains. This compound is converted into succinyl-CoA, a constituent of the Krebs cycle. Of course the capacity for storing fat as an energy substrate is very large, given the capacity of animals to deplete and replenish adipocytes.
As a dramatic example of utilization of body fat reserves, consider the capacity of high-producing dairy cows to mobilize fatty acids to supply the energy needed for milk production. Paradoxically, just at the time when the cow needs the most nutrients, there is routinely a decline in voluntary dry matter intake (VDMI) in the periparturient period. This decline begins in late lactation and continues into early lactation. For modern dairy operations, management of these transition cows is critically important. Most health problems of both a metabolic and infectious nature occur in early lactation. The typical decline in VDMI coincides with marked changes in reproductive status, body fat status, and the dramatic metabolic adjustments necessary to support energy, protein, and mineral demands of milk secretion. Just on the basis of energy needs the changes are staggering. It is estimated that fetal development demands on day 250 of gestation (~3 weeks before calving) average 2.3 Mcal/ day. The requirement for the lactating cow producing 30kg of milk per day is estimated at 26Mcal/day. Eating behavior and intake result from multiple interactions between neural inputs associated with the feed, feed presentation, management, metabolic conditions, and endocrine signals are poorly understood but especially so in ruminants. Dramatic changes in VDMI occur both within and between lactations in dairy cows. Pregnant dairy heifers, for example, begin to progressively reduce their VDMI beginning several weeks before calving approximately 0.17 kg/week until 3 weeks before calving. For primiparous and multiparous cows given diets of constant composition, milk yield typically peaks at about 6 weeks postpartum, but maximum intake is not achieved until 8-22 weeks postpartum. Indeed, the demands of lactation require that the high-producing cow mobilizes body tissues through much of the first one-third to one-half of lactation so that the animals are in a prolonged period of negative energy balance. Difference in the rate of intake recovery postpartum depends on the diet fed in early lactation as well as the degree of fatness or body condition score (BCS) at the time of calving. The normal feeding behavior is also markedly impacted by both clinical and Subclinical infections, so that appetite and performance is reduced in sick animals.
As championed in a review by Bauman and Currie (1980) and emphasized by Ingvartsen and Andersen (2000), the onset of lactation in high-producing dairy cows requires a coordinated physiologically mediated reallocation Ofbiochemical resources—homeorrhesis— to allow high milk production while maintaining homeostasis. Because of the premium placed on glucose to supply precursors for lactose synthesis and the general energy requirements of the udder, changes in circulating nonesterified fatty acids (NEFA) and glucose are especially dramatic at calving. Concentrations of NEFA immediately at postpartum are dramatically increased while glucose in the blood is reduced (Figure 3.12). This reflects the mammary demand for glucose and the corresponding stimulation of lipolysis and the use of lipids as an energy source.
Table 3.8 provides a partial listing of metabolic adjustments that accompany the onset of lactation. It is important to appreciate that similar changes occur in all lactating mammals. We have used the dairy cow as an example because the effects are especially
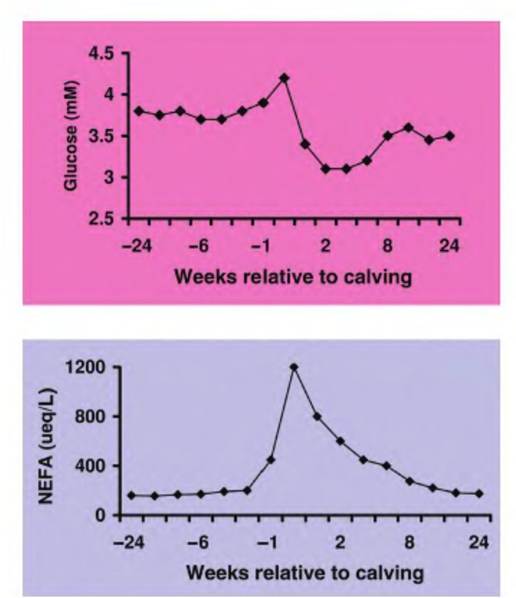
Fig. 3.12. Plasma glucose and nonesterified fatty acids. Changes in plasma glucose and nonesterified fatty acids (NEFA) in heifers in the period before and after calving are shown. Data are adapted from Ingvartsen and Andersen (2000).
Table 3.8. Summary of major metabolic adjustments associated with the onset of lactation in high-producing dairy cow.
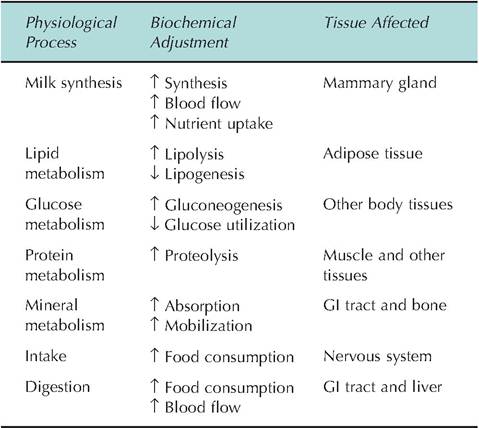
Data are adapted from Bauman and Currie (1980) and Ingvartsen and Andersen (2000).
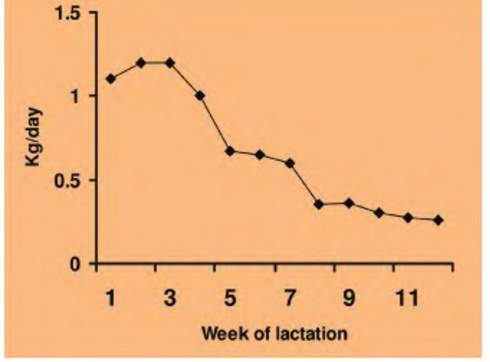
Fig. 3.13. Fat mobilization in lactating cows. The estimation of the amount of fat mobilized per day to meet the demands of lactation in a high-producing dairy cow is illustrated. The cows in this study averaged 9534 kg of milk over a 3O5-day lactation. Adapted from Bauman and Currie (1980).
dramatic because of the selection for increased milk production. The increase in milk yield during early lactation precedes increases in appetite, so that the animals are in a negative energy balance and thus there is dramatic lipid mobilization over the first 12-16 weeks of lactation. It is estimated that the body fat needed to meet the demand is equivalent to more than 50% of the milk fat yield during this period. These animals typically mobilize 50-60 kg of fat, -10% of body weight and likely 50% of body fat reserves. Figure 3.13 illustrates the mobilization of lipids to
Table 3.9. Changes in volume of adipocytes from ewes between late pregnancy and mid-lactation.
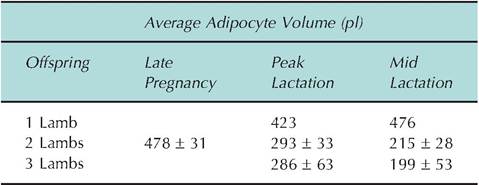
Data adapted from Vernon and Flint (1984).
supply the demands of lactation in a high-yielding dairy cow. Similar responses occur in other lactating mammals. For example, Table 3.9 shows changes in mean adipocyte volume in sheep between late pregnancy and mid-lactation related to the number of suckling lambs. Clearly, increased demand has a dramatic impact on adipose tissue metabolism.
Let us now consider how fats are liberated from storage and the processing required for making fatty acids from the triglycerides available. Signals are required to stimulate the breakdown of triglycerides from storage in the adipocytes. Both the nervous and endocrine systems are involved. As a reminder, biologically important lipids fall into two broad classes:
(1) structural lipids, for example, phospholipids, and
(2) neutral fat, for example, triglycerides stored as an energy reserve. Blood plasma averages about 300 mg of lipid per IOOmL of blood. About 50% is typically phospholipid, 30% triglycerides, and 20% cholesterol, and there is a variety of other lipids. Included in this fraction are the nonesterified or free fatty acids (FFAs). These molecules have a rapid turnover and are the main form in which fatty acids are transferred from storage in adipocytes for oxidation in other cells. Interestingly, oxidation of fatty acids in the adipocytes of white adipose tissue is very limited. If you consider the structure of these cells, this is easy to explain. The cytoplasmic compartment of the cells is limited to a small crescent containing the nucleus, a bit of rough endoplasmic reticulum (RER), and a few mitochondria. The bulk of the cell area is the stored lipid droplet. With a minimal number of mitochondria, β-oxidation of fatty acids is limited. In contrast, a specialized type of adipose tissue, brown adipose tissue, has an abundant blood supply and numerous mitochondria. This type of adipose tissue contains adipocytes with many small lipid droplets. This tissue is vital for thermogenesis in many newborn animals as these cells oxidize large amounts of lipid and generate heat that is essential to the neonatal homeostasis. However, the white adipose tissue reserves are critical for maintenance of homeostasis or to meet energy demands in particular physiological circumstances. Figure 3.14 provides an
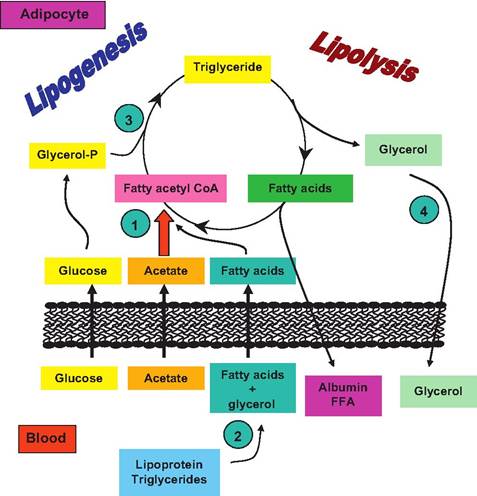
Fig. 3.14. Overview of Iipogenesis and lipolysis. Overall aspects of Iipogenesis and lipolysis in a ruminant adipocyte are illustrated. Included are (1) de novo fatty acid synthesis, (2) uptake of preformed fatty acids from blood, (3) fatty acid esterification, and (4) lipolysis. For nonruminant species, uptake of acetate (red arrow) would be of minor importance. In these animals, glucose would act to supply the carbon skeleton for both glycerol and growing fatty acid chains. Adapted from Bauman and Davis (1974).
overview of lipid synthesis and mobilization specifically oriented to ruminant adipose tissue and the significance of acetate availability. For monogastric species, little acetate appears in the blood so glucose is the predominant substrate for lipid synthesis.
Given the need to carefully control the release of fatty acids to supply critical energy needs, especially at times when the diet may be limited or demands are increased, it is not surprising that multiple regulators are involved. The neurotransmitter norepinephrine, locally released by nerves supplying adipose tissue, in conjunction with glucagon and epinephrine released into the circulation, are major stimulators of lipolysis. As we will see in our discussion of the fight or flight reactions that occur with stimulation of the sympathetic division of the autonomic nervous system, making energy available in emergency or stress situations is critical. This means that the very rapid response that occurs with nervous system stimulation is reinforced by more prolonged secretion of the hormones epinephrine and glucagon. An excellent example of an even more prolonged adjustment to promote lipid mobilization occurs at the onset of lactation in many mammals (see Fig. 3.13). It is now known that genetically superior dairy cows, for example, have an enhanced capacity to respond to the energy demands
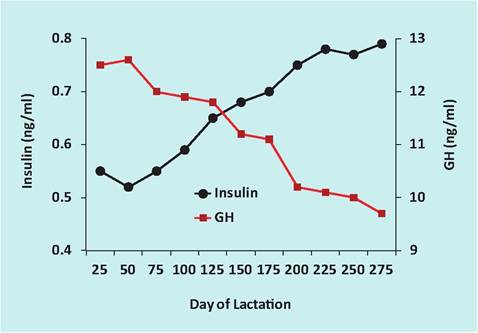
Fig. 3.15. Changes in GH and insulin in lactating cows (Herbein et al. (1988); Koprowski and Tucker (1 973)).
of lactation with a greater-than-average capacity to mobilize nutrients from body stores. It is hypothesized that this is in part due to enhanced secretion of growth hormone (GH) in these animals. Logically, changes in average circulating concentrations of GH and insulin (which promotes Iipogenesis) are reversed during the course of lactation in dairy cows. During early lactation, when the animals are in a net negative energy balance, concentrations of insulin are suppressed and those of GH are enhanced. As the animals begin to consume more feed and milk production declines, after the peak of lactation, the situation is reversed. GH concentrations decline (less need for nutrient mobilization from storage), but insulin concentrations increase (to store excess nutrients). This is illustrated in Figure 3.15.
Not only are there adjustments in the secretion of hormones that affect lipid tissue metabolism, there are also modifications in the activity of the tissue itself. For example, sensitivity of the tissue to the effects of epinephrine or norepinephrine also changes as cows enter lactation. Adipose tissue becomes more sensitive to these catecholamines, and rates of fatty acid re-esterification (related to storage) drop precipitously. These responses are produced by changes in the number of hormone receptors expressed by the target adipocytes as well as alterations in the signaling pathways within the cells. As illustrated in Chapter 12 (Endocrine System), there are very complex, yet elegant interactions between the nervous system, endocrine system, and cellular biochemistry to maintain homeostasis and to prepare for specific physiological events. The data illustrated in Figure 3.16 show very clearly some of the adjustments in adipose tissue physiology that enable pregnant animals to prepare for the metabolic demands of lactation. In this experiment, adipose tissue was collected by biopsy at varying
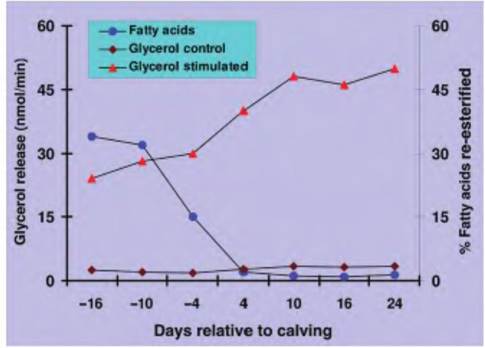
Fig. 3.16. Adipose tissue metabolism. Rate of glycerol release from adipose tissue explants incubated with or without norepinephrine and the proportion of fatty acids re-esterified (a measure of synthesis) in the absence of norepinephrine is illustrated. Notice that there is an increasing rate of stimulated lipolysis that begins before the actual onset of milking. Data are adapted from Metz and Van Den Burgh (1977).
times before and after calving. The tissues were minced and incubated in the absence (control) or the presence of norepinephrine. The rate of release of glycerol (a measure of the rate of lipolysis) was determined. Addition of norepinephrine markedly stimulated lipolysis, but tissues collected immediately after calving were more responsive. Furthermore, the rate of fatty acid synthesis (re-esterification) began to decrease before calving and was marked inhibited after the onset of milk secretion. These metabolic adjustments in adipose tissue begin to occur before the actual onset of milk secretion after calving and the first milking. This suggests that changes in neural and endocrine signaling pathways act to anticipate subsequent needs. As an example, the supply of fatty acids to various tissues is regulated by two lipases: (1) lipoprotein lipase that resides on the surface of the endothelial cells to cleave triglycerides from circulating chylomicra and (2) hormone-sensitive lipase that exists inside the adipocytes. Hormones that increase intracellular concentrations of the cyclic AMP (cAMP), a second messenger molecule, in adipocytes increase lipolysis. This is because high concentrations of cAMP activate an intracellular kinase that converts the hormone-sensitive lipase from an inactive to an active conformation. Since this reaction is initiated by the binding of norepinephrine or epinephrine to β1- adrenergic receptors on the surface of adipocytes, changes in receptor number or the concentration of their ligands in the fluid surrounding the cells impacts the rate of lipolysis. The relationship between receptor binding and lipolysis is illustrated in Figure 3.17.
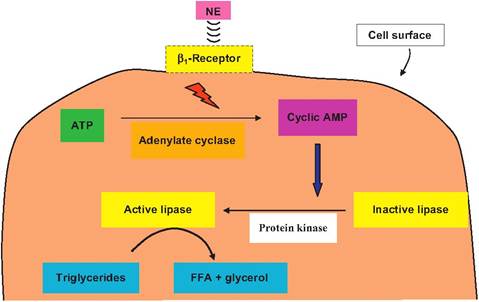
Fig. 3.17. Adipose tissue signaling. The association between binding of norepinephrine to the β1-adrenergic receptor on the surface of an adipocyte and activation of an intracellular lipase is illustrated. The binding reaction promotes the activation of the enzyme adenylate cyclase, which converts ATP to cyclic AMP (cAMP). Increased concentrations of cAMP activate a protein kinase by adding a phosphate group to the inactive lipase enzyme, changing its conformation, thereby allowing the lipase to actively catalyze the cleavage of triglycerides into free fatty acids (FFAs) and glycerol. This internal lipase is called hormone sensitive because of the ability of catecholamines and other hormones to induce the appearance of intracellular cAMP and therefore increase the rate of lipolysis.
Before we leave the topic of lipolysis, we should mention one of the more common disorders related to lipid metabolism, namely, ketosis. It is likely the most common metabolic disorder of lactating cows but can be a problem in many animals. Ketosis can be simply defined as the accumulation of excess concentrations of acetoacetic acid (AAA), β-hydroxybutyric acid (BHBA), and decarboxylation products acetone and isopropanol in various body fluids. In many tissues, acetyl-Co A molecules can condense to form acetoacetyl- CoA. The liver (unlike most tissues) expresses a deac- ylase enzyme that cleaves this to form AAA. This material is converted to BHBA and acetone that diffuses into the bloodstream. These compounds are called ketone bodies. Since these compounds are Catabolized slowly, continuing production can eventually lead to metabolic acidosis, a condition that can be severe and even fatal. The fundamental problem is an impairment of the entrance of acetyl-CoA into the citric acid cycle because of the relative lack of oxaloacetic acid. This leads to increased concentrations of acetyl-CoA and ketone formation or ketogenesis. Three conditions that lead to low intracellular glucose supplies are starvation, diabetes mellitus, and feeding of a high-fat, low-carbohydrate diet (in monogastric species). In the case of diabetes, uptake of glucose by the cells is impaired so signals are generated to supply energy demands by oxidizing fatty acids. This only exacerbates the problem and leads to even more accumulation of ketone bodies. When most of the energy is supplied by fat (high-fat, low-carbohydrate diet), there is a carbohydrate deficiency because there is no major route for converting fats to carbohydrates. Liver cells are also to likely become engorged with fat (fatty liver syndrome), which impairs cellular functioning. (Box 3.2)
Box 3.2 The fat debate
Does understanding fat synthesis, lipid accretion, or capacity for lipid mobilization have relevance in animal agriculture or the pet industry?
The popular press has repeatedly reported on the scourge of childhood obesity.
Ironic isn't it, the desire for an appropriately marbled steak versus the desire for lean chicken or pork or altered lipid content of eggs.
As you have learned, unneeded deposition of lipid in adipocytes is energetically wasteful and is practically an economic loss unless producers are paid on the basis of fat content of animals or animal products.
Metabolic impairments that are influenced by feeding management can lead to fatty liver syndrome in dairy cows and associated increased risk of disease and poor milk production.
Dodson et al. (2010) discussed issues related to adipocyte physiology, animal production concerns, and how meat animals can serve as experimental models to solve human-specific problems. Zhao et al. (2010) describe differences in the proteins expressed (proteomic analysis) in adipose tissue of beef cattle crosses in the hope of discovering markers to identify animals with genetic differences in fat deposition. Annexin 1, a protein that binds to cell membranes in a calcium-dependent manner, was significantly lower in animals with reduced fat deposition irrespective of the breed combination. This is likely to lead to studies to determine how annexin 1 is involved in adipogenesis by using adipocytes in cell culture. In addition, they found that glycerol-3-phosphate dehydrogenase, malic enzyme 1, and isocitrate dehydrogenase were more abundant in samples from cattle with great fat deposition. Glycerol-3-phosphate dehydrogenase is involved in triglyceride synthesis, while the other two enzymes regulate glycerol degradation and oxidative decarboxylation of malate to create pyruvate, respectively.
The bottom line is that understanding biochemistry, metabolic pathways, and the related physiology is key to the development of tools to improve animal efficiency, increase yield of desirable animal products, and maintain animal health and well-being.
So what are some of the conditions that promote this chain of events? It is most likely to occur in dairy cows in early lactation (between 2 and 6 weeks postpartum). Symptoms can include decreased appetite, lethargy, decreased milk production, reduced body weight, and an acetone-like odor of milk or exhaled air. However, the disorder can be either Subclinical or clinical. With clinical ketosis, the need for treatment and losses in milk production become readily apparent, but Subclinical ketosis is much more problematic. In the absence of overt testing, these cows are often described as "not doing as well as expected." Kronfeld (1982) distinguished four classifications of ketosis:
• Primary underfeeding ketosis. This is essentially a result of poor management, that is, failure to offer enough acceptable feed to the cow.
• Secondary underfeeding ketosis. The cow's VDMI is reduced by disease.
• Ketogenic ketosis. The cow is consuming a diet with elements that promote production of ketones.
• Spontaneous ketosis. The cow is consuming an adequately balanced diet, but ketosis occurs nonetheless.
Whatever the cause, lactation ketosis is a worldwide problem and is seemingly most prominent in high- producing herds. However, incidence, especially of Subclinical ketosis, can vary substantially between herds irrespective of average milk production. This suggests that its etiology is complex. Some common features are that ketotic cows are usually in a negative energy balance and that frequency of clinical ketosis is often greatest at about the time of peak milk production postpartum. Two reliable biochemical changes are a reduction in blood glucose and increased concentrations of ketones in blood, urine, and milk. This has led to renewed interest in development of reliable screening methods to detect Subclinical ketosis via monitoring of ketones, especially in milk samples. Animals destined to develop ketosis seemingly fail to maintain blood glucose concentrations so that the energy demands begin to be met by inappropriate overmobilization of adipose stores. Increased catabolism of the fat leads to elevations in blood lipids and transport of fatty acids into the liver in greater quantities than the liver can metabolize. Acute treatments typically involve glucose infusions or injections to provide alternative energy substrates and/or treatment with glucocorticoids to stimulate the cow's own capacity for gluconeogenesis. The reasons why some animals seemingly readily adapt to make the metabolic adjustments required for onset of lactation and high milk production are unknown. It is interesting, however, that genetically superior animals (with respect to milk production) often secrete more GH and that one of the salient properties of GH is to promote mobilization of nutrients.
Paradoxically, excessively overfeeding cows during the dry period, which would logically allow the accumulation of adipose tissue stores for use in lactation, actually impairs the capacity of the cow to mobilize tissue nutrients in early lactation. Most nutritionists recommend that cows be moderately fed during late lactation and that concentrated feeding be increased only just before calving and then into early lactation. Prevention of ketosis is focused on management of feeding practices in the dry period and in early lactation. Since overfeeding and excessive weight gain in the dry period adversely affect the capacity of the cow to mobilize nutrients, attention to dry cow management is essential. Because of the economic problems associated with ketosis and the subtle nature of sub- clinical cases, there has been increased attention directed toward development of easy-to-use cow-side tests. Blood concentrations of BHBA greater than 1200μmol∕L can be used to classify normal from sub- clinically ketotic cows.
Let us now consider some of the events associated with conditions when energy supplies are plentiful and excess nutrient resources are being used to "restock" adipose tissue. The fatty acids in the triglycerides of the adipocytes can be derived by de novo synthesis (within in the tissue) or can be "deposited" following digestion and absorption of dietary lipids. For the preformed dietary fats, this requires first the action of lipases in the GI tract and absorption of liberated fatty acids into the intestinal cells. As these dietary fats are hydrolyzed and emulsified by the actions of bile salts and phospholipids, particles called micelles are formed. These aggregates have the polar portion of the bile salts to the outside and the nonpolar cholesterol-like portion interacting with the fatty acids, monoglycerides, and cholesterol oriented to the center of the sphere. The cells absorb the micelles and process their contents. Fatty acids of 12 carbons or less can pass into the bloodstream to be transported as free (nonesterified) fatty acids. The larger fatty acids are re-esterified to triglycerides and along with cholesterol become coated with a layer of lipoprotein and phospholipids to generate chylomicra, which leave the intestinal cells and enter the lymphatic drainage. Once they appear in blood circulation, the chylomicra can be utilized to supply the fatty acids for regenerating adipose tissue fat. In monogastric species, after a fat-rich meal, so many of these particles can appear in the blood that the plasma can have a milky appearance (Iipemia). The chylomicra are removed by the action of the enzyme lipoprotein lipase, which is sequestered on the surface of the endothelial cells of capillaries. When activated, the enzyme catalyzes the hydrolysis of triglycerides, making fatty acids and glycerol available to the surrounding tissues. In adipose tissue, the fatty acids and glycerol are absorbed by the cells and re-esterified to form much of the neutral fat stored in the cells.
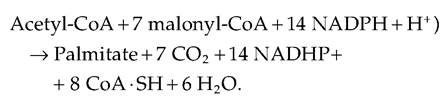
The direct synthesis of fatty acids is called de novo synthesis. Since nutrients other than fats can be consumed or fed in excess, there are alternative methods of fat synthesis, which allow storage of carbohydrates and proteins as energy sources in the form of neutral fat. One of the more common fatty acids is palmitate (C160). The overall reaction to produce palmitate is illustrated in the following equation:
Let us consider the source for these ingredients. First, our discussion of carbohydrate metabolism provides a ready explanation for the source of the acetate to make acetyl-CoA, that is, the oxidation of glucose or other sugars. The malonyl-CoA can be produced from acetate or butyrate. The coenzyme NADPH is generated from the pentose phosphate shunt or in ruminants by isocitrate dehydrogenase in the cytoplasm. A number of amino acids can be Catabolized to produce intermediates of glycolysis or Krebs cycle that can be used to make acetate. Ruminants exhibit extensive fermentation of dietary carbohydrates and produce large amounts of the volatile fatty acids: BHBA, acetate, and propionate. Some of this acetate is directly used for ATP production or shunted to fatty acid synthesis. Similarly, butyrate is readily used in fatty acid synthesis. Thus, availability of acetate is a key to fatty acid synthesis. Because ruminants depend on gluconeogenesis to maintain blood glucose concentrations, they have evolved mechanisms to minimize the use of glucose for direct synthesis of fatty acids, a glucose- sparing effect. In fact, in the case of lactating cows, the demand for glucose is even greater with the need for lactose synthesis by the mammary gland. Whereas in nonruminants glucose oxidation leading to pyruvate oxidation in the mitochondria produces citrate that can pass into the cytoplasm to be used to make acetyl- CoA for fatty acid synthesis, this is minimal in ruminants. There are many details concerning fatty acid synthesis, that is, control over the degree of desaturation and chain length, that are beyond the scope of our text, but a rudimentary description of the process is in order. Figure 3.18 and Figure 3.19 illustrate differences in fatty acid synthesis pathways in ruminant and nonruminants.
In cows and other ruminants, the precursors for de novo fatty acid synthesis are acetate and BHBA. BHBA appears in the first four carbons of the majority of fatty acids made in the cells or the molecule is cleaved into 2-carbon units to be used as acetyl-CoA. Acetate yields
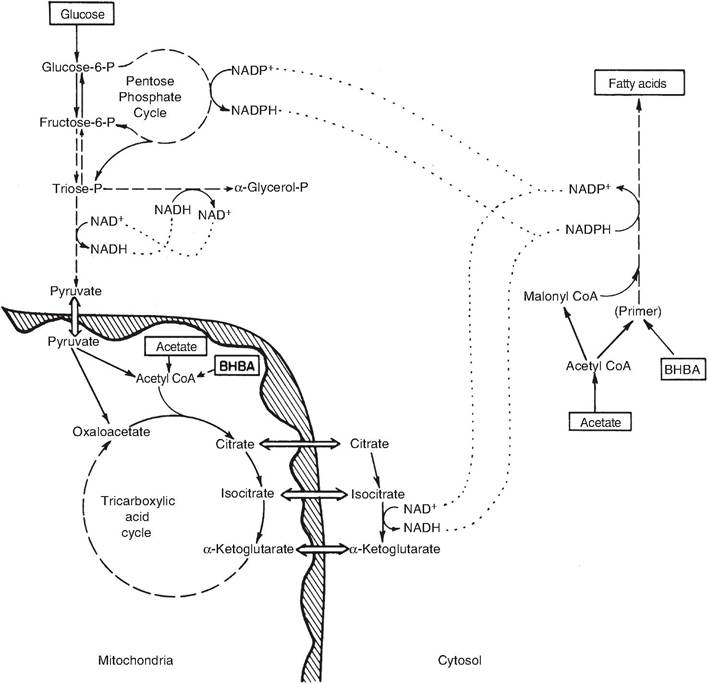
Fig. 3.18. Fatty acid synthesis in ruminant tissue. Biochemical pathways related to fatty acid synthesis in the ruminant mammary gland are depicted. Adapted from Bauman and Davis (1974).
the carbon for the shorter fatty acids (C4-C14) and some 06 fatty acids. The NADPH comes from the catabolism of glucose via the pentose phosphate shunt or the oxidation of isocitrate to CAketogIutaric acid in the Krebs cycle. The malonyl-CoA pathway, which sequentially adds two carbon units to the growing fatty acid chain, is the major synthesis pathway in the ruminant mammary gland and occurs in the cytoplasm. The first step depends on the regulatory enzyme acetyl-CoA carboxylase and involves the addition of carbon from CO2 to acetyl-CoA and hydrolysis of ATP to form malonyl-CoA. The second step is catalyzed by the enzyme fatty acid synthase. This complex enzyme controls growth of the growing fatty acid chain two carbons at a time. In most fatsynthesizing tissues, fatty acid synthase produces mostly palmitic acid. However, the presence of the enzyme thioesterase II in mammary tissue induces the synthesis of more medium-chain fatty acids and fewer long-chain fatty acids. Thus, differences between fatty acid synthesis in ruminants and nonruminants primarily concern the sources of the acetyl-CoA needed in the initial step and the generation of the necessary NADPH.
In nonruminants, the acetyl-CoA for fatty acid synthesis comes from the decarboxylation of pyruvate in the mitochondria but not directly. Since acetyl-CoA does not easily pass across the mitochondrial membrane, citrate derived from the combination of acetyl- CoA and Oxaloacetate diffuses from the mitochondria and enters the cytoplasm. The citrate is broken down by ATP-Citrate lyase to give acetyl-CoA and oxaloac- etate. The acetyI-CoA provides the carbon skeleton for fatty acid synthesis, and the Oxaloacetate enters the malate transhydrogenation cycle, which yields pyruvate and NADPH. The pyruvate subsequently enters the mitochondria.
In ruminants, acetate and BHBA from the blood provide most of the carbon needed for fatty acid synthesis. In mammary cells, for example, glucose is largely spared from being used as a carbon source for fatty acid synthesis because of the near absence of the
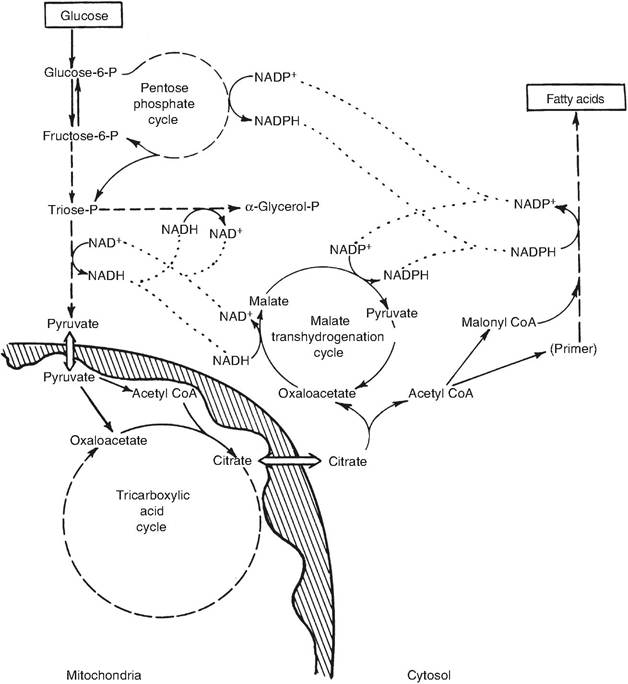
Fig. 3.19. Fatty acid synthesis in nonruminant tissue. Biochemical pathways for fatty acid synthesis in a nonruminant mammary gland are depicted. Adapted from Bauman and Davis (1974).
citrate lyase enzyme in the cytoplasm of the cell. The citrate that does leave the mitochondria is either converted to isocitrate and then to α-ketoglutarate generating NADPH in the process, or it passes into the Golgi and is secreted into milk. Cow's milk is higher in citrate than nonruminants and concentrations of citrate increase with the final stages of lactogenesis. This abrupt increase in citrate concentrations of mammary secretions can be used as a marker for lactogenesis and parturition.
Interconversions and catabolism of proteins
Just as there are multiple paths by which substrates can be supplied for fatty acid synthesis, there are also interconversions that are possible to allow nonessential amino acids to be used for ATP production. However, before amino acids can be used, they must be deaminated; that is, the NH2 has to be removed. This remaining carbon skeleton can then be converted into pyruvate or one of the other intermediates of the Krebs cycle as shown in Figure 3.20. A key to these
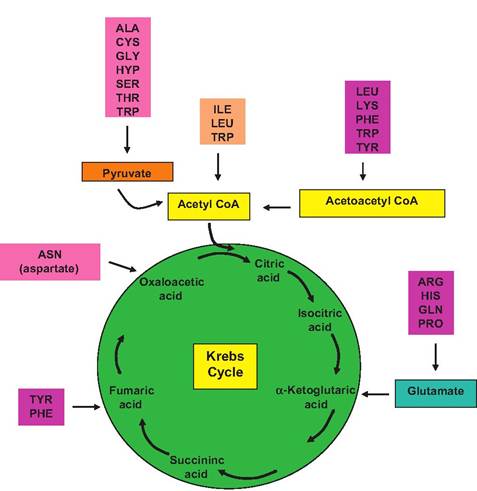
Fig. 3.20. Amino acids and the Krebs cycle. Interconversions of carbon skeletons of common amino acids to intermediates associated with the Krebs cycle are illustrated.
reactions is glutamic acid, a common nonessential amino acid. Many amino acids are modified when their amine group is passed to α-ketoglutaric acid (one of the Krebs cycle intermediates). This produces glutamic acid from the former α-ketoglutaric acid, and the remaining carbon skeleton from the amino acid is converted into a keto acid (there is now an oxygen atom in place of the original amine group). This is a transamination reaction, literally the transfer of an amine group of an amino acid. The liver absorbs the glutamic acid, and the amine group is removed as ammonia (NH3). This is called oxidative deamination. This reproduces the α-ketoglutaric acid, freeing it to be recycled in another round of transamination reactions. Because ammonia is toxic in mammals, it is usually quickly Carboxylated to produce urea and water. The urea diffuses into the bloodstream, and after filtering in the kidney, large quantities of urea are excreted in urine. Thus, urea is derived from the catabolism of amino acids. The capacity of liver glutamic acid to shuttle amine groups from various amino acids for excretion as urea (urea cycle) is critical to animal well-being. Some organisms (fishes) actually excrete free ammonia. These species are called ammonotelic. Other animals (birds and amphibians) excrete uric acid and are referred to as uricotelic species, and those that excrete urea are referred to as ureotelic species. Thus, ammonia is typically removed from the body after being converted into less toxic urea, often in the liver. Blood urea is cleared by urinary excretion. However, in ruminants, substantial urea also is excreted into saliva. Once the urea reaches the rumen, microorganisms can hydrolyze it and use the free NH3for protein synthesis. Much of this microbial protein ultimately passes to the small intestine where it is absorbed. Thus, some of the absorbed proteins contain amine groups that were originally waste products. Figure 3.21 illustrates reactions associated with the catabolism of amine groups from amino acids.
As we have seen, glycolysis and Krebs cycle reactions explain not only how glucose and other carbohydrates are oxidized to supply ATP, but also how both proteins and fats must be Catabolized to enter this pathway for ATP production. Figure 3.22 provides an overview to emphasize the critical role that production of acetyl-CoA has in schemes to produce the energy and provide the building blocks that are needed to meet physiological demands.