Mechanisms of urine formation
Remember, there are three critical processes that contribute to control the volume and composition of urine: (1) filtration of the blood plasma to create ultrafiltrate within the lumen of Bowman's capsule, (2) tubular reabsorption of water and most of the salts of the ultrafiltrate, and (3) tubular secretion, much of which occurs via active transport.
Let's begin by considering factors that control the creation of filtrate.As you might guess, one of the factors that directly impacts the rate of filtration is the blood pressure supplying the glomerulus, just as the rate of water flow through a sprinkler increases as the water faucet is opened. Indeed, one of the symptoms of high blood pressure is more frequent urination. The data plotted in Figure 16.8 demonstrate the dramatic nature of this response.
Factors affecting filtration
Other forces within Bowman's capsule also influence the rate of filtrate formation. Once filtration has started and fluid begins to collect, the fluid-filled space produces hydrostatic pressure against the endothelial cell from outside the capillaries. You can imagine this as the difference between filling an empty water bucket with a hose compared with pushing the hose to the bottom of a barrel that is already filled. The water coming from the hose is counteracted by the force of the water already in the container. In addition, the osmotic properties of the blood and newly created
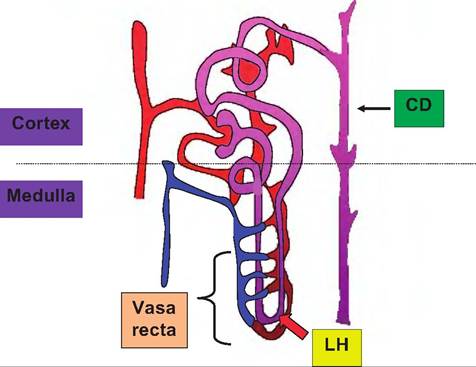
Fig. 16.7. Nephron diagram. This simplified diagram illustrates key aspects of a juxtaglomerular nephron. While in reality the convoluted tubules are more extensive, relative orientation is maintained. Notice that the branches of the efferent arteriole that supplies the region surrounding the convoluted tubules give rise to the network vessels surrounding the loop of Henle (LH) and the vasa recta, which allows blood from the region of the convoluted tubules to flow around the loop of Henle but in the opposite direction of fluid flow within the tubule.
This is important because the countercurrent flow allows a steep osmotic gradient that is created by the action of cells of the loop of Henle to be maintained within the surrounding interstitial space. In practical terms, this means that fluid that then passes up the ascending loop of Henle into the distal convoluted tubule and into the collecting duct transits down the collecting duct (CD) and through this surrounding osmotic gradient. By controlling the degree of permeability of the collecting duct to water, this allows either dilute (water is not recovered from the fluid entering the collecting duct) or concentrated (water follows osmotic forces and leaves the collecting duct lumen) urine to be produced.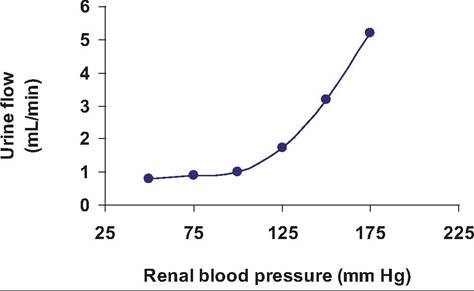
Fig. 16.8. Urine formation and blood pressure. The relationship between renal blood pressure and rate of urine formation is evident.
filtrate impact the rate of water movement across the capillary cells. This means that despite a typical hydrostatic pressure of about 55 mm Hg at the level of the afferent arteriole, the combination of competing forces produces a net filtration force of about +10mmHg. Regardless of this seemingly small pressure differential, because of the very large number of glomeruli in each kidney, that is, typically 2-4 million (depending on the species), this produces an enormous degree of filtration. For a 70-kg primate, the average glomerular filtration rate (GFR) is 125 mL per minute. As a crude estimate, let's assume that blood volume equals 10% of body weight and that the blood is 50% plasma. This results in a blood volume of 7 kg. Let's further estimate that Ikg = IL. This then would yield a blood volume of 7L or 3.5 L of blood plasma. Since the plasma is mostly water, at a normal rate of GFR, it would only take 28 minutes for the entire plasma volume to be filtered. In other words, without mechanisms to minimize urine production, the entire plasma volume would be lost in about 30 minutes.
This staggering calculation highlights not only the degree of filtration but also the significance of the actions of the kidney to recovering the majority of filtered water and important nutrients.In addition to the hydrostatic pressure within the glomerulus, these capillaries are also are structurally designed to maximize bulk fluid flow. Specifically, they are fenestrated. Compared with capillaries in other regions of the body, the endothelial cells contain numerous large pores so that permeability is about 100 times greater than for other capillary beds. Despite the benefit of enhanced fluid filtration, is it also important that large macromolecules within the blood are not filtered. Thus, the basement membrane surrounding the endothelial cells contains collagen and numerous negatively charged glycoproteins. This acts to repel albumin and other serum proteins. There are also specialized cells called podocytes that cover the outer surface of the endothelial cells. The podocytes send out numerous pseudopodia that create processes called pedicels that interdigitate to create filtration slits. Filtrate driven by hydrostatic pressure passes through the pores of the endothelial cells, through the basement membrane, and then through these filtration slits. These three layers effectively act as a kind of molecular sieve, so that small molecules and water readily pass into the lumen of Bowman's capsule but essentially all proteins are excluded from filtrate based on charge and/or molecular size. There is bulk flow of water through the glomerulus so that small dissolved ions, sugars, amino acids, urea, and most other small molecules enter the filtrate. Table 16.1 illustrates the relationship between molecular weight and transfer of several common blood components into kidney filtrate.
Proximal convoluted tubule
The composition of the filtrate is similar to that of blood plasma with the exception of the protein content, but the composition of urine is very different; thus, it is apparent that both the volume and composition of the filtrate are markedly altered as it passes through the segments of the nephron.
Essentially, the kidneys filter blood plasma then reabsorb needed materials from the ultrafiltrate. In fact, nearly all of the water and the majority of critical nutrients are recovered before the fluid reaches the end of the proximal convoluted tubules. The activity of the cells of the proximal convoluted tubule is reflected by the structure of the cells. Specifically, these cuboidal epithelial cells have plentiful mitochondria and rough endoplasmic reticulum (RER) as well as numerous apical microvilli. These attributes provide for synthesis of abundant amounts of ATP, much of which is needed to power active transport mechanisms to recover important nutrients that should not appear in urine. In short, ATP is expended either directly or indirectly in transferring ions (and other molecules) across the epithelium against a concentration gradient. Ionic gradients that are developed depend on the activity of three classes of ATPases or protein pumps. ATPases were discussed generally in Chapter 3. In reality, these are quite complex components of cell membranes in many organisms. They are composed of membrane domains as well as catalytic and regulatory subunits located on the cytoplasmic face of the membrane. For example, protons (H+) from electron transport in the mitochondria pass through the F-ATPase system that powers ATP synthesis within the internal membranes of theTable 16.1. Relationship between molecular weight and properties of selected substances and urinary filtration.
| Substance | Molecular Weight | Radius (nm) | Blood/Filtrate Ratio | |||||||||||||||||||||||||||||||||||||||||||||||||||||||
| Water | 18 | 0.11 | 1.0 | |||||||||||||||||||||||||||||||||||||||||||||||||||||||
| Glucose | 180 | 0.36 | 1.0 | |||||||||||||||||||||||||||||||||||||||||||||||||||||||
| Sucrose | 342 | 0.44 | 1.0 | |||||||||||||||||||||||||||||||||||||||||||||||||||||||
| Insulin | 5500 | 1.48 | 0.98 | |||||||||||||||||||||||||||||||||||||||||||||||||||||||
| Ova albumin | 43,500 | 2.85 | 0.22 | |||||||||||||||||||||||||||||||||||||||||||||||||||||||
| Hemoglobin | 68,000 | 3.25 | 0.03 | |||||||||||||||||||||||||||||||||||||||||||||||||||||||
| Serum albumin | 69,000 | 3.55 | Na+/ K+ ATPase pumps either directly or indirectly support the movement of many substances. For example, if the apical membrane of the tubular cells contains Na+∕glucose or Na+∕2CF∕K+ symporters,
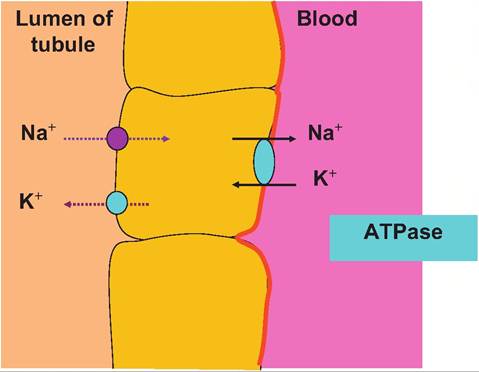
Fig. 16.9. Distal tubule ion transport. In the distal convoluted tubule and collecting duct of the nephron, the cells secrete K+ into the filtrate. Na+∕K+ ATPase pumps in the basolateral membrane actively transport K+ into the cell where it then passes down its concentration gradient and exits from the apical end of the cell into the lumen. This allows the recovery of Na+essentially in exchange for elimination of K+. then the activity of these pumps can control the uptake of glucose, K+, or Cl. This is just what selectively happens within specific sections of the nephron. If the Na+∕2CF∕K+ pump is located in the basolateral membrane of the cell, its activity can drive the uptake of Ck from the extracellular fluid (to be secreted into the filtrate). Specifically, the presence of chloride channels or pores in the apical membrane of the cell allows the passage of higher concentrations of chloride out of the cell and into the filtrate.Figure 16.10 illustrates the histological appearance of renal corpuscle as well as several cross-sectioned profiles of parts of a nephron. At first it may seem confusing. The larger rounded structures are the renal corpuscles, and the various tubules are sections through proximal or distal convoluted tubules, perhaps an ascending or descending loop of Henle or collecting ducts. Other tubelike structures include the network of peritubular capillaries. Remember the name of the beginning and ending section of the nephron: convoluted tubule. Because of its highly coiled, curving structure, a given histological section from the kidney might well exhibit many profiles of the same tubular structure as it is cut at various places. However, there are distinct structural features that allow the identification of proximal versus convoluted tubules, or differences between loops of Henle and collecting ducts, for that matter. One simple feature that allows a quick orientation is the presence of renal corpuscles. If these structures are present, then the tissue section was taken from either within the cortex or the tissue included the boundary between the cortex and medulla. The
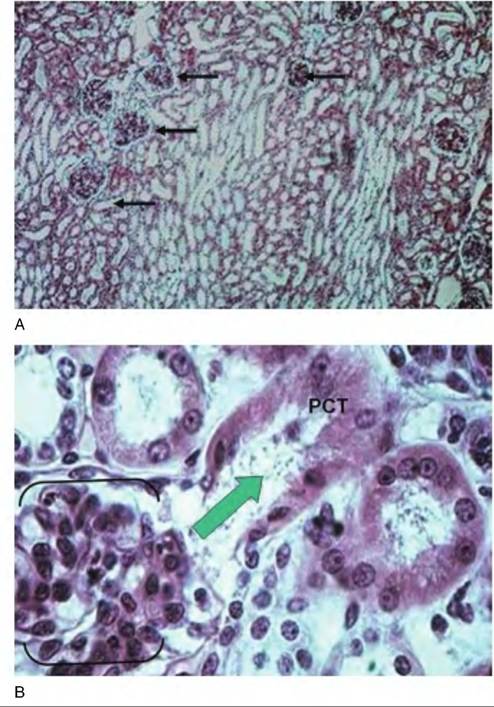
Fig. 16.10. Nephron histology. Panel A gives a low-power survey image of the tissue from the cortex of the kidney. The larger rounded structures (arrows) are the renal corpuscles. The other abundant circular profiles are cross-sectioned areas of various segments of nephrons. Most of the profiles would be either proximal or distal convoluted tubules. Panel B shows some of the detail of a renal corpuscle (outlined by the brackets). Ultrafiltrate flows from this structure into the proximal convoluted tubule (PCT). In this case, by chance, a portion of the tubule that drains this renal corpuscle has been sectioned. The large arrow indicates the direction of flow. appearance of long parallel arrays of simple tubes is a major indication that the tissue section was prepared from a sample collected deeper into the renal medulla, perhaps near the apex of a renal pyramid. These tubules likely represent the walls of the ascending or descending loops of Henle of the juxtamedullary nephrons, peritubular capillaries, or numerous collecting ducts. As filtrate enters the PCT, forces begin the recovery of important nutrients, ions, and water. Because of these activities, the structure of the cells of PCT and distal convoluted tubule (DCT) are distinct. As shown in Figure 16.11, epithelial cells of both PCT and DCT are cuboidal, but the cells of the PCT typically have abundant microvilli and mitochondria. In paraffin
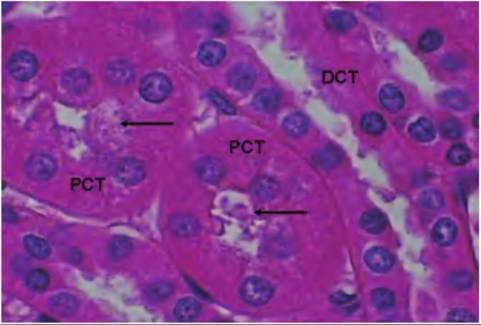
Fig. 16.11. Proximal and distal tubules. This image is taken from the renal cortex and shows profiles of proximal (PCT) and distal convoluted tubules (DCT). In both cases the cells are cuboidal, but cells of the PCT are larger and have evidence of stained material along the apical cell surface, evidence of abundant microvilli (arrows). Table 16.3. Summary of functions of nephron regions.
Fig. 16.12. Flow of selected materials. This diagram illustrates the dramatic rate of removal of amino acids and glucose from the ultrafiltrate formed in the glomerulus. By the time fluid enters the loop of Henle, essentially all of the amino acids and glucose have been recovered in normal circumstances. When animals are given inulin or Itippuric acid, the rate of appearance of these substances can be used to monitor kidney health. For example, for inulin that enters the filtrate remains, it is neither reabsorbed nor is any transported from the peritubular blood (no secretion). This gives a measure of the glomerular filtration rate or GFR. Hippuric acid, on the other hand, is not recovered, but in addition, all of it in the blood that enters the glomerulus is transported into the filtrate (100% secretion). Thus, evaluation of Itippuric acid concentrations provides a measure of plasma flow rate to the kidney. Table 16.4. Rate of fluid flow in regions of the nephron.
Under normal circumstances, nearly all of the glucose and amino acids are recovered from the filtrate before it reaches the loop of Henle. The significance of measuring of inulin and hippuric acid to understanding kidney function is also indicated. Table 16.3 summarizes major functions associated with each of the segments of the nephron. In addition to the recovery of dissolved substances, the rate of fluid flow also is dramatically reduced as each of the progressive segments of the nephron is traversed. As indicated earlier, the capacity to regulate the volume of urine produced is critical. As shown in Table 16.4, despite an average rate of filtrate formation of ~125mL∕min in a 70-kg primate, urine production is typically only about 1 mL per minute. Just how this regulation takes place will be discussed in subsequent sections. sections of fixed kidney tissue the Iumenal spaces of the PCT sometimes appear as if the apical ends of the cells are painted. This color and thickness is an indication of stain accumulation on the proteins that coat the microvilli. The remarkable capacity of the nephron to recover important nutrients is illustrated in Figure 16.12. Countercurrent mechanisms and medullary osmotic gradient The mammalian kidney has a remarkable ability to regulate the concentration of urine to maintain the water content of the body so that the osmolarity of body fluids remains within very narrow boundaries. Box 16.1 Alcohol and urination While not an issue for our animals, it is often observed that drinking beverages containing alcohol seems to induce more frequent urination. Certainly, consumption of additional liquids has an impact on kidney function, but it also turns out that ethanol inhibits the secretion of antidiuretic hormone or ADH. Can you use this knowledge to figure a mechanism to explain why this might occur? For most animals there is a very real danger of desiccation so the kidney is designed to reabsorb nearly all of the water that is filtered. However, if necessary, the kidney is also capable of responding to produce very hypotonic urine to eliminate water. For example, consider that a 10-kg dog likely produces more than 50 L of glomerular filtrate per day but only 0.2-0.25 L of urine. If the dog is water deprived it can produce a very low volume of urine whose osmolarity is 10 times as great as blood plasma or, with water loading, urine with an osmolarity of only 100mOsm∕L. How does the kidney manage these remarkable shifts (Box 16.1)? The answer to this question is reflected in the complex but elegant structure of the nephron, variable function of cells within different nephron segments, and a unique arrangement of blood vessels within the tissue surrounding the nephrons. Three key elements are involved in determining if concentrated or dilute urine will be produced. First, there is the presence of an osmotic gradient that is generated and maintained in the tissue surrounding the juxtaglomerular nephrons whose loops of Henle dip from the cortex of the kidney, deep into the medulla. Second, the fluid of the tubule becomes progressively dilute as it passes through the loop of Henle into the distal convoluted tubule. Third, the permeability of the collecting duct cells to water can be directly regulated by the action of antidiuretic hormone (ADH). As the dilute filtrate fluid passes from the distal convoluted into the collecting ducts, it again traverses from the region of the cortex down through the renal medullary tissue to the apex of the renal pyramids for release. As illustrated in Figure 16.13, the osmolarity of the tissue fluid becomes progressively greater, ~1200mOsm∕L, near the lower regions of the medulla, so that given the opportunity to respond to the osmotic pressure, water will pass across the cells of the collecting ducts into the interstitial fluid and be recovered in surrounding capillaries. However, this does not occur automatically. In the absence of sufficient secretion of ADH, the water is retained within the tubular fluid and a more copious and dilute urine is produced. Water recovery or excretion within this region of the nephron is sometimes referred to as facultative reabsorption. That is,
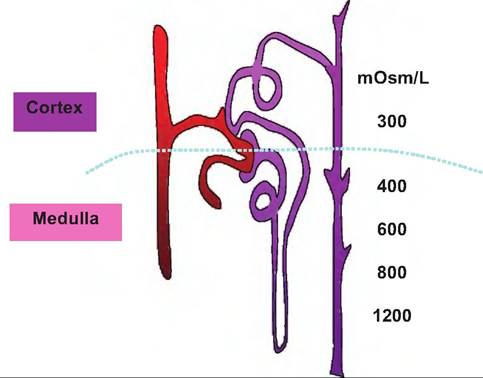
Fig. 16.13. Kidney osmotic gradient. The difference between the osmolarity of interstitial fluid in the cortex compared with the medulla is dramatic. The development and maintenance of this gradient is important as it allows the production of either dilute or concentrated urine. water recovery does not occur unless ADH is secreted to facilitate this process. This is contrasted with reabsorption of water that happens within the PCT. In these areas of the nephron the cells are always permeable to water. This means, for example, that when sodium is reabsorbed from the tubular fluid the osmotic difference that is created allows water to follow. Thus, water reabsorption in these regions is referred to as obligatory transport. Since the tubule is permeable to water the removal of sodium or other solutes create an osmotic drive that water is "obligated" to follow. Figure 16.14 illustrates factors that create and help maintain the interstitial osmotic gradient. The vasa recta, the network of capillaries that follow the course of the loop of Henle, are also essential in maintenance of the osmotic gradient. This is because this arrangement acts as a countercurrent exchange mechanism to minimize alterations in the concentrations of solutes within the interstitial fluid. Essentially, this allows the recycling of salt. Without this arrangement, if ordinary vessels paralleled the loop of Henle the medullary gradient would quickly be dissipated. Specifically, as large amounts of Na+ were absorbed, water would follow and the gradient would essentially be flushed away. In contrast, the vasa recta function to minimize disruption. First, these capillaries get only about 10% of the blood flow. This acts to make blood flow relatively slow in comparison with other capillaries. In addition, throughout the course of the vessels, the cells are freely permeable to both water and sodium. Consequently, the blood makes passive exchanges with the tubular fluid to maintain equilibrium with the surrounding interstitial fluid. For example, as the blood flows toward the apex of the
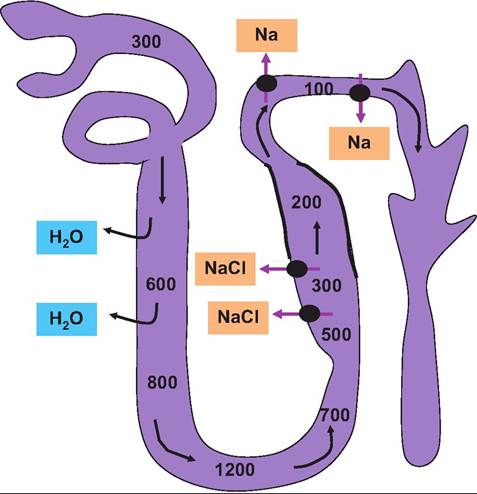
Fig. 16.14. Role of loop of Henle. The thin limbs of the loops of Henle and the DCT generate and maintain the osmotic gradient between the cortex and medulla. The osmolarity of the tubule fluid leaving the PCT is about 300mOsm∕L. It becomes progressively more concentrated so that osmolarity increases as water leaves in response the tonicity of the surrounding fluids. This is because the descending limb is permeable to water but not sodium. After the hairpin turn, the fluid becomes progressively more dilute because the cells are impermeable to water but not sodium. The differences in permeability of the descending and ascending limbs and the countercurrent flow act to create and maintain the interstitial tissue osmotic gradient. In the upper regions of the ascending loop (indicated by the thick lines) the cells are impermeable to water, but active transport of sodium (chlorine follows via electrochemical attraction) indicated by the black circles and arrows occurs. This creates dilute tubular fluid (~100mOsm∕L) as the fluid enters the collecting ducts. As indicated, the permeability of the collecting ducts to water is controlled by secretion of ADH. Control of permeability allows either diluted (low ADH secretion) or concentrated (high ADH secretion) urine to be created as needed to maintain homeostasis. renal pyramid, it loses water and gains salt because of the increasing osmolarity. In other words, the blood becomes hypertonic. However, after the vessels bend in the region of the hairpin loop, the process is reversed. As the blood leaves the medulla and enters the cortex the osmolarity is essentially the same as when it entered the descending side of the system. These countercurrent exchanges protect the osmotic gradient that is created by the selective actions of the descending and ascending limbs of the loop of Henle. Figure 16.15 illustrates the idea of a countercurrent system generally and of the vasa recta specifically (Box 16.2). While the structure-function relationships among parts of the nephron explain much of the action of the kidney with respect to the capacity of the kidney to control production of either dilute or concentrated
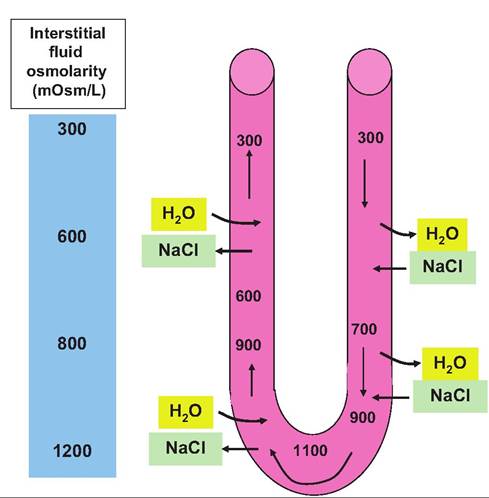
Fig. 16.15. Countercurrent exchange in the vasa recta. The vessels of the vasa recta follow the curved course of the loop of Henle. Since the cells are freely permeable to both sodium and water, osmolarity of the blood (values within the vessel) can reach equilibrium with the surrounding interstitial fluid during transit. However, the blood has essentially the same osmolarity when it enters and leaves the system. These transient shifts allow the osmotic gradient in the surrounding interstitial fluid to be maintained. Box 16.2 Kangaroo rats What are some adaptations that animals in very, very harsh climates have completed to avoid dehydration or other osmotic disasters? Desert-dwelling kangaroo rats rarely drink. They get about 90% of daily water needs from tissue metabolism and 10% from food (seeds and vegetation). There are both behavioral and physiological adaptations. They stay in cool burrows in the day. They have no sweat glands, but most importantly, they have very long loops of Henle. So they are able to concentrate urine to an extreme degree. For example, they can concentrate urea to 3500 mmol ∕L, compared with 400mmol/L in humans. Overall urine produced is 20 times more concentrated than body fluids. Feces are also extremely dry. urine, what are the factors that determine which type of urine should be produced? To understand this regulation we need to appreciate the fact that the kidney, specifically specialized cells within the glomerulus, afferent arteriole, and distal convoluted tubule, are important in the long-term chronic control of blood pressure. A second key element is the fact that maintenance of blood and interstitial fluid osmolarity, while sensed by cells of the hypothalamus, requires changes in kidney function to effect homeostatic control of body fluid osmolarity. We begin by considering the role of sodium chloride. More than 90% of the osmotic activity of extracellular fluid is directly related to concentrations of NaCl, especially Na. In most situations, reabsorption or movement of salt across an epithelial or cell membrane also results in the movement of water because of osmosis. Thus, the amount of salt in the body is a very important determinant of extracellular fluid volume and consequently blood volume and blood pressure. In short, all things being equal, reabsorption of more sodium from the glomerular filtrate of the kidney leads to greater reabsorption of water. Thus, there is a direct relationship between kidney function and control of blood pressure via control of extracellular fluid volume. Certainly, something as important as control of blood pressure (volume) and osmolarity cannot be left to chance. The first component involved is the renin-angiotensin system. Figure 16.6 shows cells that make up the juxtaglomerular apparatus (JGA). The JGA is a combination of
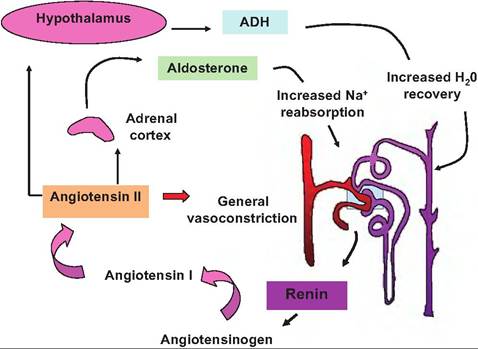
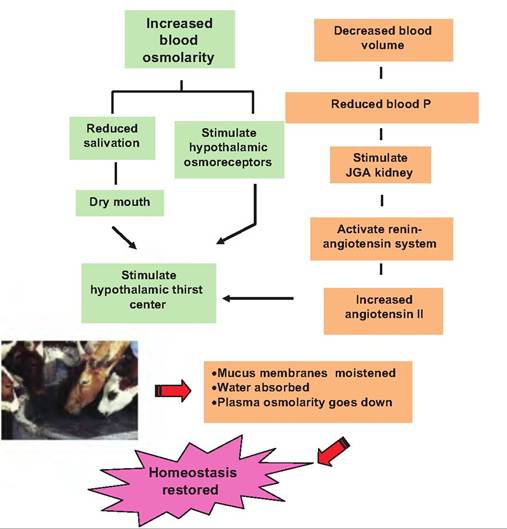
Fig. 16.16. Renin-angiotensin system. The secretory cells of the juxtaglomerular apparatus (JGA) indicated in the boxed area release renin in response to low blood pressure in the afferent arteriole and/or low sodium in distal CT. In a cascade of reactions, renin first promotes the cleavage of the serum protein angiotensinogen (synthesized in the liver). This action produces angiotensin I, which is modified by angiotensinogen-converting enzyme (ACE) by removal of two additional amino acids to form the eight amino acid peptide, angiotensin II, as the blood passes through the lungs. Angiotensin Il has two major actions. First, it stimulates a general vasoconstriction, which increases blood pressure rather quickly, and second, it promotes secretion of aldosterone from the adrenal cortex. As described previously, aldosterone promotes increased reabsorption of sodium, which leads to increased water recovery, increased extracellular fluid volume, and, ultimately, increased blood volume and therefore increased blood pressure. Finally, increased angiotensin Il also increases synthesis of antidiuretic hormone in the hypothalamus. ADH increases water permeability of the collecting ducts to also increase blood volume and pressure. the cells of the wall of the afferent arteriole and a segment of the distal convoluted tubule. Secretory cells within the JGA respond to decreases in blood pressure and/or very low concentrations of Na within the fluid of the distal CT by secreting the enzyme renin. Renin acts to restore blood pressure in two ways. Most rapidly, as outlined in Figure 16.16, increased blood renin causes an increase in the blood concentration of angiotensin II. This agent has two actions to help restore blood pressure. First, it causes a generalized vasoconstriction of capillary sphincters throughout the body. This acts to reduce blood flow through many capillary beds, increases vessel resistance, and thereby increases venous return to the heart. The increased volume produces increased cardiac output and therefore an increase in blood pressure. In addition, angiotensin II also promotes the secretion of the steroid hormone aldosterone from the adrenal cortex. Aldosterone acts to promote increased reabsorption of Na from the distal CT. As indicated previously, enhanced recovery of Na within this region of the nephron leads to simultaneous reabsorption of water. The reabsorbed water enters the capillaries and consequently the vascular system, which also increases blood pressure. Furthermore, the angiotensin II also promotes the secretion of ADH. This is called the renin-angiotensin system. The mechanism aldosterone uses to increase sodium reabsorption in the distal CT is not fully understood. Like other steroid hormones, aldosterone diffuses across the cells of its target cells and binds to receptors in the cytoplasm. These activated receptor-hormone complexes migrate to the nucleus to ultimately produce transcription of specific genes. These newly minted proteins are responsible for the effects of aldosterone. However, three detailed mechanisms have been proposed to explain the increased sodium reabsorption. First, the sodium pump hypothesis suggests that the activity of the Na+/ K+ pumps in the basolateral membrane is simply stimulated. A second, metabolic hypothesis suggests that aldosterone increases production of ATP, perhaps due to enhanced fatty acid oxidation, and that making more ATP available simply powers the Na+/ K+ membrane pumps more effectively. A third hypothesis is that aldosterone increases the synthesis of sodium channel proteins that are deposited in the apical membranes of the cells. Furthermore, animals are stimulated by thirst to increase water intake as illustrated by Figure 16.17. There are also elements to "adjust" the activity of the renin-angiotensin system to prevent extremes. For example, atrial natriuretic peptide (ANP) is released by cells in the atrium of the heart in response to increased venous blood pressure. ANP acts to increase urine production and sodium excretion by inhibiting
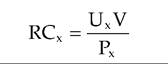
Fig. 16.17. Thirst reactions. In addition to the kidney control of urine production, drinking must also be regulated. Multiple elements (dry mouth, reduced blood osmolarity, and increased blood angiotensin II) act via osmoreceptors in the hypothalamus to elicit the sensation of thirst that leads to drinking. Ingestion of water moistens mucus membranes and absorption increases osmolarity of fluid bathing osmolarity-sensitive cells in the hypothalamus, reducing the sensation of thirst and along with kidney action restoring homeostasis. the release of ADH and renin and thus secretion of aldosterone by the adrenal gland. Renal clearance Data illustrated in Figure 16.12 show absorption and secretion patterns for some selected substances as these materials pass through regions of the nephrons. Measuring changes in the concentrations of two of these substances, inulin and hippuric acid (specifically aminohippuric acid or para-aminohippuric acid [PAH]), are very valuable tools to evaluate kidney function. To determine effectively if plasma is cleared or "cleaned" of unwanted waste products, two variables related to kidney action must be measured. First, we need a measure of the rate of blood or plasma flow to the kidneys, and second, we need to determine how much of the blood plasma is filtered. You might recall from our description of blood flow to the renal glomerulus that as blood enters via the afferent arteriole, some fluid is lost to create the ultrafiltrate that enters the lumen of the nephrons, and the remainder exits via the efferent arteriole. Inulin, a sugar that is isolated from the tubers of dahlias, is filtered from the blood, but it is neither reabsorbed from the filtrate nor is any additional inulin secreted into the lumen of the nephrons. For this reason, measuring the concentrations of inulin in samples from the renal vein and artery following injection into systemic circulation gives a measure of the volume of blood plasma that is filtered by the kidney. This is called the GFR. This determination of the GFR is based on the idea of clearance, which is the rate at which the plasma is cleared or cleaned of a given substance. The clearance rate (RC) is determined by the rate of elimination divided by the plasma concentration of the substance in question, as follows:
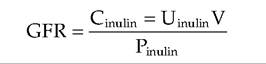
where RCx is the volume of plasma cleared of substance ? per unit time, Ux is the urine concentration of substance X, V is the volume of urine collected divided by the time period of the collection, and Px is the plasma concentration of X. GFR is considered the best single parameter for assessing overall renal function because its value is directly related to the functional mass of kidney tissue. In veterinary practice, measurement of blood levels of urea nitrogen (BUN) and creatine concentration are often used as screening tools to detect renal dysfunction. Unfortunately, values typically rise markedly only when 75% or more of the nephrons no longer function. The total clearance of a particular substance is the sum of the rates of filtration and secretion with the rates of reabsorption subtracted. To determine the filtration rate accurately, the effects of secretion and reabsorption have to be taken into account. In the case of inulin, since it is freely filtered but is neither secreted nor reabsorbed and is not produced in animals, it is ideal for calculating GFR. Indeed, the equation for calculation of inulin clearance is in effect an equation for calculation of GFR as shown in the following equation, where GFR is in milliliters per minute, Ctauιta is the rate of clearance of inulin from the plasma in milliliters per minute, Utauιta is the inulin concentration in a urine sample collected over a period of time T in minutes; V is the volume of urine collected over time T; and Ptau]ta is the average plasma inulin concentration during time T.
Again, since infused inulin (typically a standard dose to achieve an initial concentration of ~lmg∕mL of plasma or 3000 mg / m2 body surface area) is eliminated only in the urine, its clearance rate value is equal
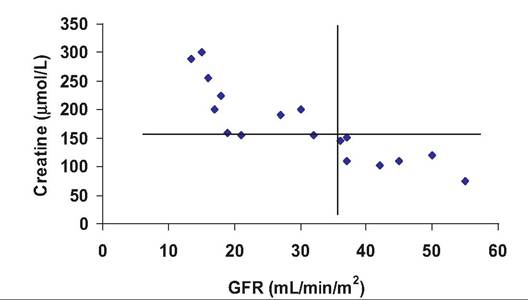
Fig. 16.18. Relationship between GRF and serum creatine. The vertical line indicates the lower value for GFR that is still considered normal. The horizontal line indicates a normal upper limit for serum creatine. Animals in the upper left quadrant of the graph have higher than normal serum creatine concentrations and correspondingly reduced kidney function as evidenced from the reduced GFR (adapted from Haller et al., 2003). to the GFR. Measured values for inulin in humans are U = 125mg∕mL, V = ImL/min, and P = lmg∕mL. Thus, the calculated value for RC for inulin = (125 ? 1)/ 1 = 125mL∕min. This means that in 1 minute, the kidneys have removed or cleared the amount of inulin that would have been in 125 mL of blood plasma. Typical values for healthy cats, for example, average about 2.7mL∕min∕kg or ~12mL∕min for a typical adult cat. Figure 16.18 illustrates the relationship between BUN and GFR in a population of cats. In this case, GFR was estimated from the clearance of injected inulin. It was also found that the serum inulin value after a single time period (180 minutes) corresponded well with more extensive blood sampling. In practical terms this would minimize stress associated with multiple sampling. Since some of the animals in this trial were suspected of being in early stages of renal disease, it is also apparent that several of the cats with elevated serum creatine levels have correspondingly reduced GRF values. This supports the predictions of impaired kidney function. Although the standard method to calculate GFR is by measuring the clearance rate of inulin from the blood, GFR can be estimated by measuring other endogenous substances. In clinical veterinary situations, this can be done by measuring the clearance of creatine. Creatine is a by-product of muscle metabolism that is handled by the kidney (at least in dogs) much like inulin; that is, it is freely filtered, not reabsorbed, and not secreted into the tubular lumen. This, however, may not be true in all species. For example, in some animals, about 10% of the creatine in urine occurs because of secretion. In practical terms, the usual procedure is to collect the urine that is produced over 24 hours (either catheterization or collection in a metabolic cage). The volume produced is recorded, and the creatine concentration is measured. The concentration of creatine in blood collected at the start and end of the collection period is typically measured and averaged to provide a measure of plasma concentration. These values are used in the clearance equation to give an estimate of GFR. When many different animals are evaluated, it is better to express the GFR on a body weight or body surface basis (milliliters per minute per kilogram or milliliters per minute per square meter) to account for the large variation between species. Note the example given in Figure 16.18. Para-aminohippuric acid is useful because it is filtered as it passes into the glomerulus. Moreover, the remaining portion that passes out of the efferent arteriole is secreted into the tubular fluid. Thus, all of the material that is in the blood plasma that enters the kidney appears in the filtrate and ends up in urine. This property allows a calculation of plasma flow to the kidney. This can be very useful to evaluate kidney as well as cardiovascular health. If less of a substance appears in the urine than was initially produced at the time of filtration, then some reabsorption of the substance must have occurred in the tubule. In a human, the GFR averages 125 mL per min (mostly water), but urine production is only about 1 mL per min. Clearly, most of the water is recovered. For important nutrients (Fig. 16.12), reabsorption is essentially complete in most circumstances. For example, consider glucose; unless blood concentrations are abnormally elevated, all of the filtered glucose is recovered so that the clearance is zero. There is, however, a maximum rate at which glucose can be recovered from the filtrate. In humans, for example, the transport maximum (Tmax) is about 320mg∕min. As long as plasma glucose remains below about 1.8mg∕mL (180mg∕dL), all of the glucose appearing in the filtrate is recovered. At about 300mg∕dL of plasma, the transport mechanism becomes completely saturated so that glucose is lost in the urine. Exact transport values likely differ between species, but the idea remains the same. Specifically, elevated blood glucose occurs with diabetes so that appearance of glucose in the urine is an initial indication of diabetes in both humans and other animals.
More medical literature on Medic.Studio
More on the topic Mechanisms of urine formation:
-
Infectious diseases -
Internal diseases -
Obstetrics and Gynaecology -
Pediatrics -
Veterinary medicine -
-
Conflictology -
Ecology -
Economy -
Finance -
History -
Law -
Medicine -
Philosophy -
Religious studies -
| |||||||||||||||||||||||||||||||||||||||||||||||||||||||