Competitiveness with (out) sacrificing environment: Estimating economic cost of groundwater pollution
E. Wardhani & S. Nugraheni
Parahyangan Catholic University, Bandung, Indonesia
ABSTRACT: Indonesia is one of the largest textile producers because of its high competitiveness.
Most of the textile and apparel industries are located in West Java province. There are cases where the Indonesian textile industry causes pollution of ground water. This study aims to estimate the economic costs of groundwater pollution in two hamlets in Lagadar village, Bandung Regency, West Java province, which is caused by wastewater from the textile industry. Environmental assessment methods using replacement and prevention costs were carried out with primary data collected from the field with a survey of 84 households. The results show that the average expenditure of households to buy clean water (bottled water and/or tap water), build public wells, and operate public water treatment, is Rp 67,048 per month; or IDR 804,576 per year. Therefore, the total economic cost of pollution of groundwater for two hamlets (of 546 households), is IDR 36,608,208 per month; or IDR 439,298,496 per year.1 INTRODUCTION
Indonesia is one of the largest textile producing countries in the world. In 2017, the value of Indonesia’s exports from the textile industry reached $ 12.58 billion; it is the fourth largest export commodity after the food industry, chemical industry, and basic Meta industry (Ministry of Industry of the Republic of Indonesia, n.d.). Some reports state that Indonesian textiles and clothing have high competitiveness. Quoting the UN Commtrade report, the Coordinating Ministry for Economic Affairs of the Republic of Indonesia (2018) noted that Indonesian textile products’ Revealed Comparative Advantage (RCA) was 55, the highest among other Indonesian export commodities.
Most of Indonesia’s textile industries are located in West Java, especially in Bandung and its surrounding areas.
In 2013, there were 1,658 factories (of 2,886), or 57 percent of all textile and apparel factories, located in West Java province (Badan Pusat Statistik Jawa Barat 2014).In some cases, high competitiveness of Indonesia’s textile products has to sacrifice environment. Greenpeace’s report (2013) states that textile factories are the main cause of water pollution. Waste water from textile factories is disposed to rivers without being processed, and flows along the rivers, or seeps into the soil, and causes groundwater pollution around the factories’ areas. Water is also an important input in textile production process, and the factories often use groundwater to fulfill their water needs. They drill deep wells that deplete groundwater quantity in the areas around the factories.
Lagadar Village, Bandung District, is one of the areas where several textile factories are located. Research by Suhari (2012) concluded that Lagadar Village is one of the areas in Bandung District that experienced shallow groundwater contamination. This is confirmed by Greenpeace’s report (2013) and Lagadar’s local people who stated that, before the textile industries built their factories in Lagadar’s neighborhood, local people of the village used groundwater as their clean water resources. Once the textile factories established and operated in Lagadar village, the majority of the local people rely their clean water need from sources other than groundwater, such as: ‘bottled’ water (i.e. clean water in gallons that is sold based on refill system), tap water, and communal artesian wells that were built by the local community.
This study aims to estimate the economic costs borne by local people of Lagadar due to groundwater pollution in their areas. The study covered two hamlets (sub-villages), namely RW 04 and RW 17 of Lagadar village. Those two hamlets were chosen as the object of this research because the distance between the two hamlets and the textile factory complex is quite close, about 1.5 to 4 kilometers.
Laga- dar village is about 318.90 ha, with number of population is 22,567, and 5,548 households. There are 546 households living in RW 04 and RW 17 of the village.2 EXTERNALITY AND ECONOMIC COST OF POLLUTION
Theoretically, pollution in the production process is the impact of externalities without compensation
from one-child actions on third party welfare (Mankiw 2009). Externality is a type of market failure that can be negative or positive, depending on whether the impact by the stander is detrimental or profitable.
Research by Suhari (2012) and Greenpeace (2013) and statements by local residents of Lagadar state that the main cause of Lagadar groundwater pollution is textile industry wastewater. Suppose the statements are scientifically proven, cases of groundwater pollution in RW 04 and RW 17 Lagadar Village are negative externalities from textile factories located adjacent to the village. Externalities ignore Lagadar residents because they have to provide additional budgets to buy clean water. Lagadar villagers must bear the costs of groundwater pollution caused by the textile industry. As long as the costs are not included in the production costs of the textile industry, externalities occur.
Externalities will make the production costs of textile factories ‘too low’ because they do not take into account the costs of externalities (Tietenberg & Lewis 2012). Graphically, this is illustrated in Figure 1. Suppose marginal costs represent the costs of producing textile factories, the MPC curve is the cost of production without including negative externality costs. When we take into account the cost of pollution, this gives a factory ‘real’ production cost symbolized by the MSC curve. We can see that the externalities produce ‘too much’ out-put (Q1 compared to Q *), and the price is ‘too low’ (P1 compared to P *).
In Economics, externalities are overcome by internalization. One method of internalization is to provide compensation to the affected parties.
The amount of payment must be more or less the same as the expenditure of the affected parties to avoid the risks caused by externalities. Industrial pollutants usually contain hazardous chemical substances that are very dangerous for humans, therefore, cause high economic, environmental and social costs (Fatma 2017). When there is groundwater pollution, the affected parties will do anything to avoid costs. In the case of local residents of Lagadar, they replaced ground water with other clean water sources. They also did water treatment and made artesian wells. All efforts have financial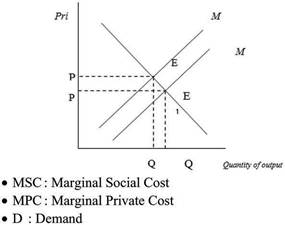
Figure 1. Negative externalities and the cost of production.
consequences. This is the economic cost of groundwater pollution.
Estimating economic costs from pollution not only for the purpose of providing compensation, but these costs can be used as information to develop a green growth strategy. Another use of the estimation results is to calculate the “net economic contribution” of the industrial sector.
3 RESEARCH METHOD
This paper aims to estimate economic cost of groundwater pollution in two hamlets (i.e. RW 04 and RW 17) of Lagadar village. The importance of this study is to raise villagers’ awareness by proving that water pollution generates economic loss which showed in monetary values. The object of this study are RW 04 and RW 17 as they harmed the most compared to other sub district in that village (Suhari 2012).
There are studies on economic cost of water pollution and five of them are summarized in Table 1.
The estimation method used in this study is replacement and prevention costs. Data obtained from the survey at household level. Total number of household in RW 04 and RW 17 is 546 households. Using the following Slovin’s formula, the sample size is 84 households.

n : number of sample N : total population E : limit of error tolerance
Each household is given a questionnaire to gather information about two types of costs associated with additional costs (referring to replacement and prevention costs) to provide clean water.
Replacement costs refer to costs incurred by households to buy clean water (i.e. bottled water and tap water), instead of using ground water. Meanwhile, prevention costs consist of costs for using communal water treatment and artesian wells. Data on costs per household are collected and then the average cost per household is calculated using the following formula: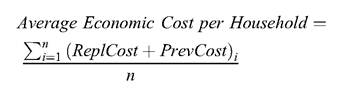
ReplCost: Replacement Cost of Respondent (household) i (Rp.).
PrevCost: Prevention Cost of Respondent (household) i (Rp.).
n: Number of Respondents.
i: Respondent (household) to-i (1,2,3,... n).
Table 1. Previous studies on estimation of economic costs of water pollution.
| No. | Researcher(s) & Year of Publication | Research Method & Object | Research Result |
| 1. | Laughland et al. (1993) | Averting costs due to groundwater contamination in Milesburg, Pennsylvania, US. | $33.47 per month per household |
| 2. | Lewandowski et al. (2008) | Well remediation cost, well maintenance cost, and cost for building new well because of groundwater pollution in Minnesota, US. | Remediation cost: US$800; Maintenance cost: $100; Cost to build new well: US$7.200; (costs per household/year) |
| 3. | Ahyar & Perkasa (2011) | Prevention costs due to sea water intrusion into groundwater, in Kapuk Muara Village, Jakarta, Indonesia. | Rp. 9.9 million per year (total cost at village level) |
| 4. | Rinita, Prabang & Kusno (2012) | Health costs due to mercury contamination from gold mining activities in Kalirejo vill., KulonProgo District, Indonesia | Replacement Cost: Rp 561.100/year. Remediation cost: Rp 16.706.400/year |
| 5. | Greenpeace (2016) | Total economic value of waste water contamination in Rancaekek sub-district, Sumedang, Indonesia | Rp.11.4 trillion per year |
3 FINDINGS AND DISCUSSION
Based on the survey, the average cost of replacement and prevention per household is Rp. 67,048 per month or Rp. 804,576 per year. If there are 546 households in the study area (ie two hamlets: RW 04 and RW 17 in Lagadar village), the total economic costs due to groundwater pollution are Rp. 36,608,208 per month or Rp. 439,298,496 per year. The results of data collection are presented in Table 2.
The total economic cost of groundwater pollution is Rp. 36,608,208 per month or Rp. 439, 298,496 per year. This is not cheap for two reasons. First, this amount of money is only estimated for two hamlets. Water pollution caused by the textile industry affects communities along the river basin. Second, the Table 2. Household expenditure related to water consumption in Lagadar Village.
Type of Household Descriptive Statistic (in Rupiah)
Expenditure
Minimum Maximum Mean
Replacement Costs per Household per month
| - Cost to buy bottled | 12.000 | 70.000 | 26.550 |
| water (gallon) | |||
| - Cost to buy tap water | 0 | 50.000 | 22.500 |
| Prevention Costs per Household per | month | ||
| - Cost to build public | 0 | 50.000 | 22.500 |
| artesian well | |||
| - Cost for water | 0 | 50.000 | 39.451 |
| treatment | |||
| Total expenditure related | 20,000 | 120.000 | 67.048 |
to clean water consumption per household per month
Source: authors' calculation based on survey.
calculation of economic costs in this study does not include health costs due to pollution. Thus, the real costs will be more than the costs estimated by this study. Indeed, textile factories have provided employment for the local community. Our survey shows that 55 percent of respondents (49 heads of households) work in factories. However, this should not reduce the company's obligation to preserve the environment around their industrial location, including groundwater. Workers are paid for their work, not to receive pollution.
4 CONCLUSION
This study aims to estimate the economic costs of groundwater pollution borne by residents of two hamlets (RW 04 and RW 17) in Lagadar village due to textile factory wastewater. Economic costs are estimated by calculating replacement and prevention costs from 84 sample households. The average cost of pollution of ground water per household is Rp. 67,048 per month or Rp. 804,576 per year. Because the total number of households in RW 04 and RW 17 from Lagadar is 546, the value of economic losses due to groundwater pollution borne by the population in the two hamlets is Rp. 36,608,208 per month or Rp. 439,298,496 per year. As long as residents bear the costs of pollution, externality exists.
Estimates of the economic costs of pollution can be used as information for compensation payments. However, there are ways to prevent contamination of ground water. Government regulation is one of them. Under these regulations, textile factories must treat their wastewater before disposal. Law enforcement is the main problem. Another way is to make spatial zoning into action. Industrial sites may not be in the same zone as residential areas.
Indonesian textile products that have high competitiveness make Indonesia the 11th largest textile and garment exporter in the world (Greenpeace 2013). However, high product competitiveness must not sacrifice the environment and people who live around textile factories.
REFERENCES
Ahyar, I. & Perkasa, B. 2011. Estimasi nilai kerugian eko- nomi dan willingness to pay masyarakat akibat pence- maran air tanah (Studi kasus di kelurahan Kapuk Muara, Jakarta Utara). Jurnal Ekonomi Lingkungan, 15, 51-69.
Badan Pusat Statistik Jawa Barat. 2014. Jumlah industri besar sedang menurut subsektor industri menurut golongan industri di Jawa Barat, 2010-2014. Retrieved 27 Mei, 2018, from https://jabar.bps.go.id: https://jabar. bps.go.id/statictable/2016/11/11/148/jumlah-industri- besar-sedang-menurut-subsektor-industri-menurut-golon gan-industri-di-jawa-barat-2010-2014.html
Fatma, D. 2017, Januari 2. Pencemaran limbah pabrik. Diakses melalui Ilmugeografi.com: https://ilmugeografi. com/bencana-alam/pencemaran-limbah-pabrik/pada tanggal 6 Mei 2018.
Freeman, A. M., Herriges, J. A. & Kling, C. L. 2014. The measurement of environmental and resource values. New York: RFF Press.
Greenpeace. 2013. Kisah merek-merek ternama dan polusi air di Indonesia. Jakarta: Green Peace Indonesia.
Greenpeace. 2013, April 26. Toxic threads: meracuni surga. Amsterdam: Green Peace International.
Greenpeace. 2016, April. Konsekuensi tersembunyi: valuasi kerugian ekonomi akibat pencemaran industri. Bandung: Greenpeace.
Ministry of Economic Coordinator of Republic Indonesia. 2018.
Kementerian Lingkungan Hidup Republik Indonesia. 2013. Program penilaian peringkat kinerja perusahaan Dalam Pengelolaan Lingkungan Hidup. Peraturan Menteri Lingkungan Hidup Republik Indonesia Nomor 06 Tahun 2013. Indonesia.
Kementerian Perindustrian Republik Indonesia. (n.d.). Sta- tistik Industri. Retrieved Mei 27, 2018, from www. kemenprin.go.id: http://www.kemenperin.go.id/statistik/ peran.php?ekspor=1
Kusumawardani, D. 2011, Desember 3. Valuasi ekonomi air bersih di Kota Surabaya. Majalah Ekonomi, hal. 216-229.
Laughland, A. S., Musser, M. L., Musser, N. W. & Shortle, S. J. 1993. The opportunity cost of time and averting expenditures for safe drinking water. American Water Resources Association 29(2): 291-299.
Lewandowski, A., Montgamery, C. & Moncrief, J. 2008. Groundwater nitrate contamination cost; a survei of private well owners. Journal of Soil and Water Concerva- tion 63(3): 153-161.
Mankiw, N. G. 2009. Principles of economics. China-South Western: Cengage Learning.
Rinita, L., Prabang, S. & Kusno, A. 2012. Valuasi ekonomi eksternalitas penggunaan merkuri pada pertambangan emas rakyat dan peran pemerintah daerah mengatasi pencemaran merkuri (pertambangan emas rakyat di Kecamatan Kokap Kulon Progo). Jurnal Ekonomi dan Sains 4(8): 48-63.
Suhari. (2012). Prediksi tingkat pencemaran air tanah dang- kal daerah Bandung, Jawa Barat. Jurnal Lingkungan dan Bencana Geologi 3(3): 169-179.
Tietenberg, T. & Lewis, L. 2012. Environmental and natural resource economics. New York: Pearson.