Preferences of domestic low-cost carrier airlines passenger in the Greater Jakarta area with conjoint analysis method
S. Novela
Bina Nusantara University, Tangerang, Indonesia
E. L. Ray, N.T.H. Ningsih & S. Fathin
Polytechnic APP, Jakarta, Indonesia
ABSTRACT: Since the air transportation is increasingly needed by society, the airline industry sees considerable market opportunities in Indonesia, resulting in many airlines attempting to establish low-cost carriers.
Low-cost carrier domestic airlines are in great demand in many circles. Knowing the preference for low-cost carrier domestic airlines passengers is very important in order to determine the appropriate strategy in reaching the number of passengers. Preferences are calculated based on attributes using the conjoint analysis method. Respondents were asked to assign values to the level of each attribute. The results show that prices have the highest relative importance (NRP), followed by brand equity, facilities, time, and cabin staff. However, the most preferred combination of low-cost carrier domestic airlines is the price at the time of off-peak, has on-time brand equity, has a 5 kg baggage facility, 7-9 a.m. flight time, and organized cabin staffs. This result implies how low-cost carrier airlines should deliver excellent services by evaluating their marketing and operational strategies.1 INTRODUCTION
Indonesia is an archipelagic nation, connected by various straits and beaches. Therefore, airlines industry has become the necessity of the Indonesian people to travel. In the law No. 1 of year 2009 verses 97 on aviation, airlines industry in Indonesia have three types of services: full service carrier, medium service, and minimum or low-cost airlines (no frills or low-cost carrier) (Azmarani 2016). According to the Statistics Indonesia (BPS 2016), domestic flights reached the level of high number of passengers in 2012 which was 19.24% compared to the previous year. In 2013, the number of passengers reached the highest level, with total number in the period of 2011-2015 being 73.59 million passengers.
Indonesia has five major airlines that implement low-cost carrier, such as Lion Air, Citilink, Wings Air, Tiger Mandala, and Indonesia Air Asia (International Civil Aviation Organization 2017). The growing number of passengers of low-cost carrier airlines in Indonesia from year to year has increased. In 2010, passengers of low-cost carriers reached 51.77 million passengers, while in 2014 the number increased to 76.49 million passengers. It can be seen that the increasing number of passengers of low-cost carriers was 24.72 million (Azmarani 2016).
The tight competition among airlines in Indonesia makes airlines need to improve their services. However, they have to pay attention to the effectiveness and efficiency of the service itself. The service has to meet the needs and wants of customers (Suhar- tanto & Noor 2012). Everyone has their own classification to decide what kind of airline they choose to travel. The classification can be regarded as an attribute. The purpose of customer preferences is to acknowledge customer behavior pattern to purchase or ignore a product or service (Isik & Yasar 2015). This research will elaborate customer preference of the attributes and its combination for domestic airline in Indonesia.
2 LITERATURE REVIEW
Service is a form of product consisting of activities, benefits, or satisfaction offered to consumer. In this case, service includes value which cannot be seen directly, and it does not result in any kind of ownership (Kotler & Armstrong 2014).
Customer preference is defined as the attitude to behave consistently either profitable or unprofitable to related object. These objects can be specific con- sumption/marketing or concept such as product, product use, cause or issue, price, and so on. Attitudes relevant to buying behavior are formed as a result of the direct experience of the product or service. Bogicevic et al. (2017) identified some service attributes such as value, seat comfort, staff/service, and catering as airline attributes that had significant effect on passengers’ recommendations.
3 RESEARCH METHODOLOGY
This research used all selected attributes that have quality which is obtained based on literature review in previous studies.
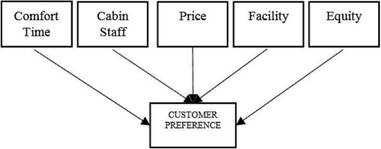
Figure 1. Customer preference.
Conjoint analysis method is used to obtain a combination of attributes of product or service. Sample sizes for conjoint studies generally range from about 150 to 1200 respondents for infinite or very large populations (Orme 2010). Moreover, non-probability sample technique is used to collect 156 respondents. In this research, the customer will be asked to ensure the attribute that becomes the most preferred (Wingdes 2012). The preference is calculated using choice-based conjoint (CBC) because attributes used are for five items, which however do not exceed six items.
4 RESULTS AND DISCUSSION
Among respondents, there were 65% women and 35% men. As many of 93% of them were those who frequently used the airline service one to three times in the last 3 months; 4% had used 4-5 times, and 3% stated used more than 5 times. The most frequent airline used was Air Asia (34%), followed by Lion Air and Citilink (33%) respectively.
After forming the stimuli from the entire level, the costumer preference was calculated by the score from respondents using Microsoft Excel by ordering the stimuli. Names were assigned to the first to sixteenth preference. Each preference is designed by Microsoft Excel formula which then formed group of level, so it could be used automatically to calculate costumer preference for all respondents.
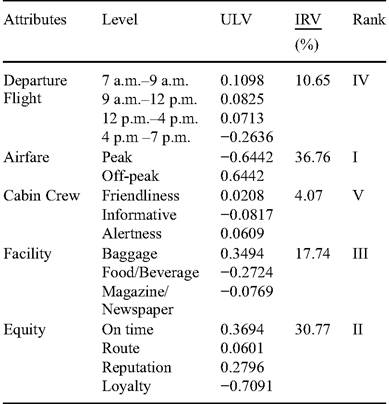
The ranks of Usage Level Value (ULV) were orderly: 0.1098, 0.6442, 0.0609, 0.3494, and 0.3694. In general, by using ULV and IRV (Important Relative Value), it can be stated that customers who run a domestic trip low-cost carrier should consider the off- peak airfare along with the aviation company branding in accordance with the punctual departure flight.
As summarized in Table 1, the results from this study are:
1) Airfare has the highest Important Relative Value or the most crucial attribute. Airfare is the most crucial attribute with IRV 36.76%.
This finding is in line with Ayantoyinbo and Boye’s (2015) finding stating that the airfare has contributed 3.30 from the total of utility;2) Passengers tend to pay the off-peak airfare. With ULV value at 0.6442, passengers mostly love the ticket cost when it is off-peak with the utility value 1.650. This finding is in agreement with the previous research conducted by Ayan- toyinbo and Boye (2015),
3) Airline domestic Low-Cost Carrier passengers have awareness on company branding equity, particularly for on-time case. The brand equity is the second crucial attribute for passengers with an important relative value of 30.77% with “on- time” at the highest level. This result is incompatible with Amegbe’s (2016) finding stating that the brand equity, specifically on the premium class, does not create any burden over passengers to purchase.
4) Facility as the third preferred attribute with IRV i7.74% and “additional luggage of 5 kg” as the highest level. This fact is in contradiction with the finding of Sinaga et al. (2015) which stated that from the four attributes which are tested, facility had the lowest value of IRV. They found that the highest level was the entertainment such as magazine or newspaper, because both of them have important value.
5) Departure flight is preffered at 7-9 a.m. Most of passengers prefer morning departure flight, with an IRV of 10.65%. It shows that airline domestic low-cost carrier is unconsidered when purchased the airfare.
6) Cabin crew service is unimportant attribute. Kankaew (2013) found that the cabin crew is less significant attribute while having trip. This research supports that finding that the crew service turns to be the unimportant one when passengers booked the flight with an IRV of 4.07%.
Table 1. Usage Level Value (ULV) and Important Relative Values (IRV) entirely.
Based on Pearson or Kendall’s tau test, the correlation between estimated preferences and the observed are closely related.
The value has almost reached 1 or surpassed 0.5 which means the prediction is congruent with reality, so as to represent entire population.3 CONCLUSIONS
The combined attributes which are strongly preferred include the departure of flight at 7-9 a.m., the off- peak airfare, the cabin crew services, additional 5 kg luggage, and the company branding equity in accordance with the punctual departure time. For domestic low-cost carrier industry, this research can be used as a reference to reevaluate marketing and operational strategies. The limitation of this research is that it was conducted in the Greater Jakarta area and may not represent the entire airline passengers. Therefore, further research with bigger samples on a wider area is necessary to better represent the population.
References
Amegbe, H. 2016. The influence of customer based brand equity on consumer responses-the newly opened West Hills Mall in Ghana. Trendy v podnikani-Business Trends-Scientific Journal of the Faculty of Economics: 2016/1.
Ayantoyinbo, A. & Boye, B. 2015. Preferences for Nigerian domestic passenger airline industry: a Conjoint Analysis. European Journal of Logistics Purchasing and Supply Chain Management 3(2): 21-27.
Azmarani, A. W. 2016. Analisis kualitas pelayanan maska- pai penerbangan Low Cost Carrier (Studi deskriptif di PT. Citilink Indonesia cabang Surabaya). Kebijakan dan Manajemen Publik 4(3).
Badan Pusat Statistik (BPS). 2016. Retrieved from http:// www.bps.go.id.
Bogicevic, V., Yang W., Bujisic, M. & Bilgihan, A. 2017. Visual data mining: analysis of airline service quality attributes. Journal of Quality Assurance in Hospitality & Tourism.
International Civil Aviation Organization. 2017. List of Low-Cost-Carriers (LCCs). Retrieved from https:// www.icao.int/sustainability/Pages/GATO2030.aspx.
Isik, A. & Yasar, M. F. 2015. Effect of brand on consumer preferences: A study in Turkmenistan. Eurasian Journal of Business and Economics 2015 8(16): 139-150.
Kankaew, K. 2013. Importance-Performance Analysis in airlines service quality: a case study of legacy airlines in Thailand. The International Conference on Tourism, Transport, Logistics 2013. Paris: UP Organizer and Publication Co., Ltd.
Kotler, P. & Armstrong, G. 2014. Principle of Marketing, Pearson Education.
Orme, B. 2010. Getting started with Conjoint Anaysis: strategies for product design and pricing research. Second Edition, Madison, Wis.: Research Publisher LLC.
Sinaga, V. D. M., Safitri, D. & Rusgiyono, A. 2015. Anali- sis preferensi konsumen pengguna jasa maskapai pener- bangan untuk rute Semarang-Jakarta dengan metode Choise-Based Conjoint (Full Profile). Jurnal Gaussian 4(4): 1055-1064.
Suhartanto, D. & Noor, A.A. 2012. Customer satisfaction in the airline industry: The role of service quality and price. Paper presented at Asia Tourism Forum Conference at Indonesia.
Wingdes, I. 2012. Conjoint analysis pada produk dengan media internet. Jurnal Ilmiah SISFOTENIKA 2(1).