Safety behaviour of manufacturing companies in Indonesia
I. Djastuti, M.S. Perdhana & S.T. Raharjo
Diponegoro University, Central Java, Indonesia
ABSTRACT: The high rate of accidents in the workplace makes employees safety be a priority in manufacturing companies.
This is because work safety is closely related to employees’ survival. The paper was aimed to analyze the safety behaviour of employees in manufacturing companies by looking at the influence of three variables namely safety climate, job satisfaction, and safety motivation. This research was carried out in one of the manufacturing companies in Indonesia that produce musical instruments and furniture. The sample was employees in the production section with nonprobability sampling technique. There were 300 respondents who participated in this research, but only 190 questionnaires that were feasible to be processed. This study found that the safety climate and job satisfaction have a positive and significant impact on the safety of employee motivation. Safety motivation also has a positive and significant effect on employee safety behaviour. However, the safety climate does not have a negative effect and not significant on the safety behaviour. Then, job satisfaction has a positive effect but not significant on the safety behaviour. Safety climate and job satisfaction have direct effects to the safety motivation, and safety motivation has a direct effect to the safety behaviour. Then, safety motivation is able to mediate safety climate and job satisfaction on the safety behaviour. Based on the lowest indicator index value of each variable, things that need to be considered are safety support from supervisors, wages, safety behaviour willingness, and safety rules. Therefore, a company need to consider taking a policy in implementing a safety climate and increasing employee job satisfaction in order to improve the safety motivation, which is then expected to create good safety behaviour within the company.1 INTRODUCTION
Accidents that occurred in the industrial companies in Indonesia showed a high rate.
Although there has been a decline since 2014, the number of accidents that occur are still quite large at over 100 thousand cases. Based on data from BPJS Ketenagakerjaan, the number of accidents in 2016 still reached 101 367 cases. The high number of accidents surely must be a concern of all parties to find a solution.Safety is a very important thing to be a major concern of companies, especially manufacturing companies and high-risk enterprise. This is because safety is directly related to the survival of the worker or employee. Quoted from Prihatiningsih & Sugiyanto (2010), Labour Law No. 13/2003 article 86 and 87 explain the importance of workplace safety.
Generally, work accidents occurred due to a weak system of corporate work (O’Toole 2002). Various attempts were made to reduce the number of accidents at the company, such as creating technical solutions, human factors, and regulation. However, those solutions will be meaningless if it is not followed by employee feedback. So it becomes important to analyse the behaviour of the safety among the employees.
To produce employees with good performance, including how to work with a good safety standard would require a stage that is not easy, in addition to motivation, knowledge, and competence, organizational culture must be built on safety-oriented behaviour in order to avoid safety problems. Employee performance is influenced by two factors, namely factor in job satisfaction and organizational commitment as well as external factors, namely leadership, security, safety, and organizational culture.
Safety motivation mediates the relationship between safety climate and safety behaviour (Neal & Griffin 2006). Huda (2016) found that safety motivation has an effect on adherence to safety procedures until 6 months later.
Based on the Maslow theory of needs, people are motivated to meet and satisfy a number of needs that exist in every human being. Employees will feel satisfied if they received feedback from the company in excess of what they expected (Robbins 2013).
Employees will be motivated to do anything, including in terms of the behaviour of the working salvation (Huda 2016).This research was conducted at a manufacturing company located in the city of Semarang where one company performance target is to make safety a top priority. Management companies should have demonstrated a commitment to fully support all efforts related to anticipation of a safety issue. Even if the company and the management has implemented a safety management system with a good, tight, and disciplines including forming department of Health Safety and Environment (HSE), but there are still cases of accident work as shown in the Figure 1:
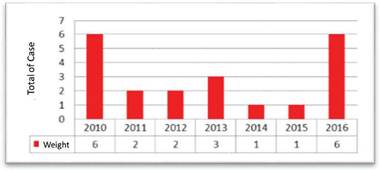
Figure 1. Serious accidents of manufacturing company in Semarang.
2.3 Definition of safety motivation
The term safety motivation refers to the individual’s willingness to make an effort to enforce safe behaviour and valence associated with these behaviours (Neal & Griffin 2006). Individuals have to be motivated to comply with safe work practices and participate in safety activities if they feel that there is a positive safety climate in the workplace. According to Huda (2016), motivation can be divided into two dimensions, which will boost safety behaviour and willingness to conduct workplace safety.
From the data above, it can be implied that problems between the targets of the first strategy of Indonesian Manufacturing in 2016 is zero occupational accidents with the data safety performance in 2016 as there is still a severe increase in cases of work accidents.
2 THEORETICAL FRAMEWORK AND HYPOTHESES
2.1 Definitionofsafetyclimate
Seo (2004) defines the organizational climate as an overall perception that a person has about the settings in their workplace. Climate often referred to as something temporary and subjective. While the safety climate is a picture of perceptions related to policies, procedures and safety practices (Prihatiningsih & Sugiyanto 2010).
Meanwhile, according to Zohar & Luria (2005), safety climate is defined as the perception of the safety of employees who describe their confidence in the safety priorities. That perception reflects the expectation of the results of their work behaviour.Social perceptions of safety will give description against employees how management commitment to the health and safety of their work. Perception of safety appears with a variety of experiences on the extent to which the management employees to invest in protecting them. A positive safety climate can improve the safety behaviour of employees working in the hazardous working environment and vice versa.
2.2 Definition of job satisfaction
Job satisfaction is not a single concept whereby one can be satisfied with some aspects and feel not satisfied with other aspects (Kreitner & Kinicki 2010). Job satisfaction is an attitude or behaviour which is owned by the individual common to the work that he did (Robbins & Judge 2015). When an individual has a high satisfaction with the job then he is likely to display positive behaviours or attitudes, and vice versa.
Luthans (2011) defines job satisfaction as a person’s perception of how good and important the job they have. It can be concluded that job satisfaction is a feeling that arises because of the perception of their work shown in attitude or behaviour towards the work itself.
2.4 Definition of safety behaviour
Hsu (2008) states that conducting employee safety is always abode by the rules and safety procedures. Employees can play it safe or unsafe when they do their job. Therefore, the behaviour of employees in the workplace is very important to minimize safety concerns. In addition, the safety behaviour was found to prevent accidents from happening (Marti- nez-Corcoles et al. 2011). Previous studies’ results implied that the safety behaviour is the right approach in reducing accidents in the workplace. To determine the safety behaviour, there are two dimensions of behaviour that cover safety compliance and safety participation.
According IOHS (Institution of Occupational Safety and Health direction 06.1), safety behaviour is part of the development of the safety management of the approach that is very prescriptive through systems engineering or procedural that are mostly applied in progressive companies that are long established. It should also be applied in the companies as workers are adult human beings with a genuine interest to improve their welfare and who will give their best, but they also need to realize of their own safety in working. To change the behaviour, a transition needs to be done to change the culture of the working group involved so that this approach does not give instant results.
Human behaviour is often categorized as a reflex/ automatic which can be considered as a habit. The behavioural approach focuses on custom category but not for blaming or punishing workers, a kind of action that is mostly counterproductive in any case. An effective approach is to identify and measure the secured and non-secured (risky) behaviour that happens in the workplace and manage it well. Measuring behaviour may provide a health and safety system with more proactive management. This is for the stability of the safety.
According to Neal & Griffin (2006), behavioural safety of employees can be divided into two dimensions, namely safety compliance and safety participation. Safety compliance refers to the core activities of the individual to be done to maintain safety in the workplace. This behaviour includes following standard operating procedure and wearing personal protective equipment. Safety participation describes the behaviour that does not directly contribute to an individual’s personal safety but helps develop an environment that supports safety. This behaviour includes activities such as participating in a voluntary safety activities, help colleagues with the issues related to safety, and attend safety meetings.
The present study tried to investigate the influence of safety variables by testing five hypotheses as follows:
Hypotheses (See in Figure 2):
H1: Safety Climate has a positive and significant effect on the safety motivation.
H2: Job satisfaction has a positive and significant effect on the safety motivation.
H3: Safety Climate has a positive and significant effect on the safety behaviour.
H4: Job satisfaction has a positive and significant effect on the safety behaviour.
H5: Safety Motivation has a positive and significant effect on the safety behaviour.
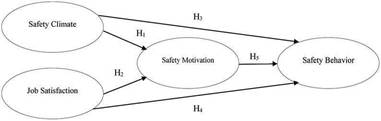
Figure 2. Research framework.
3 RESEARCH METHOD
The population is defined as the entire group of people, events, or things to be investigated by researchers (Sekaran, 2006). Further, population is also referred to a generalization region consisting of the objects/subjects that have certain qualities and characteristics defined by the researchers to be learned and conclusions drawn (Sugiyono 2008). The population involved in this study were employees of a manufacturing company.
The sample is a fraction of the number and characteristics of a population (Sugiyono 2008). Samples are some members of the population. A researcher can analyze samples when the population is too large for the overall study and constrained limitations of time, effort, and funds. The sampling design used in this research is to nonprobability (nonprobability sampling). Nonprobability sampling is a sampling technique that does not give the same opportunity or chance on every member of the population to be used as a sample (Sugiyono 2008).
The study employed purposive sampling as the researchers have understood that the required information can be obtained from a particular group that is able to provide the desired information and they have fulfilled criteria determined (Ferdinand 2014). The tool used to process the data in this study is SEM (Structural Equation Model) which is operated by AMOS (Analysis of Moment Structure).
4 RESULTS AND DISCUSSION
4.1 Overview of respondents
The number of respondents who filled out questionnaires is 300, yet only 190 eligible questionnaires were analysed. Of the total number of 190 respondents, 49 percent (n = 93) were women, and the remaining 51 percent (n = 97) were male. In terms of employment, employees with longer than two years to dominate 53 percent, n = 101), followed by employees with a working time of 6 months - 1 year (27 percent, n = 51), employees with long work for more than 6 months (10 percent, n = 19), and employees with long working 1-2 years (10 percent, n = 19) (See in Table 1).
4.2 Measurement models
Chi-square is the most fundamental measure that indicates the conformity of the overall model. If the value of Chi-Square it will produce a small probability of large, it indicates that the sample covariance matrix of the covariance matrix of the model did not differ significantly (Ghozali 2016), fit structural equation model Chi-Square if the value is small and the probability of > 0.05. The use of Chi-Square is only suitable for use in the study sample totalled 100-200 and if the sample size is outside the range of the sample size, the significance tests become less reliable (Ferdinand 2014). In this study, Chi-Square values obtained at 189.113 with a probability of 0.087, so it can be said that the structural equation model has been developed well.
Level of significance of probability is a statistical measure that is fundamental in determining whether H0 (null hypothesis) can be rejected. In the analysis, using structural equation modelling approach (SEM) is expected.
H0 is not rejected, it is different with hypothesis testing in general. Good model should not reject H0. Thus, the significance of the expected probability is greater than 0.05 or 0.10 in order not to reject H0. If the results of this research data generating significance probability of 0.087, while the implied value
Table 1. Goodness of fit test results overall feasibility model Structural Equation Model (SEM).
Goodness of Cut-off Value
Fit Index
Results Details
Model
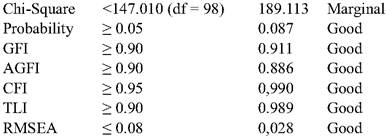
for the level of significance probability is ≥ 0.05, thus it can be concluded that there is sufficient evidence to negate H0. It means that the alternative hypothesis cannot be accepted. Therefore, it can be concluded that there is no difference between the matrix of variance/covariance matrix samples with variance/covariance population.
Goodness of Fit Index (GFI) is a non-statistical measure which reflects the level of accuracy of the model obtained from the predicted residual quadratic models compared to the actual data, which has a range from 0 to 1 and getting closer to 1 indicates the model is getting better. In this study, the limit values for states GFI fit model is ≥ 0.90 and GFI value between 0.8 up to 0.9 is said to be marginal fit. GFI value in this research is 0.911, so the model can be considered good.
Adjusted Goodness of Fit Index (AGFI) is a development of GFI adjusted to the degree of freedom for the proposed model. A model is said to be fit when the value AGFI ≥ 0.90 and AGFI value between 0.8 - 0.9 is said to be marginal fit. In this study, the value of AGFI amounted to 0.886, so that the structural equation model we tested is said to be marginal fit.
CFI value of 0,990 above the value of 0.95 which is a CFI value required, so it can be stated that the condition of good standard CFI value. Furthermore, the TLI value of 0.989 is more than 0.90, which is the value TLI required, meaning that the value of a good standard TLI. Then, for a value of 0.028 RMSEA below 0.08 which is an RMSEA value required, so that the value of a good standard RMSEA.
4.3 Hypotheses testing
Once the model has been declared fit, then it was followed by hypothesis testing that was carried out by looking at the significance of the estimated value, the critical ratio, and probability (See in Table 2). Table 2 shows that all the significant value of parameter estimation of each relationship has a value of directly has a negative effect, but if through the safety motivation through the safety behaviour, it becomes positive. The results of the Sobel Test showed that safety motivation can mediate safety climate and job satisfaction on the safety behaviour.
The results showed a positive correlation between safety climate, job satisfaction, and motivation safety of the employees’ safety behaviour in manufacturing companies in Indonesia. Considering the possibility of potential work accidents whether mild or severe, the company needs to pursue some policies on a regular basis by conducting a survey measuring the behaviour of the employees by a factor measured is the level of compliance of safety (safety compliance) and participation in anticipating danger, considering the frequent turnover for system contract. The survey followed up by a policy in anticipation of declining employee safety behaviour including improving the quality of safety motivation.
The limitation in this study is the reduction of indicators in research in order to get the model Fit in quantitative data processing as there is still fit criteria which do not meet that standard with marginal results Probability. In addition, the sources of respondents are still limited that only 300 respondents and the number of questionnaires that can be analysed only 190.
Some suggestions for future research are also proposed. The first suggestion for further research is to explore the relationship between safety climates on the safety behaviour as studies focusing on this issue very limited literature. Secondly, it is necessary to do research again on the relation of safety climate employees’ safety behaviour because there is still a gap between the research results with one another. Third, future research needs to do research on the positive side and negative on the safety of employees’ behaviour in addressing the safety climate in an organization. It is able to provide solutions to organizations in taking climate policy in applying safety and increase employees’ job satisfaction in order to increase the motivation of safety and to create good safety behaviour within the organization. Then, it is suggested for future research to conduct study in a larger scope since number of respondents in this study is limited in order to meet the test of goodness of chi-square test.
REFERENCES
Ferdinand, A. 2014. Metode Penelitian Manajemen, 5th ed.
Semarang: Badan Penerbit Universitas Diponegoro.
Ghozali, I. 2016. ApHkasi Analisis Multivariate Dengan Program IBMSPSS 23, 8th ed. Semarang: Badan Pener- bit Universitas Diponegoro.
Hsu, S.H. 2008. A Cross-Cultural Study of Organizational Factors on Safety: Japanese vs. Taiwanese Oil Refinery Plants. AccidentAnalysis and Prevention 40(1): 24-34.
Huda, U.F. 2016. Model Perilaku Keselamatan Kerja Kar- yawan Pada Industri Berisiko Tinggi. Jurnal Manaje- men Teknologi 15(1): 51-66.
Kreitner, R. & Kinicki, A.J. 2010. Organizational Behavior. New York: McGraw-Hill.
Luthans, F. 2011. Organizational Behavior : An EvidenceBased Approach. New York: McGraw-Hill.
Martinez-Corcoles, M., Gracia, F., Tomas, I. & Peiro, J.M. 2011. Leadership and employees’ perceived safety behaviours in a nuclear power plant: A structural equation model. Safety science 49(8-9): 1118-1129.
Neal, A. & Griffin, M.A. 2006. A Study of the Lagged Relationships among Safety Climate, Safety Motivation, Safety Behavior, and Accidents at the Individual and Group Levels. Journal of Applied Psychology 91(4): 946-953.
O’Toole, M. 2002. The Relationship between Employees’ Perceptions of Safety and Organizational Culture. Journal of Safety Research 33(2): 231-243.
Prihatiningsih & Sugiyanto. 2010. Pengaruh Iklim Kesela- matan Dan Pengalaman Personel Terhadap Kepatuhan Pada Peraturan Keselamatan Pekerja Konstruksi. Jurnal Psikologi 37(1): 82-93
Robbins, S. 2013. Organizational Behavior. London: Pearson Higher Education.
Robbins, S.P. & Judge, T.A. 2015. Perilaku Organisasi. Jakarta: Salemba Empat.
Sekaran, U. 2006. Metodologi Penelitian Untuk Bisnis, 4th ed., Jakarta: Salemba Empat.
Seo, D.C. 2004. A Cross-Validation of Safety Climate Scale Using Confirmatory Factor Analytic Approach. Journal of Safety Research 35(4): 427-445.
Sugiyono. 2008. Metode Penelitian Bisnis. Bandung: Alfabeta.
Zohar, D. & Luria, G. 2005. A multilevel model of safety climate: cross-level relationships between organization and group-level climates. Journal of applied psychology 90(4): 616.